

Abstract
pH is an important physiological parameter that plays a critical role in cellular and tissue homeostasis. Conventional small molecular pH sensors (e.g., fluorescein, Lysosensor) are limited by broad pH response and restricted fluorescent emissions. Previously, we reported the development of ultra-pH-sensitive (UPS) nanoprobes with sharp pH response using fluorophores with small Stokes shifts (<40 nm). In this study, we expand the UPS design to a library of nanoprobes with operator-predetermined pH transitions and wide fluorescent emissions (400–820 nm). A copolymer strategy was employed to fine tune the hydrophobicity of the ionizable hydrophobic block, which led to a desired transition pH based on standard curves. Interestingly, matching the hydrophobicity of the monomers was critical to achieve a sharp pH transition. To overcome the fluorophore limitations, we introduced copolymers conjugated with fluorescence quenchers (FQs). In the micelle state, the FQs effectively suppressed the emission of fluorophores regardless of their Stokes shifts and further increased the fluorescence activation ratios. As a proof of concept, we generated a library of 10 nanoprobes each encoded with a unique fluorophore. The nanoprobes cover the entire physiologic range of pH (4–7.4) with 0.3 pH increments. Each nanoprobe maintained a sharp pH transition (on/off < 0.25 pH) and high fluorescence activation ratio (>50-fold between on and off states). The UPS library provides a useful toolkit to study pH regulation in many pathophysiological indications (e.g., cancer, lysosome catabolism) as well as establishing tumor-activatable systems for cancer imaging and drug delivery.
Introduction
Nanomaterials responsive to external stimuli such as pH, temperature, reactive oxygen/nitrogen species, or enzyme levels have been extensively explored for a wide range of biological applications in molecular sensing, drug delivery, and tissue engineering.1−5 Compared to small molecular sensors, responsive nanomaterials often display positive cooperativity with sharpened responses, a hallmark of the supramolecular self-assembly system described by Whitesides over two decades ago.6,7 Supramolecular self-assembly engages a multitude of multivalent, weak, and reversible noncovalent interactions (e.g., electrostatic, hydrogen bonding, and hydrophobic interactions) to form thermodynamically stable nanostructures (ΔG ≤ 0). This strategy has the advantage of dramatic phase transitions upon subtle perturbation of environmental stimuli. Such strategies have been exploited in artificial systems such as thermosensitive hydrogels (e.g., NIPAM,8 elastin-like proteins9) for drug delivery, as well as by nature in protein oligomerization to counter large-scale cellular responses to amplify biological signals.10
In recent years, our lab has focused on the development of ultra-pH-sensitive (UPS) nanoparticles using self-assembly principles. pH is an important physiological signal that plays a critical role in maintaining cellular and tissue homeostasis. At the molecular level, the pH gradient across the mitochondria membrane is essential for ATP synthesis.11 At the cellular level, the pH of intracellular compartments (e.g., endocytic vesicles) in eukaryotic cells is carefully controlled and directly affects many processes such as membrane transport, receptor cycling, lysosomal catabolism, and virus entry into cells.12−14 Inhibition of lysosomal function by the impairment of lysosomal pH has been associated with the lack of Aβ degradation and subsequent neuronal cell death in Alzheimer’s disease.15,16 At the tissue level, the interstitial pH is carefully controlled at 7.2–7.4. In the tumor microenvironment, cancer cells display a “reversed” pH gradient with a constitutively increased cytoplasmic pH and lowered extracellular pH (pHe = 6.5–6.9)17,18 that promotes matrix degradation and cancer metastasis. Recently, this dysregulated pH has been described as a universal characteristic of cancer.17
Previously, we reported a series of ultra-pH-sensitive micelle nanoparticles using a block copolymer design (PEO-b-PR, where PEO is poly(ethylene oxide) and PR is an ionizable tertiary amine block).19−22 Tertiary amine-containing monomers with precisely controlled hydrophobic substituents were employed to render different pH transitions. At low pH, micelles dissociate into cationic unimers with protonated ammonium groups (left panel in Figure 1a). Fluorophores conjugated on the PR segment emit strong fluorescence. When pH increases, the neutralized PR segments become hydrophobic and self-assemble into the micelles, which results in fluorescence quenching (right panel). Hydrophobic micellization dramatically sharpens the pH transitions (on/off states is <0.25 pH unit, compared to 2 pH units for small molecular pH sensors as dictated by the Henderson–Hasselbalch equation23). Using this design, we successfully differentiated the compartmental pH between early endosomes (6.0–6.5) and late endosomes/lysosomes (4.5–5.5), which led to an early endosome-activatable nanocarrier (transition pH, or pHt = 6.3) for siRNA delivery.24 More recently, we demonstrated the use of a pHt 6.9 nanoprobe to turn on the fluorescence signal in the acidic microenvironment of tumors (pHe = 6.5–6.9) while keeping silent during blood circulation (7.4) for cancer-specific imaging of a broad range of tumors.22
Figure 1.
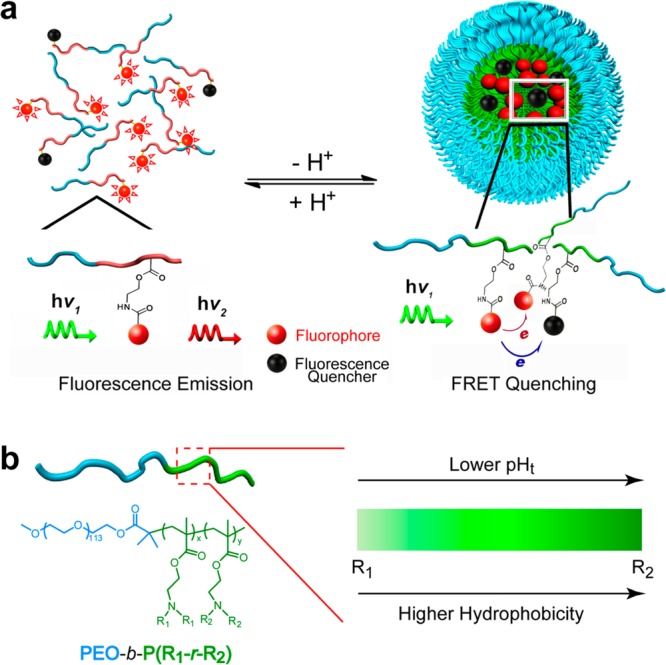
Schematic design of ultra-pH-sensitive (UPS) micellar nanoprobes. (a) In the unimer state (pH < pHt), polymer dissociation resulted in fluorophore/quencher separation and strong fluorescence emission. In the micelle state (pH > pHt), fluorescence quenching dramatically suppresses the emission intensity of fluorophores. (b) A random copolymer strategy was used to achieve an operator-predetermined control of nanoprobe pHt by the ability to continuously fine tune the hydrophobicity of the PR segment.
Despite these successes, the previous UPS nanoprobe design is limited in two aspects: first, the homopolymeric PR segment synthesized from a single monomer only provides limited control of transition pH; second, the fluorophores were limited to those with a small Stokes shift (<40 nm) due to the homoFRET-induced decay mechanism. To overcome these limitations, we now report a copolymer strategy to fine tune the hydrophobicity of the PR segment for pHt control (Figure 1b) and, moreover, to introduce fluorescence quenchers (FQs) to broaden the dye selection. Consequently, we established a UPS library with operator-predetermined pH transitions covering the entire physiologic pH range from 4 to 7.4 using a wide range of fluorophores (400–820 nm). The library consists of 10 nanoprobes with 0.3 pH increment each encoded with a unique fluorophore. Each nanoprobe maintained the sharp pH transition (on/off < 0.25 pH) and high fluorescence activation ratio (>50-fold between on and off states). This UPS library provides a valuable toolkit to interrogate a variety of cell physiological processes involving pH regulation as well as tumor-activatable systems for image-guided surgery and drug delivery applications.
Results and Discussion
Copolymer Syntheses by the ATRP Method
We used the atom transfer radical polymerization (ATRP) method25,26 with CuBr as a catalyst and N,N,N′,N′,N″-pentamethyldiethylenetriamine (PMDETA) ligand for copolymer synthesis (Figure 2). The PEO-b-PR copolymers with homopolymeric PR block were synthesized using a single metharylate monomer as previously described.19,20 In order to continuously fine tune the hydrophobicity of the PR segment, we employed a copolymerization strategy using two methacrylate monomers with different hydrophobicity (Figure 2). The molar fraction of the two monomers can be precisely controlled prior to polymerization, leading to a random copolymerized P(R1-r-R2) block.27 A series of methacrylate monomers with different dialkyl chain lengths (e.g., ethyl, propyl, butyl, and pentyl) was used in the current study. To introduce fluorophores or fluorescence quenchers, we also incorporated aminoethyl methacrylate (AMA-MA) (three repeating units per polymer chain) where the free amino groups were conjugated to dyes or FQs through activated N-hydroxyl succinimidyl (NHS) esters.
Figure 2.

Syntheses of dye- or fluorescence quencher (FQ)-conjugated PEO-b-P(R1-r-R2) copolymers. The hydrophobicity of the PR segment can be continuously controlled by varying the molar fractions of the two monomers (R1 or R2 = Et, ethyl; Pr, propyl; Bu, butyl; Pe, pentyl).
After syntheses, we characterized the copolymers with 1H and 13C NMR to verify the chemical composition and used gel permeation chromatography (GPC) to measure the number- and weight-averaged molecular weights and polydispersity (Supporting Information Tables S1–S3, Figures S1–S6). GPC analysis of representative dye-conjugated copolymers showed complete removal of the free dyes after purification (Supporting Information Figure S7). Glass transition temperatures (Tg) and melting temperatures (Tm) of the copolymers were measured by differential scanning calorimetry (DSC). The onset decomposition temperatures (Td) and temperature of 50% weight loss (T50) were measured by thermogravimetric analysis (TGA, Supporting Information Tables S3). The apparent pKa values of the copolymers were obtained by pH titration (Supporting Information Tables S1, S2, and S4).
Comparison of Copolymerization vs Molecular Mixture Strategy for pHt Control
Initially, we compared two different strategies on their abilities to control the pHt values of UPS nanoprobes. The first strategy involves a molecular mixture of two different PEO-b-PR copolymers with different pH transitions. In this example, we used Cy5-conjugated PEO-b-poly[2-(diethylamino)ethyl methacrylate] (PDEA, all copolymers were conjugated with Cy5 dye in the PR segment unless specified otherwise) and PEO-b-poly[2-(dipentylamino)ethyl methacrylate] (PD5A). The PDEA and PD5A nanoprobes had pH transitions at 4.4 and 7.8, respectively. We used a sonication method to produce a micelle nanoprobe consisting of both copolymers with the same molar percentage (i.e., 50%) in each micelle (this was verified by heteroFRET experiments, data not shown). In the second strategy, we synthesized the Cy5-conjugated PEO-b-poly[2-(diethylamino)ethyl methacrylate-r-2-(dipentylamino)ethyl methacrylate] copolymer (P(DEA40-D5A40); unless noted otherwise, this nomenclature (without r) refers to a random PR block) where the PR segment was composed of a random copolymer from two monomers (40 repeating units for each monomer, Supporting Information Table S1). The hydrodynamic diameters were 65 and 29 nm for PDEA/PD5A (molecular mixture) and P(DEA40-D5A40) (copolymer) micelles, respectively.
The two micelle designs show drastically different patterns of fluorescence emission in response to changes in pH. For the PDEA/PD5A nanoprobes, we observed two distinctive pH transitions corresponding to the individual copolymers where the fluorescence on/off transitions were at 4.4 and 7.8 (Figure 3a, Supporting Information Figure S8). This result suggests that chain entanglement between PDEA and PD5A within the micelle core is not sufficient to overcome individual polymer dissociation behavior. In contrast, the P(DEA40-D5A40) nanoprobe showed a single pH transition at 6.0, about halfway between the PDEA and the PD5A transitions.
Figure 3.
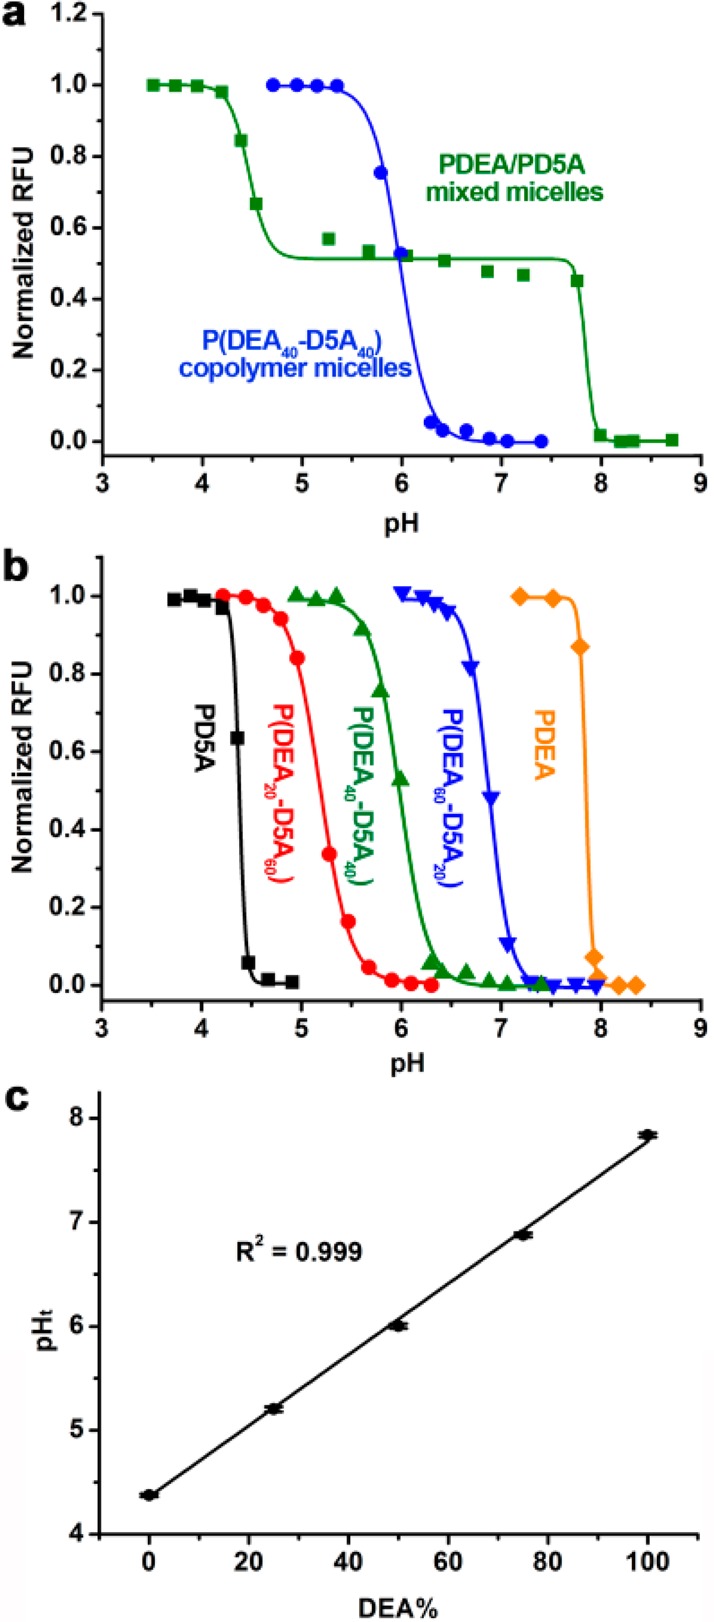
(a) Comparison of PDEA/PD5A molecular mixture vs P(DEA40-D5A40) copolymer strategies for control of pHt. (b) Normalized fluorescence intensity of P(DEAx-D5Ay) nanoprobes with different ratios of the two monomers as a function of pH. (c) Nanoprobe pHt is linearly correlated with the molar fraction of the DEA-MA monomer in the PR segment. Error bars were calculated from three repeating experiments (n = 3). Polymer concentrations were 0.1 mg/mL in these studies.
To explore the control of transition pH, we synthesized a series of P(DEAx-D5Ay) copolymers with varying molar fractions of the two monomers. The resulting copolymers displayed different pH transitions (Figure 3b, Supporting Information Figure S9). Plot of pHt of nanoprobes as a function of the molar fraction of DEA monomer showed a linear correlation (Figure 3c). Incorporation of a higher percentage of less hydrophobic monomers (e.g., DEA-MA) resulted in higher pH transitions. It is worth pointing out that the transition pH of the UPS nanoprobes is controlled by varying the hydrophobicity of the PR segment. This is contrary to small molecular pH sensors, where electron-withdrawing or -donating groups are necessary for fine tuning.28
Monomer Compatibility Affects Sharpness of pH Transition
Although P(DEAx-D5Ay) nanoprobes with different monomer percentage allowed control of transition pH (Figure 3b and 3c), the sharpness of the pH transition was significantly broader than the corresponding nanoprobes with homopolymeric PR segment. More specifically, the ΔpH10–90% values (pH range where fluorescence intensity increases from 10% to 90%) were 0.65, 0.64, and 0.47 for P(DEAx-D5Ay) copolymers with 25%, 50%, and 75% of DEA-MA compositions, respectively, in comparison to 0.14 and 0.19 for PDEA and PD5A nanoprobes, respectively. The broad pH response from P(DEAx-D5Ay) copolymers indicates the heterogeneous chain properties from the monomers with large hydrophobicity differences.
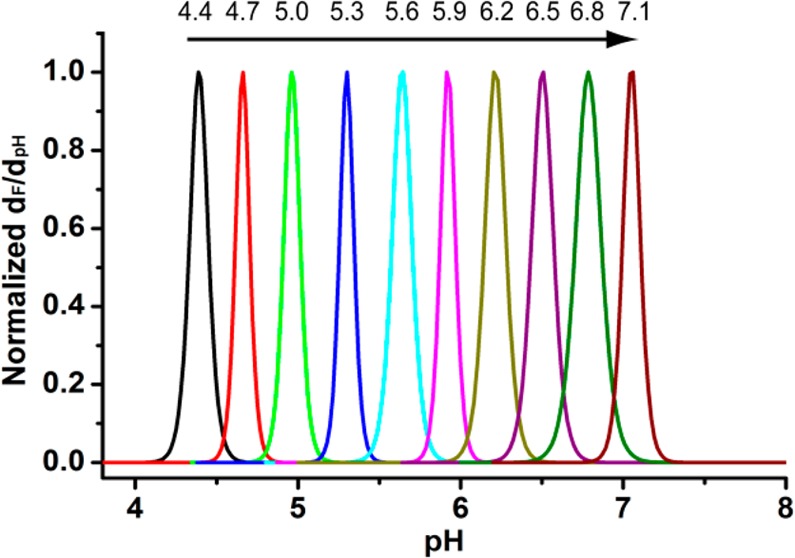
To improve the sharpness of pH transition, we investigated the use of monomers with closely matched hydrophobicity. As an example, we chose 2-(dipropylamino)ethyl methacrylate (DPA-MA) and 2-(dibutylamino)ethyl methacrylate (DBA-MA) to produce a series of P(DPAx-DBAy) nanoprobes. The two monomers differ by one carbon on the nitrogen substituents (i.e., propyl vs butyl). Copolymerization of the two monomers led to a more refined, tunable series of nanoprobes with sharp pH transitions (Figure 4a, Supporting Information Figure S10). The ΔpH10–90% values were 0.19, 0.20, and 0.18 for P(DPAx-DBAy) nanoprobes with 25%, 50%, and 75% of DPA-MA compositions, respectively. Each copolymer probe maintained the sharp pH transition (<0.25 pH unit). Figure 4b shows a fluorescence derivative plot as a function of pH, which further illustrates the greatly increased sharpness of serial P(DPAx-DBAy) nanoprobes compared to a single P(DEA40-D5A40) nanoprobe in the same pH span.
Figure 4.

(a) Normalized fluorescence intensity as a function of pH for Cy5-conjugated P(DPAx-DBAy) nanoprobes. (b) Derivative fluorescence plot (dF/dpH, data from a) as a function of pH for P(DPAx-DBAy) vs P(DEA40-D5A40) nanoprobes. Use of methacrylate monomers with close hydrophobicity (i.e., DPA/DBA vs DEA/D5A) resulted in much sharper pH transitions. (c) Linear relationships of the nanoprobe pHt vs molar fraction of the less hydrophobic monomer for different copolymer compositions. These correlations serve as the standard curves for selecting the optimal copolymer composition to achieve an operator-predetermined pHt. (d) Representative library of UPS nanoprobes with 0.3 pH increment covering the physiologic range of pH 4–7.4. All nanoprobes were conjugated with the Cy5 dye. Polymer concentrations were at 0.1 mg/mL.
To further investigate the PR structure on nanoprobe performance, we also synthesized two Cy5-conjugated triblock copolymers, PEO-b-P(D5A40-b-DEA40) and PEO-b-P(DBA40-b-DPA40) (or P(D5A40-b-DEA40) and P(DBA40-b-DPA40), where b is used to denote the diblock nature of the PR1 and PR2 segments). pH titration experiments showed two distinctive ionization transitions for the P(D5A40-b-DEA40) and P(DBA40-b-DPA40) copolymers (Supporting Information Figures S11a and S11c). In contrast, only one pH transition was observed for the corresponding random PR block copolymers. For the P(D5A40-b-DEA40) nanoprobe, we observed two fluorescence transitions at pH 5.3 and 6.1 (Supporting Information Figure S11b), which is attributed to D5A40 and DEA40 blocks, respectively. For the P(DBA40-b-DPA40) nanoprobe, we were not able to detect two distinctive fluorescence transitions over pH (Supporting Information Figure S11d). However, the pH response for this probe (ΔpH10–90% = 0.64) is considerably broader than the P(DPA40-r-DBA40) nanoprobe (ΔpH10–90% = 0.20). It is interesting to note that the pHt values of the two nanoprobes were also different (5.51 vs 5.70 for the P(DBA40-b-DPA40) and P(DBA40-r-DPA40) nanoprobes, respectively) despite similar chemical compositions. These results indicate that in addition to chemical composition, PR architecture also affects the physicochemical and fluorescence properties of the resulting nanoprobes. On the basis of these data, we conclude that a random copolymer (i.e., P(R1-r-R2)) from monomers with closely matched hydrophobicity provides the best strategy to fine tune the hydrophobicity of PR block to achieve a single and sharp pH transition for construction of UPS library.
A plot of pHt values of the P(DPAx-DBAy) nanoprobes as a function of the molar fraction of DPA-MA monomer yielded a linear correlation (Figure 4c). Similarly, we established standard curves for P(DBAx-D5Ay) and P(DEAx-DPAy) series. These standard curves allow for rational design of UPS nanoprobes with any predetermined pH transitions (between 4.4 and 7.8) by choosing copolymers with correct PR compositions (i.e., monomer pairs and molar fractions). For proof of concept, we generated a UPS library consisting of 10 nanoprobes at 0.3 pH increment covering the entire physiologic range of pH (4–7.4) with each nanoprobe maintaining the sharp pH transition (<0.25 pH unit between on and off states, Figure 4d, Supporting Information Figures S12 and S13). Particle size and size distribution, zeta potential at pH 7.4 in the PBS buffer, and corresponding pKa and pHt values for each nanoprobe are listed in the Supporting Information Table S4.
To verify the pH-dependent micelle assembly of the copolymer nanoprobes, we chose two representative samples, P(DEA40-D5A40) and P(DPA40-DBA40), and employed dynamic light scattering (DLS) and transmission electron microscopy (TEM) to study these samples at pH above and below their pHt (5.99 and 5.70, respectively). At pH 7.4 in the PBS buffer, both nanoprobes were present as spherical micelles by TEM and the hydrodynamic diameters (Dh) were 29.4 ± 3.4 and 36.3 ± 2.4 nm for P(DEA40-D5A40) and P(DPA40-DBA40) by DLS analysis, respectively (Supporting Information Figures S14 and S15, Table S5). At pH 5.0, both micelles dissociated into unimers with decrease of Dh to 9.2 ± 0.4 and 7.3 ± 0.7 nm, respectively. TEM and DLS analyses of both nanoprobes in 10% fetal bovine serum (FBS) in cell culture medium showed similar pH dependence, suggesting the stability of the nanoprobes in the biological environment at pH 7.4. Additional stability study using TMR-conjugated UPS6.5 nanoprobe (P(DEA21-DPA79)) showed a high fluorescence activation ratio (>40-fold) in the presence of 10% FBS, 50% mouse serum, or solutions containing different serum proteins (e.g., 20 mg/mL albumin, 5 mg/mL γ-globulin) at 37 °C over 24 h (Supporting Information Figure S16).
Characterization of Dye-Conjugated Copolymers
In the copolymer syntheses (Figure 2), we introduced three primary amine-containing AMA-MA units per polymer chain. In this study, we chose four representative NHS esters of marina blue (MB), BDY493, TMR, and Cy5 and conjugated them to a model PDPA copolymer. After purification of free dyes from the dye-conjugated copolymer, we measured the yields of dye conjugation and studied the photophysical properties of the resulting nanoprobes. Results show consistent 68–72% conjugation efficiency for these fluorophores, which corresponds to an average of two dyes per polymer chain (Supporting Information Table S6). To investigate the photophysical properties, we measured the quantum yields (ΦF) of polymer-conjugated dyes and compared them to the free dyes in methanol. As a control, we also measured the quantum yields of free dyes in a physical mixture with the same quantity of dye-free copolymers. Results show the quantum yields of polymer-conjugated dye did not change for Cy5 (ΦF = 0.28), decreased to a small degree for MB (0.89 to 0.73), and decreased greatly for TMR (from 0.68 to 0.15 from free TMR to polymer-conjugated TMR, respectively). The large decrease of ΦF for TMR can be due to formation of H-dimers as previously reported.20 Interestingly, the ΦF value decreased dramatically from 0.90 of free BDY493 to 0.10 for polymer-conjugated BDY493. Addition of a small amount of HCl in methanol solution recovered the ΦF to 0.87, suggesting that photoinduced electron transfer (PeT) from free tertiary amines (before protonation) to BDY493 is responsible for fluorescence quenching. Intramolecular PeT yielded much more efficient quenching since a physical mixture of dye-free polymer at the same polymer concentration only slightly decreased the ΦF of the free dye (0.86, Supporting Information Table S6).
We formed micelle nanoprobes from PDPA-TMR and PDPA-BDY493 copolymers (pHt = 6.2) and measured the ΦF values at the micelle state (pH 7.4) and unimer state (pH 5.0) in aqueous environment. For the PDPA-TMR nanoprobe, the ΦF value decreased from 0.25 at pH 5.0 to 0.0048 at pH 7.4, representing a 52-fold decrease from the on to off state of the nanoprobe. In contrast, the ΦF value of PDPA-BDY493 decreased only 12-fold from pH 5.0 (ΦF = 0.93) to pH 7.4 (0.076). Cell culture experiments using the PDPA-BDY493 and PDPA-MB nanoprobes showed high medium background signal and low imaging contrast of H2009 cancer cells (SNRcell/SNRMed < 5, where SNRcell and SNRMed are the signal-to-noise ratios of the cancer cells and medium, respectively, Supporting Information Figures S17 and S18). A better nanoprobe design with large fluorescence activation ratio between the off and on states is necessary to improve cellular imaging specificity.
Use of Fluorescence Quenchers To Broaden Fluorophore Selection
Previously, we reported homo-FRET-induced fluorescence decay as the main mechanism to achieve the on/off activatable design of the UPS nanoprobes.20 This mechanism only applies to fluorophores (e.g., rhodamine and cyanine dyes) with small Stokes shifts (<40 nm). For dyes with large Stokes shifts (e.g., marina blue or PPO, Δλ ≥ 100 nm), the fluorescence activation ratio (RF = Fon/Foff, where Fon and Foff are the fluorescence intensity at on and off states, respectively) was less than 5. Moreover, for BODIPY dyes, the fluorescence activation ratio is relatively low (RF <15) as a result of the PeT mechanism.29−31
To overcome these limitations, we investigated the use of fluorescence quenchers (FQs) to broaden the fluorophore selection. Fluorescence quenchers have been widely used by many groups for the design of activatable imaging probes.32−35 The mechanism is based on the fluorescence resonance energy transfer from desired fluorophores to the FQs, which subsequently dissipate the radiative energy into heat. In this design, we selected a series of FQs that are sensitive to different emission wavelengths and conjugated them onto the copolymer. The UPS nanoprobes were produced by mixing the FQ-conjugated polymer with dye-conjugated polymer in the same micelle core. At the micelle state, FQs quench the fluorophore signals, and upon micelle dissociation, separation of FQs and fluorophores will result in a significant increase in fluorescence emissions (Figure 1a).
To evaluate the effectiveness of the FQ strategy, we used PEO-b-poly[2-(propylamino)ethyl methacrylate] (PDPA) as a model system and conjugated different FQs and fluorophores to the copolymer (Supporting Information Figure S19). The PDPA nanoprobe had a pH transition at 6.2. First, we investigated the FQ strategy on fluorophores with large Stokes shift (e.g., AMCA, 353/442; MB, 362/462; PPO, 415/570; the two numbers refer to the excitation and emission wavelengths, respectively). Without introduction of FQ-conjugated polymer, the PDPA-AMCA and PDPA-MB nanoprobes showed only 3-fold fluorescence activation between the on and the off states at pH 5.0 and 7.4, respectively (Figure 5a). Introduction of PDPA-QSY35 to PDPA-AMCA or PDPA-MB resulted in a significant increase in fluorescence activation, which reached a plateau when the molar fraction of PDPA-QSY35 became 67% (Supporting Information Figure S20). At this composition, the RF values reached approximately 90-fold, which are 30 times higher than those without the FQs (Figure 5b, Supporting Information Figure S21). Similarly, introduction of PDPA-QSY7 (50 mol %) to PDPA–PPO nanoprobes increased the RF value from 6 to >130-fold, respectively (Figure 5b).
Figure 5.

Introduction of FQ-conjugated PDPA copolymer significantly increased the fluorescence activation ratio of different PDPA-dye nanoprobes. Fluorescence intensity ratio at different pH to pH 7.4 (FpH/F7.4) was plotted for copolymer alone (a, c, and e) and with addition of FQ-conjugated copolymers (b, d, f). See main text for detailed description and Supporting Information Figure S19 for the structures of the dyes and FQs.
For the BODIPY family of dyes, the PDPA-BDY493 and PDPA-TMR nanoprobes only yielded a ∼15-fold increase of fluorescence upon activation (Figure 5c), which is not adequate for biological applications (e.g., during cellular imaging, an RF value >30 is necessary to suppress the background signal). Introduction of PDPA-BHQ1 (50 mol %) and PDPA-QSY7 (50 mol %) to the PDPA-BDY493 and PDPA-BDYTMR nanoprobes led to dramatically increased RF values (both >100-fold, Figure 5d, Supporting Information Figure S22). Interestingly, PDPA-BDY630 alone was able to achieve a 40-fold RF value. Addition of PDPA-QSY21 further increased the RF value to over 250-fold (Figure 5d).
Previous studies showed that rhodamine and cyanine dyes with small Stokes shifts (<40 nm) were able to produce UPS nanoprobes with large RF values through the homoFRET-induced fluorescence decay mechanism.20 Results from this study confirmed the previous report, where PDPA-dye copolymers alone reached >50-fold and >100-fold for rhodamine and cyanine dyes, respectively. Addition of FQ-conjugated copolymer (except Cy7.5 for which there is no FQ) further increased the RF values for these nanoprobes (Figure 5f, Supporting Information Figures S23–25).
Figure 5e and 5f summarizes the fluorescence activation ratios (RF = F5.0/F7.4) for all fluorophores used in the PDPA nanoprobes with and without introduction of fluorescence quenchers. Data show that with addition of FQ-conjugated polymer all fluorophores (12 in total) showed universally high activation ratios (>50-fold) regardless of the Stokes shift or PeT mechanism. In addition, introduction of FQ-conjugated polymer did not affect the sharpness of pH transitions (all composite nanoprobes had <0.25 pH unit between on and off states, Figure 5b and 5d and Supporting Information Figure S25b and S25d).
Cell uptake studies of (PDPA-MB/PDPA-QSY35) and (PDPA-BDY493/PDPA-BHQ1) nanoprobes showed significantly increased cellular imaging contrast over the medium background. These nanoprobes remained silent in the cell culture medium. Upon uptake in the endosomes/lysosomes in the H2009 lung cancer cells, the nanoprobes were activated by the acidic organelle pH, leading to dramatically increased fluorescence intensity. The SNRcell/SNRMed ratios increased to 29- and 94-fold for (PDPA-MB/PDPA-QSY35) and (PDPA-BDY493/PDPA-BHQ1) nanoprobes, respectively, much higher than those without the fluorescence quenchers (Supporting Information Figures S17 and S18).
UPS Library Spanning a Large Range of pH Transitions and Fluorescence Emissions
On the basis of the above results, we produced a representative UPS library consisting of 10 nanoprobes each encoded with a different fluorophore. The composition for each nanoprobe follows that from Figure 4d (see Supporting Information Tables S3 and S4 for details), which resulted in a collection with 0.3 pH increments in the pH span of 4 to 7.4. For each nanoprobe, a series of aqueous solutions of the copolymer at the same polymer concentration (i.e., 0.1 mg/mL) but different pH values was prepared. For 4.4-AMCA, 4.7-MB, 5.0-BDY493, and 6.2-BDY630 nanoprobes, the corresponding copolymers were mixed with the same equivalent of FQ-conjugated matching copolymers to achieve high on/off contrast. Figure 6 shows the emission image of the UPS nanoprobe library at the excitation/emission wavelengths corresponding to each fluorophore. To evaluate the potential toxic effects of the UPS nanoprobes, we performed MTT assay in the H2009 lung cancer cells. H2009 cells were incubated with increasing concentrations (from 0.1 to 100 μg/mL) of different nanoprobes in the cell culture medium for 48 h at 37 °C (typical imaging dose is below 100 μg/mL). Results showed minimal toxicity (cell viability > 90%) for a majority of the nanoprobes (Supporting Information Figure S26). UPS7.1 and UPS6.8 showed slightly higher toxicity (80% viability) at 100 μg/mL. Current work is in progress to study the pH-dependent perturbation of lysosome catabolism and oncogenic signaling pathway and their impact on cell viability at higher doses (>400 μg/mL) of the UPS nanoparticles.
Figure 6.
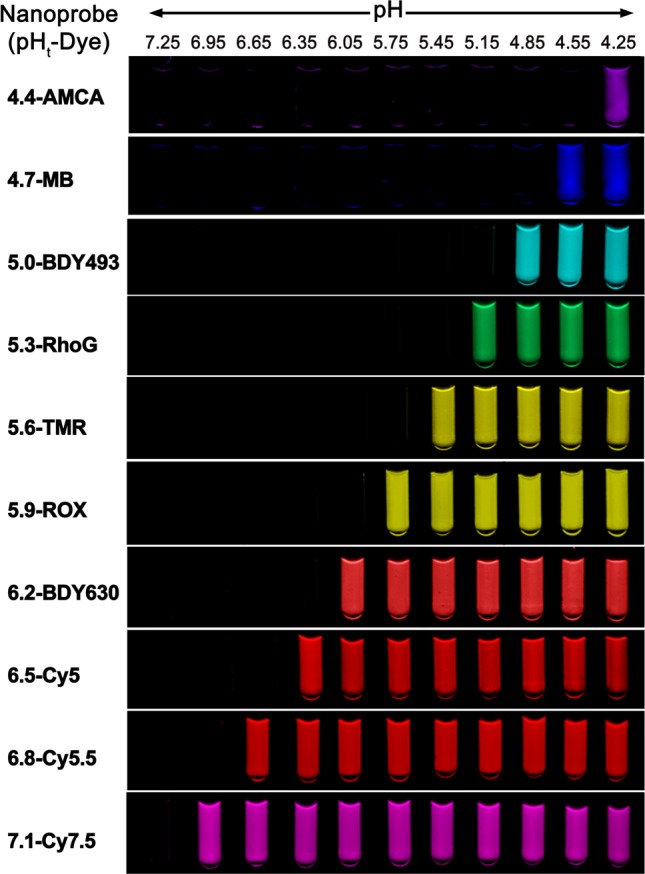
Exemplary UPS library consisting of 10 nanoprobes spanning a wide pH range (4–7.4) and large fluorescent emissions (400–820 nm). Each nanoprobe is encoded by its transition pH and fluorophore. Images of 4.4-AMCA and 4.7-MB were taken by a camera at an excitation light of 365 nm. Images of the rest of the nanoprobe solutions were taken on a Maestro Imaging system.
Results from Figure 6 illustrate the exquisite pH sensitivity of the UPS nanoprobes to the external environment spanning the entire physiologic pH of 4–7.4. In the lowest pH range, the 4.4-AMCA nanoprobe was off at pH 4.55 but can be turned on at pH 4.25. This nanoprobe can be useful in detection of functional lysosomal pH where hydrolases require a lower pH for enzyme activity. The on/off characteristics of the nanoprobes make them particularly useful in high-throughput screening applications to identify molecular pathways or small molecular perturbators that affect lysosomal function. The nanoprobes covering the higher pH range (e.g., 6.5–7.1) can be useful for differentiation of the acidic pHe of tumors with different glycolysis rates of the cancer cells.22,36 The nanoprobes in the intermediate range (e.g., 5.0–6.5) may be useful for study of the maturation of endosomes/lysosomes and to establish organelle-specific compositions for subcellular imaging or drug delivery applications.
Conclusions
We report a robust method for development of ultra-pH-sensitive (UPS) micellar nanoprobes with significantly improved pH control and broadened fluorophore selection over the previous methods.19,20 Through a copolymerization strategy for synthesis of the ionizable block, we demonstrate the ability to achieve an operator-predetermined control of the transition pH of the UPS nanoprobes based on standard curves. Importantly, matching of the hydrophobicity of the two monomers is critical to ensure the sharpness of pH transition (i.e., <0.25 pH between the on and the off states). Introduction of fluorescence quenchers in the core of the UPS nanoprobes further broadens the fluorophore choice to those with large Stokes shifts. On the basis of these findings, we established a UPS nanoprobe library consisting of 10 components with 0.3 pH increment that span the entire physiologic range of pH (4–7.4). Each nanoprobe maintained exquisite sensitivity to the environmental pH. The availability of the UPS library opens up many exciting opportunities for basic biological research (e.g., endosome/lysosome biology) as well as for translational studies in tumor imaging and drug delivery.
Acknowledgments
This research was supported by the National Institutes of Health (RO1 EB013149) and Cancer Prevention and Research Institute of Texas (RP 120094). We also acknowledge the small animal imaging facility supported by the Cancer Center Support Grant (P30 CA 142543). We thank Dr. Nicolay Tsarevsky and Hongzhang Han for their assistance on the TGA analysis of the copolymers.
Supporting Information Available
Materials, methods, detailed experimental procedures (synthesis, characterization, and biological assays), and supplementary figures. This material is available free of charge via the Internet at http://pubs.acs.org.
Author Contributions
‡ These authors contributed equally to this work.
The authors declare no competing financial interest.
Funding Statement
National Institutes of Health, United States
Supplementary Material
References
- Stuart M. A.; Huck W. T.; Genzer J.; Muller M.; Ober C.; Stamm M.; Sukhorukov G. B.; Szleifer I.; Tsukruk V. V.; Urban M.; Winnik F.; Zauscher S.; Luzinov I.; Minko S. Nat. Mater. 2010, 9, 101. [DOI] [PubMed] [Google Scholar]
- Ganta S.; Devalapally H.; Shahiwala A.; Amiji M. J. Controlled Release 2008, 126, 187. [DOI] [PubMed] [Google Scholar]
- Bellomo E. G.; Wyrsta M. D.; Pakstis L.; Pochan D. J.; Deming T. J. Nat. Mater. 2004, 3, 244. [DOI] [PubMed] [Google Scholar]
- So M. K.; Xu C.; Loening A. M.; Gambhir S. S.; Rao J. Nat. Biotechnol. 2006, 24, 339. [DOI] [PubMed] [Google Scholar]
- von Maltzahn G.; Park J. H.; Lin K. Y.; Singh N.; Schwoppe C.; Mesters R.; Berdel W. E.; Ruoslahti E.; Sailor M. J.; Bhatia S. N. Nat. Mater. 2011, 10, 545. [DOI] [PMC free article] [PubMed] [Google Scholar]
- Whitesides G. M.; Mathias J. P.; Seto C. T. Science 1991, 254, 1312. [DOI] [PubMed] [Google Scholar]
- Whitesides G. M.; Grzybowski B. Science 2002, 295, 2418. [DOI] [PubMed] [Google Scholar]
- Klouda L.; Mikos A. G. Eur. J. Pharm. Biopharm. 2008, 68, 34. [DOI] [PMC free article] [PubMed] [Google Scholar]
- Meyer D. E.; Chilkoti A. Nat. Biotechnol. 1999, 17, 1112. [DOI] [PubMed] [Google Scholar]
- Li P.; Banjade S.; Cheng H. C.; Kim S.; Chen B.; Guo L.; Llaguno M.; Hollingsworth J. V.; King D. S.; Banani S. F.; Russo P. S.; Jiang Q. X.; Nixon B. T.; Rosen M. K. Nature 2012, 483, 336. [DOI] [PMC free article] [PubMed] [Google Scholar]
- Casey J. R.; Grinstein S.; Orlowski J. Nat. Rev. Mol. Cell Biol. 2010, 11, 50. [DOI] [PubMed] [Google Scholar]
- Maxfield F. R.; McGraw T. E. Nat. Rev. Mol. Cell Biol. 2004, 5, 121. [DOI] [PubMed] [Google Scholar]
- Izumi H.; Torigoe T.; Ishiguchi H.; Uramoto H.; Yoshida Y.; Tanabe M.; Ise T.; Murakami T.; Yoshida T.; Nomoto M.; Kohno K. Cancer Treat. Rev. 2003, 29, 541. [DOI] [PubMed] [Google Scholar]
- Nishi T.; Forgac M. Nat. Rev. Mol. Cell Biol. 2002, 3, 94. [DOI] [PubMed] [Google Scholar]
- Lee J. H.; Yu W. H.; Kumar A.; Lee S.; Mohan P. S.; Peterhoff C. M.; Wolfe D. M.; Martinez-Vicente M.; Massey A. C.; Sovak G.; Uchiyama Y.; Westaway D.; Cuervo A. M.; Nixon R. A. Cell 2010, 141, 1146. [DOI] [PMC free article] [PubMed] [Google Scholar]
- Majumdar A.; Cruz D.; Asamoah N.; Buxbaum A.; Sohar I.; Lobel P.; Maxfield F. R. Mol. Biol. Cell 2007, 18, 1490. [DOI] [PMC free article] [PubMed] [Google Scholar]
- Webb B. A.; Chimenti M.; Jacobson M. P.; Barber D. L. Nat. Rev. Cancer 2011, 11, 671. [DOI] [PubMed] [Google Scholar]
- Zhang X.; Lin Y.; Gillies R. J. J. Nucl. Med. 2010, 51, 1167. [DOI] [PMC free article] [PubMed] [Google Scholar]
- Zhou K.; Wang Y.; Huang X.; Luby-Phelps K.; Sumer B. D.; Gao J. Angew. Chem., Int. Ed. Engl. 2011, 50, 6109. [DOI] [PMC free article] [PubMed] [Google Scholar]
- Zhou K.; Liu H.; Zhang S.; Huang X.; Wang Y.; Huang G.; Sumer B. D.; Gao J. J. Am. Chem. Soc. 2012, 134, 7803. [DOI] [PMC free article] [PubMed] [Google Scholar]
- Huang X.; Huang G.; Zhang S.; Sagiyama K.; Togao O.; Ma X.; Wang Y.; Li Y.; Soesbe T. C.; Sumer B. D.; Takahashi M.; Sherry A. D.; Gao J. Angew. Chem., Int. Ed. Engl. 2013, 52, 8074. [DOI] [PMC free article] [PubMed] [Google Scholar]
- Wang Y.; Zhou K.; Huang G.; Hensley C.; Huang X.; Ma X.; Zhao T.; Sumer B. D.; DeBerardinis R. J.; Gao J. Nat. Mater. 2014, 13, 204. [DOI] [PMC free article] [PubMed] [Google Scholar]
- Atkins P.; De Paula J.. Physical Chemistry; Oxford University Press: U.K., 2009. [Google Scholar]
- Yu H.; Zou Y.; Wang Y.; Huang X.; Huang G.; Sumer B. D.; Boothman D. A.; Gao J. ACS Nano 2011, 5, 9246. [DOI] [PMC free article] [PubMed] [Google Scholar]
- Tsarevsky N. V.; Matyjaszewski K. Chem. Rev. 2007, 107, 2270. [DOI] [PubMed] [Google Scholar]
- Ma Y.; Tang Y.; Billingham N. C.; Armes S. P.; Lewis A. L.; Lloyd A. W.; Salvage J. P. Macromolecules 2003, 36, 3475. [Google Scholar]
- Zhang K.; Fang H.; Wang Z.; Li Z.; Taylor J. S.; Wooley K. L. Biomaterials 2010, 31, 1805. [DOI] [PMC free article] [PubMed] [Google Scholar]
- Urano Y.; Asanuma D.; Hama Y.; Koyama Y.; Barrett T.; Kamiya M.; Nagano T.; Watanabe T.; Hasegawa A.; Choyke P. L.; Kobayashi H. Nat. Med. 2009, 15, 104. [DOI] [PMC free article] [PubMed] [Google Scholar]
- Petsalakis I. D.; Lathiotakis N. N.; Theodorakopoulos G. J. Mol. Struct.: THEOCHEM 2008, 867, 64. [Google Scholar]
- Tal S.; Salman H.; Abraham Y.; Botoshansky M.; Eichen Y. Chem.—Eur. J. 2006, 12, 4858. [DOI] [PubMed] [Google Scholar]
- Dale T. J.; Rebek J. J. Am. Chem. Soc. 2006, 128, 4500. [DOI] [PubMed] [Google Scholar]
- Blum G.; Mullins S. R.; Keren K.; Fonovic M.; Jedeszko C.; Rice M. J.; Sloane B. F.; Bogyo M. Nat. Chem. Biol. 2005, 1, 203. [DOI] [PubMed] [Google Scholar]
- Lee S.; Ryu J. H.; Park K.; Lee A.; Lee S. Y.; Youn I. C.; Ahn C. H.; Yoon S. M.; Myung S. J.; Moon D. H.; Chen X.; Choi K.; Kwon I. C.; Kim K. Nano Lett. 2009, 9, 4412. [DOI] [PMC free article] [PubMed] [Google Scholar]
- Levi J.; Kothapalli S. R.; Ma T. J.; Hartman K.; Khuri-Yakub B. T.; Gambhir S. S. J. Am. Chem. Soc. 2010, 132, 11264. [DOI] [PMC free article] [PubMed] [Google Scholar]
- Maxwell D.; Chang Q.; Zhang X.; Barnett E. M.; Piwnica-Worms D. Bioconjugate Chem. 2009, 20, 702. [DOI] [PMC free article] [PubMed] [Google Scholar]
- Ko J. Y.; Park S.; Lee H.; Koo H.; Kim M. S.; Choi K.; Kwon I. C.; Jeong S. Y.; Kim K.; Lee D. S. Small 2010, 6, 2539. [DOI] [PubMed] [Google Scholar]
Associated Data
This section collects any data citations, data availability statements, or supplementary materials included in this article.