Abstract
Retinal image quality from flood illumination adaptive optics (AO) ophthalmoscopes is adversely affected by out-of-focus light scatter due to the lack of confocality. This effect is more pronounced in small eyes, such as that of rodents, because the requisite high optical power confers a large dioptric thickness to the retina. A recently-developed structured illumination microscopy (SIM) technique called HiLo imaging has been shown to reduce the effect of out-of-focus light scatter in flood illumination microscopes and produce pseudo-confocal images with significantly improved image quality. In this work, we adopted the HiLo technique to a flood AO ophthalmoscope and performed AO imaging in both (physical) model and live rat eyes. The improvement in image quality from HiLo imaging is shown both qualitatively and quantitatively by using spatial spectral analysis.
OCIS codes: (010.1080) Active or adaptive optics, (170.3880) Medical and biological imaging, (170.4460) Ophthalmic optics and devices, (330.4875) Optics of physiological systems
1. Introduction
Rodents are used extensively in the study of eye disease due to their low cost, rapid development and the availability of targeted genetic manipulation [1–9]. Traditional methods for the acquisition of data with cellular resolution require sacrifice of the animal, with multiple animals at different time points being required for longitudinal studies to ensure statistical power. However with the advent of non-invasive adaptive optics (AO) retinal imaging it is possible to study microscopic retinal structures in the same animal over time. Obtaining high quality AO images in rodent eyes is challenging due to their high optical power leading to a dioptrically thick retina compared to human eyes [10]. Image quality may be substantially improved in rodent eyes using adaptive optics scanning laser ophthalmoscopy (AOSLO) [11–13]. By virtue of the confocality of AOSLO, light scattered from planes other than the plane of interest is rejected, making it possible to perform axial sectioning and return higher contrast retinal images [14]. Adaptive optics optical coherence tomography (AO-OCT) also produces images with higher axial resolution that are far less affected by scatter [15, 16], and has recently been used for rodent eye imaging [17].
In comparison to the above approaches, flood-illumination AO ophthalmoscopes currently lack the ability to physically reject out-of-focus light and so are more affected by deleterious intra-ocular scatter. One important advantage of flood-illumination methods is that areal imaging frame rates can be an order of magnitude faster compared to scanning modalities (e.g. the AOSLO typically ranges from 30 to 60 Hz [18, 19]), owing to the development of sCMOS technology that can acquire en-face images at up to 1000 Hz or more depending on the field-of-view required [20–22]. This gives flood AO much promise in the study of the dynamics of microscopic structures in the living rodent eye.
In an effort to overcome the effects of light scattered from out-of-focus layers in wide-field (flood-based) fluorescence microscopy, an imaging technique dubbed “HiLo” microscopy has recently been developed. The details of HiLo microscopy have been described elsewhere [23–25] and an open source ImageJ [26] implementation of the algorithm is available online [27], which was first mentioned in Ford et al. (2012) [28]. In brief, two images of the same region of interest (ROI) are acquired either in parallel or in rapid succession, one with uniform illumination (Iu) which mainly contributes high-frequency information to the final image (hence the “Hi” in HiLo), the other with structured illumination (Is) (e.g. random laser speckle) which mainly contributes low-frequency information to the final image (hence the “Lo” in HiLo). These images are then post-processed to obtain a HiLo image, as described in the Methods.
In this work, we adapted the HiLo technique to a flood AO ophthalmoscope specifically constructed for rodent eyes. We first show HiLo AO images in two model eyes, followed by analysis of AO images acquired from rat eyes. Although comparisons with published data show that image quality from scanning systems is still superior, the pseudo-confocality of HiLo imaging nonetheless significantly improved image quality in our flood AO system. Spatial spectral analysis is used to quantify improvement in image quality.
2. Methods
2.1. Flood illumination adaptive optics ophthalmoscope
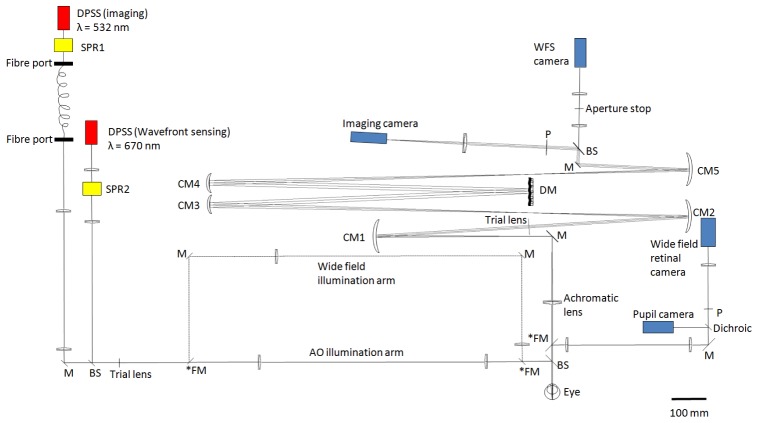
The principle of flood based AO ophthalmoscopy has been described in detail elsewhere [29]. Our system was designed and optimized using the optical design software ZEMAX (Zemax Development Corporation). In order to reduce light loss due to back reflection from lenses and reduce system astigmatism in the pupil and retinal planes, we adopted a non-planar design using mainly spherical mirrors in an off-axis arrangement [30]. Figure 1 shows the scaled layout of the system, flattened for visualization. An achromatic lens with anti-reflection coating was inserted immediately in front of the eye to increase system field-of-view and reduce chromatic aberration, a similar design to the mouse system described by Geng et al. (2012) [11].
Fig. 1.
Scaled (1:1) schematic layout of our non-planar design flood-illumination AO ophthalmoscope, flattened for visualization. All angles and distances are to scale. Representations of optical components are for illustrative purposes only. Two illumination arms are built in: the “wide-field illumination arm” and the “AO illumination arm”. The two arms can be switched by using the three flip mirrors marked with an asterisk (*FM). DPSS: diode-pumped solid-state laser. SPR: spatial phase randomizer. M: flat mirrors. BS: plate beam splitter. FM: flip mirrors. CM: curved mirrors. P: pupil planes conjugate to the wavefront sensor and deformable mirror. DM: Mirao 52d deformable mirror. WFS: wavefront sensor. Note that SPR1 (coupled to imaging light) was switched on and off for HiLo imaging (see description below), and SPR2 (coupled to wavefront sensing light) was left on throughout the experiment. Scale bar: 100 mm.
The wavefront sensing and imaging light sources are diode-pumped solid-state (DPSS) lasers (Altechna, Vilnius, Lithuania) with nominal centre wavelengths of 670 and 532 nm, respectively. We used 532 nm light since this is strongly absorbed by haemoglobin and so gives good contrast when imaging blood vessels [31] (Ideally the same wavelength should be used for sensing and imaging, as our previous modeling work predicted that image quality can be improved further [10]. Unfortunately, another 532 nm laser was not available for wavefront sensing at the time of the experiment, a separate source being required so that they can be modulated in counter-phase to avoid imaging light being coupled into the wavefront sensor and vice versa). The deformable mirror is a Mirao-52d (Imagine Eyes, Orsay, France) with 52 actuators and 15 mm diameter, corresponding to 3.75 mm in the pupil plane, which is approximately the maximally dilated pupil size for a rat. Wavefront sensing is achieved using a Shack-Hartmann with lenslets of 0.4 mm pitch and 24 mm focal length (Adaptive Optics Associates, Cambridge, MA), attached to a charge-coupled device (CCD) camera (Pike, Allied Vision Technologies, Stadtroda, Germany). The magnification of the eye’s pupil at the wavefront sensor is x2 and ~293 lenslets are used for wavefront sensing over a 3.75 mm pupil. In order to align the eye, a wide-field retinal and a pupil camera (A102f, Basler AG, Ahrensburg, Germany) were added to the system. Flip mirrors were used to allow switching between the wide-field and AO illumination arms.
Wavefront sensing in rodent eyes is challenging, as Geng et al. (2011) showed that large dioptric thickness of the mouse retina causes doubling of the WFS spots towards the pupil edge when a small diameter sensing beam is used [32]. To alleviate this problem and avoid back reflection from the cornea, we adopted their solution of using a large diameter annular sensing beam in order to reduce its depth of focus, with an outer and inner diameter of 4 mm and 1 mm respectively at the eye’s pupil [32]. The focus of the beacon was optimized subjectively prior to AO imaging, by inserting trial lenses in the light delivery path while observing the sharpness of the spots on the WFS camera.
Adaptive optics correction is controlled by custom-built software in Matlab (Mathworks, Natick, MA) which operates at 20 Hz prior to and during imaging. Imaging light is manually triggered at 15 Hz (actual exposure time = 3 ms to minimize blur due to eye and whole-animal movement) when the root-mean-square (RMS) wavefront error is sufficiently low (usually 0.02-0.03 µm for the model eye, and 0.06-0.10 µm for the rat eye, measured over a 3.75 mm pupil using normalized Zernike coefficients), and frames conjugate to the retinal image are collected by a CCD camera (Megaplus 4020C, Princeton Instruments, Trenton, NJ). Each pixel on the camera corresponds to ~0.2 µm in the rat eye, assuming an equivalent focal length for the eye of 3.3 mm [33].
Since DPSS lasers are moderately coherent, measures are usually taken to reduce the resultant speckle when these are used for imaging. In our experiment we used spatial phase randomisers (SPRs) (Md Lasers & Instruments, Inc, Pleasanton, CA) to modulate the time-average coherence, and hence speckle, in our images. The SPR consists of a diffuser plate which is rotated rapidly by a small motor at selectable speeds. The instantaneous spatial phase of the laser light is integrated across the relatively long exposure time of the CCD camera used (3 ms), producing a speckle-free image. In our system, an SPR (SPR2 in Fig. 1) was positioned in the wavefront sensing light path and was always left on. Another SPR (SPR1 in Fig. 1) was positioned in front of the imaging light and was modulated as needed to produce either a “Uniform” image (SPR on) or a “Speckle” image (SPR off). These images were then post-processed to generate the final HiLo image as described below.
The imaging light is additionally passed through 2 meters of multimode optical fibre (BFL37-200, 0.37 NA, 200 µm core, Thorlabs, Newton, NJ), and the fibre tip is then nominally imaged onto the retina. The beam diameter at the pupil is ~4 mm.
2.2. HiLo imaging
The HiLo algorithm requires that the Uniform and Speckle images be exactly registered before being processed. Therefore movement artifacts in the raw images can be a potential problem. In our case, even though animals were anaesthetized, because the Uniform and Speckle images were obtained in sequence they potentially suffered from lateral eye movement artifact. To overcome this, the images were registered and the area of common illumination extracted using custom Matlab code. The registered images were then used to obtain the HiLo images. Thus an area of common illumination was extracted from the raw images, so that the region available for HiLo processing was reduced in size (see Results).
Once the two raw images had been registered, they were processed using the HiLo implementation for ImageJ [26] as mentioned above. We verified its operation by confirming that the raw images published in Lim et al. (2011) produce an output indistinguishable from that shown in their paper. In order to maximise the signal-to-noise ratio, multiple frames of both raw images were used to generate the HiLo sequence, which was then averaged to produce a HiLo image.
The principle behind the HiLo software to selectively filter out-of-focus scattered light has been fully explained elsewhere [24]. Briefly, the final HiLo image is composed of differing spatial frequency contributions from the Uniform (Iu) and Speckle images (Is). In particular, since image features with high spatial frequency are inherently in-focus, they can be readily extracted by using a high-pass filter HP on Iu, resulting in an intermediate image that contains the high spatial frequency features of the focal plane, described by Eq. (1):
| (1) |
On the other hand, the extraction of in-focus low spatial frequency features is more complicated. This involves evaluating the local contrast Cδ from the difference image Iδ = W(Is - Iu), where W is a user-defined filter that can be adjusted to tune the sectioning strength of the final HiLo image. Cδ may be interpreted as a weighting function that peaks when the object is in-focus and decays to zero when it is out-of-focus. A multiplication of this local contrast with Iu, and a low-pass filter LP complementary to HP produces an intermediate image that contains in-focus low spatial frequency features, described by Eq. (2):
| (2) |
Lastly, the high (“Hi”) and low-resolution (“Lo”) images are combined to produce a full resolution (or “HiLo”) image that is axially sectioned around the best-focus plane, described by Eq. (3)
| (3) |
where η is a scaling function that can be inferred experimentally or estimated based on the illumination and detection point spread functions to ensure smooth fusion of Ihp and Ilp.
It should also be noted that the choice of HP and LP depends on the user-defined filter W [24], which can be altered by changing the “Depth of field multiplier” (DOF) in the software. This parameter can be adjusted to alter the axial resolution of the final HiLo image. Changing the DOF value affects the axial sectioning of the low-resolution (Lo) image only, since contrast generated by random speckle provides information on how in-focus the imaged feature is [24]. This approach to section an image is reliable since the statistical nature of speckle makes it insensitive to light scatter and aberration in the illumination path [24].
2.3. Model eye imaging
In order to test the HiLo technique in a more controlled environment, we first obtained raw images from two model eyes, which had equivalent powers of 60 D and 220 D. Each model eye was constructed in a cage-mounting system using an aspherical plano-convex lens with an artificial retina placed at its back focal plane. An artificial pupil was inserted just anterior to the lens. The artificial retina for the 60 D model eye was a small piece of photocopier/printer paper with printed ink patterns; while the retina for the 220 D model eye was a small semi-transparent piece of lint-free lens cleaning tissue (MC-5 Lens Tissues, Thorlabs, Newton, NJ) ~45 µm thick.
For the 60 D model eye, the artificial retina contained information in what is effectively a single plane. In order to test the ability of the HiLo technique to reject out-of-focus scatter, intraocular scatter was introduced by inserting a “scattering medium” - constructed from a piece of slightly diffuse plastic cut from a CD case - between the retina and the lens. After the Uniform and Speckle images were acquired, the scattering medium was physically removed to obtain a “target” image with uniform illumination, in which the best possible image quality (called the “Ideal” image below) was defined for comparison to the HiLo image.
On the other hand, the artificial retina for the 220 D model eye contained information across a ~2.0 D range from anterior to posterior. Individual fibre strands were visible due to the loose structure of the tissue. No introduced scattering medium was required in this case since light from the out-of-focus fibre strands served as unwanted sources of defocussed scattered light in our images.
2.4. Rat eye imaging
Normal adult Long Evans rats (n = 2) from 2 to 6 months of age were imaged and allowed to recover afterwards. All animal handling was performed according to the ARVO statement for the Use of Animals in Ophthalmic and Vision Research. Ethics approval was obtained from the University of Melbourne Animal Ethics Committee.
Rats were placed under general anaesthesia via intramuscular injection of ketamine (60 mg/kg) and xylazine (5 mg/kg) and placed on a custom-made small animal stage for imaging. Topical eye drops of a local anaesthetic (0.5% proxymetacaine hydrochloride, Alcaine, 5 mg/mL; Alcon Laboratories, Frenchs Forest, New South Wales, Australia) and a mydriatic (0.5% tropicamide, Mydriacyl, 5mg/mL; Alcon Laboratories) were instilled in both eyes to eliminate the corneal reflex and dilate the pupils. Custom-made rigid contact lenses (Contact Lens Australia, Clayton, Australia) with base curves of 3.0-3.2 mm and powers of ~ + 10 D were carefully placed on the eye being imaged to provide a clear optical surface and to reduce refractive error, decreasing the demands for low-order AO correction by the DM. The range of appropriate contact lens power was determined by retinoscopy and wavefront sensing, and agrees with the range given by Geng et al. (2009) of 0 to + 20 D [12]. The fellow eye was lubricated with an ophthalmic eye gel to prevent desiccation of the cornea.
The animal was initially positioned and aligned using the pupil camera. Once the desired retinal location was identified, multiple AO images were obtained as described for the model eyes. The intensities of the sensing and imaging beam were 360 µW and 12.5 µW, respectively. The imaging light pulse was driven by the Megaplus camera with single pulse durations of 3 ms at 15 Hz. At these levels and pulse frequency, the intensities were within the maximum permissible exposure (MPE) for 60 seconds of repetitive pulse exposure [34].
3. Results from HiLo imaging
3.1. Result from human eye imaging
In order to verify the ability of our AO system to perform high resolution in vivo imaging, we obtained AO images from a dilated human eye using a 670 nm imaging light. Figure 2 shows an AO image of the human fovea about 2° superior from fixation, averaged over 30 frames and linearly stretched to fill the colormap for visualization. Despite the limited effective pupil size of 3.75 mm in the pupil plane, retinal cones are clearly visible at this location. RMS wavefront error was ~0.04 µm for the human eye, indicating diffraction-limited imaging.
Fig. 2.
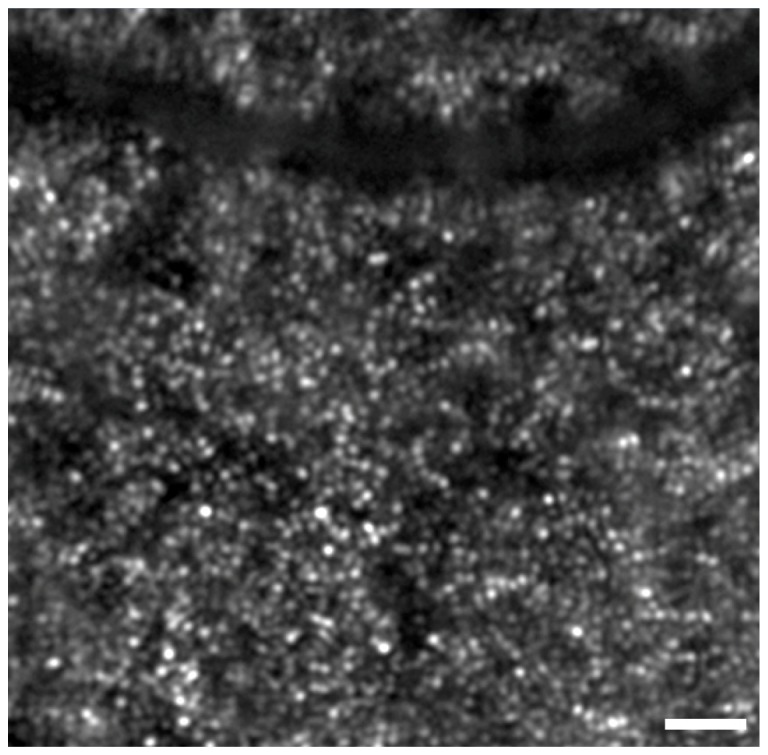
In vivo image of a human eye using our rat AO system. Image is located approximately 2° superior from fixation, averaged over 30 frames and linearly stretched to fill the colormap for display purposes. Cones are clearly visible at the centre of the image. The fovea is towards the bottom. Scale bar = 30 µm.
3.2. Result from 60 D model eye
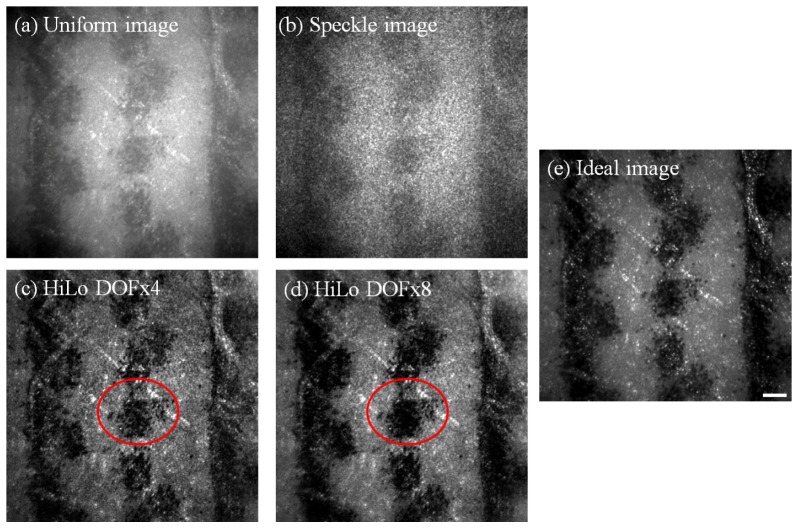
Figure 3 shows sample AO images from the 60 D model eye, all of which were averaged over 50 frames and linearly stretched to fill the colormap for visualization. As described in Methods, the Uniform and Speckle images were obtained with a scattering medium in front of the model retina, whereas the Ideal image was obtained with the scattering medium physically removed. All images were diffraction-limited, indicating best possible image quality for this pupil size (RMS wavefront error ~0.02-0.03 μm over a 3.75 mm pupil).
Fig. 3.
Example of AO images obtained using the 60 D model eye with an artificial “retina” made from a white piece of paper printed with ink spots, together with an intraocular scatterer. All images shown are the average of 50 frames and linearly stretched to fill the colormap for display purposes. Uniform (a) and Speckle (b) images were obtained with the scatterer in place and with uniform and speckle illumination, respectively. HiLo images were generated using two different values for the depth-of-field (DOF), with DOFx4 in (c) and DOFx8 in (d), with the circled areas showing greater enhancement of higher frequency details for the DOFx4 HiLo image in (c), and greater enhancement of lower frequency details for the DOFx8 HiLo image in (d) (see Fig. 4 for Fourier analysis). The Ideal image (e), which was obtained without the scatterer, is also shown for comparison. Scale bar = 50 µm.
When comparing Uniform and HiLo images visually, HiLo images showed higher contrast and better resolution that more closely approaches the Ideal image. In addition, since HiLo images were obtained from post hoc analysis, it was possible to vary the DOF multiplier to control empirically the degree to which out-of-plane light is rejected, i.e. the thickness of the axial sectioning [24]. Different DOF values were used for processing the HiLo images, and images from two of the DOF values (x4 and x8) are shown in Fig. 3(c) and 3(d). The circled areas show that, in this example, DOFx4 gave better resolution and contrast for high spatial frequency details, while DOFx8 gave better resolution and contrast for lower spatial frequency details. Both HiLo images showed enhanced contrast for higher spatial frequencies compared to the Uniform image.
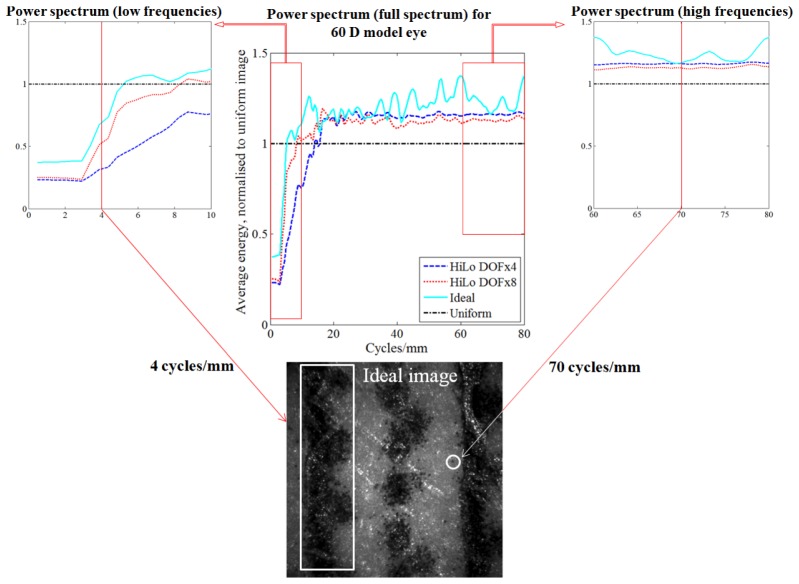
Figure 4 shows the relationship between the power spectra of the HiLo DOFx4, x8, Ideal, and Uniform images. A two-dimensional fast Fourier transform (FFT) was performed on each image, and the radially averaged energy of the power spectrum obtained. Due to the difference in mean intensity between the images, each FFT power spectrum was normalized to unit volume. The resultant FFT power spectra of all images were then divided by that of the Uniform image to generate the ratio data shown.
Fig. 4.
Analysis showing improvement to the retinal image power spectrum following HiLo (with scatterer), compared to that obtained after physical removal of the scatterer (Ideal image) for the 60 D model eye. TOP CENTRE: Ratio plot of the normalized radial average energy of the FFT power spectrum of the images shown in Fig. 3. All results are normalized by the Uniform image power spectrum, represented by a horizontal dash-dot line at ratio = 1.0. The horizontal axis represents spatial frequency in units of cycles/mm. INSET TOP LEFT: Magnified view at lower spatial frequencies. Low frequency information occupies a lower fraction of the energy spectrum after HiLo, due to removal of veiling glare introduced by the scatterer. Performance approaches that of the ideal image. An example low frequency retinal feature (~4 cycles/mm) is highlighted in the Ideal image at BOTTOM. INSET TOP RIGHT: Magnified view of the higher spatial frequencies. High frequency information occupies a greater fraction of the energy spectrum after HiLo, due to removal of the low frequency veiling glare. An example high frequency retinal feature (~70 cycles/mm) is highlighted at BOTTOM.
It is apparent from Fig. 4 that the lower spatial frequency information of the HiLo and Ideal images contribute less to the total image energy than in the Uniform image, which is a result of the low frequency “veiling glare” introduced by the scatterer. This glare is mostly compensated for by the HiLo approach, and physically removed under the “Ideal” comparison. Compensation/removal of this low-frequency glare means that the relative energy fraction occupied by the higher frequencies becomes increased (rightmost plot), in this case by ~20% and 30% for the HiLo and Ideal images respectively. This indicates the relatively improved modulation of high spatial frequency information afforded by the HiLo approach. The similarity of the power spectra between DOFx8 and the Ideal image at lower frequencies, and between DOFx4 and the Ideal image at higher frequencies, show the use of selecting different DOF values to enhance desired features in the HiLo image.
This approach is useful to quantify the improvement of HiLo images compared to the Uniform image and is also used to analyse subsequent results from rat eyes.
3.3. Result from 220 D model eye
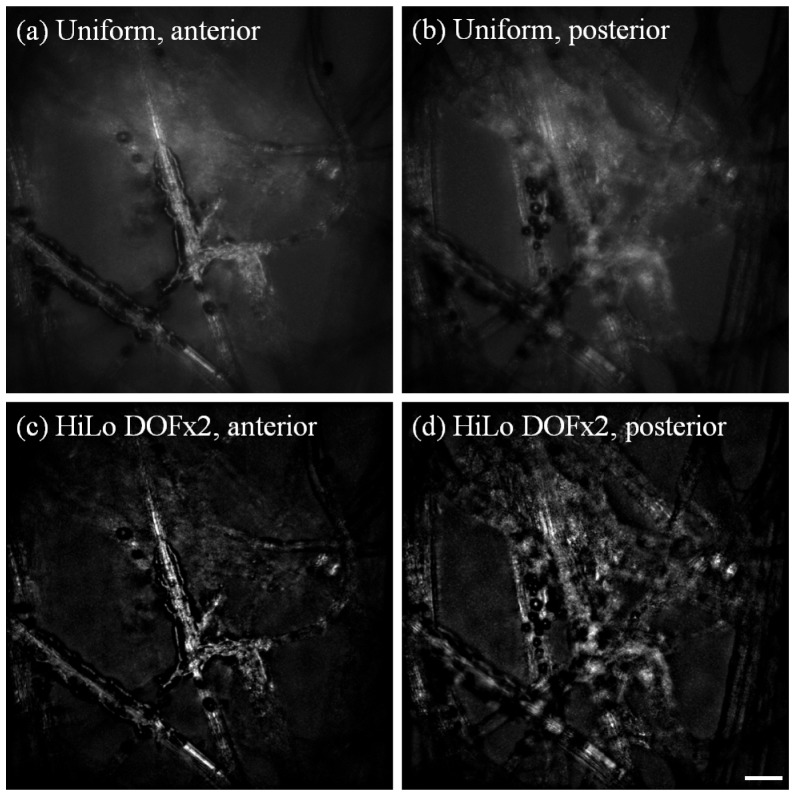
Figure 5 further demonstrates the optical sectioning capabilities of HiLo, on a more highly powered model eye (220 D). The lens cleaning tissue has an optical thickness of ~2 D (cf. rodent retina with optical thickness ranging from 10 - 50 D [10, 35]). Through-focus image sequences from the anterior to posterior layer of the sheet were obtained with both uniform and speckle illumination. It should be noted that no scattering medium was used in this set of images, instead light was scattered (although to a lesser extent compared to the 60 D model eye with scatterer) from out-of-focus layers. DOFx2 was chosen empirically, as it was judged to return the best HiLo image quality in this case. AO images were averaged over 50 frames and colormaps were linearly stretched for display purposes. In all cases, the RMS wavefront error of the images was from 0.02 to 0.03 µm, indicating diffraction-limited imaging.
Fig. 5.
Uniform and HiLo images obtained from the 220 D model eye, using a 45 µm thick lens cleaning tissue as the artificial retina. All images shown are the average of 50 frames and stretched to fill the colormap for display purposes. (a) and (c): Uniform and HiLo images for the most anterior surface of the cleaning tissue. It can be seen that light scatter from posterior layers is reduced greatly in the HiLo image. (b) and (d): Uniform and HiLo images for the most posterior surface. Scale bar = 20 µm.
Images (a) and (c) show the anterior layer before and after HiLo; the dark material adhering to the fibres are laser toner particles. It can be seen that in the HiLo image, the in-focus features appear more distinct while the background scatter appears to be greatly reduced. Similarly when the focus is shifted to the posterior layer in (b) and (d), scatter from the anterior layers is also reduced in the HiLo image. The spatial power spectra analysis (not shown) returned similar results to the 60 D eye.
3.4. Result from rat eyes
An example of our optimized [32] WFS spots from the rat eye prior to AO correction is shown in Fig. 6. It can be seen that the central spots are well focussed, and becoming gradually blurry towards the periphery. The RMS wavefront error obtained from wavefront data simultaneously collected with the fundus images shown below was from 0.06 to 0.10 µm, indicating that diffraction-limited imaging was not achieved (λ = 532 nm). This occurred possibly due to a combination of poor Shack-Hartmann spot quality towards the pupil periphery in the rat, and the presence of breathing artefacts under general anesthesia, especially when the beacon falls on the edge of a large blood vessel.
Fig. 6.
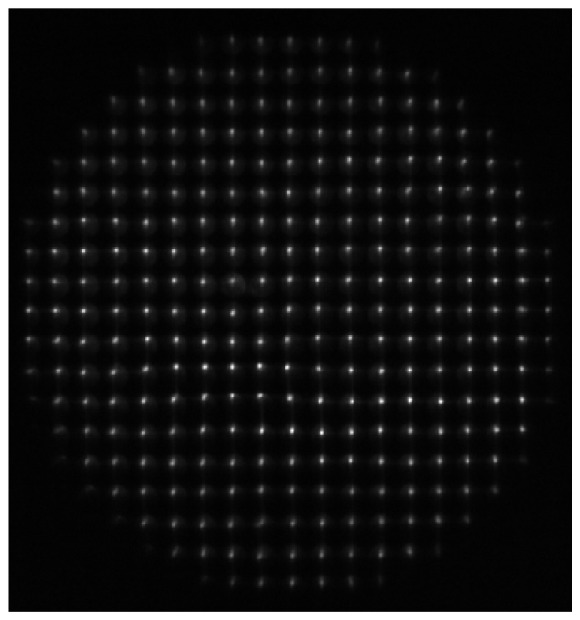
An example of the Shack-Hartmann WFS spot quality from the rat eye prior to AO correction after optimization and, following adoption of the system modifications suggested by Geng et al. (2011) [32] summarized in the text. The spots appear well focussed at the centre, but become gradually blurry towards the periphery. The RMS wavefront error from the rat eye following adaptive optics correction ranged from 0.06 to 0.10 µm, measured over a 3.75 mm pupil.
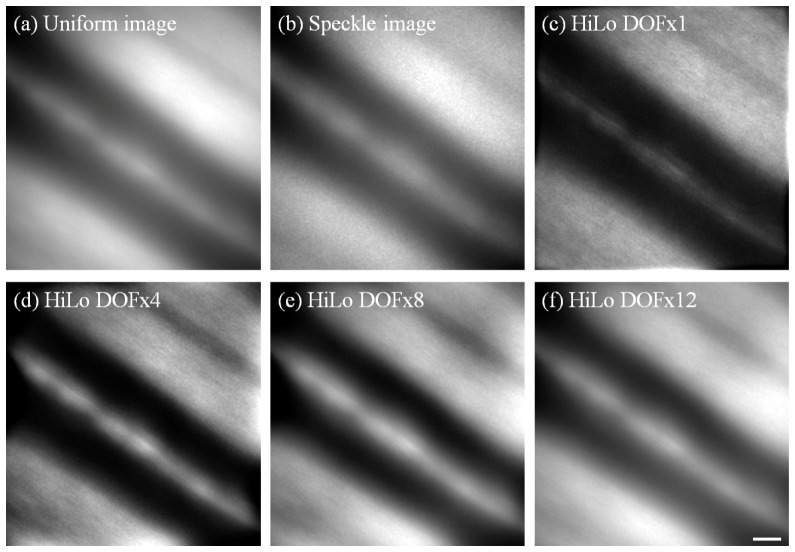
Figure 7 shows the improvement in image contrast following application of HiLo imaging to in vivo AO images from the retina of a Long Evans rat. All images were averaged over 80 frames and linearly stretched to fill the colormap for visualization.
Fig. 7.
Example of in vivo AO retinal images obtained from Long Evans rat #1, showing a large blood vessel. All images shown are the average of 80 frames and linearly stretched for display purposes. Uniform, Speckle and Hilo images were obtained as described in Fig. 3. For this data, DOFx4 gave the best overall contrast and details. DOFx1, 8 and 12 are also shown here for comparison. Scale bar = 10 µm.
As with the images in Fig. 3, Uniform and Speckle images from the rat eye were acquired with uniform and speckle laser illumination, respectively. HiLo image stacks were obtained from Uniform and Speckle image stacks, then averaged to produce the HiLo image. We believe that the poor image quality of the Uniform image results partially from uncorrected ocular aberrations, but predominantly from intra-retinal light scatter within the rat eye. Confocal scanning methods used by others in the field appear far more resilient to such scatter, which probably explains differences in rodent image quality between our flood system and other recently published work [11–13]. Due to this inherent scatter the rodent eye provides a suitable real-world test of the ability of HiLo to provide pseudo-confocality and reduce the effects of out-of-plane scatter. As such, no artificial scattering medium was introduced. The high optical thickness of the rat retina in vivo (~10D) ensures various features in the retina are distributed greatly in terms of their optical vergence, providing further opportunity for the pseudo-confocality of HiLo to improve image quality (in general, the further from the plane of interest the undesired information is, the easier it is to remove with HiLo [23, 24, 36]).
It should be noted that no “Ideal” image was available for comparison since no ex vivo analysis was performed at the time of experiment. However the contrast at high spatial frequencies following HiLo can still be compared with that for the Uniform image. This is best shown in the HiLo images generated using DOFx1 and x4, as shown in Fig. 7. Note that for DOFx8 and x12, the image quality approaches that of the Uniform image due to the progressive loss of axial sectioning at higher DOF values.
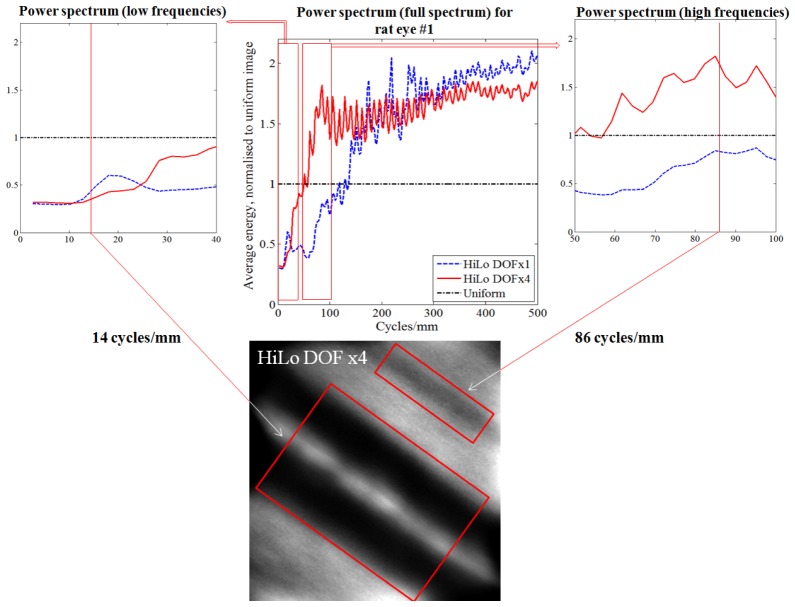
As noted above for the model eye results, altering the DOF parameter of the HiLo analysis enhances various features of the image at the expense of others. This is shown quantitatively by spectral power analysis in Fig. 8. For example, for DOFx1 the higher frequency features from about 200 cycles/mm became more distinct at the expense of detail in the lower frequency band (below about 120 cycles/mm). The impact of this on the images is evident by visual comparison of the DOFx1 and DOFx4 images, where the reflection from the blood vessel wall and a large dark stripe in the upper right corner of the image are more distinct in the latter. Overall this setting (DOFx4) was considered the most useful to enhance visualization of retinal features at this location.
Fig. 8.
Improvement to in vivo retinal image power spectrum following HiLo for rat #1. TOP CENTRE: Ratio plot of the normalized radial average energy of the FFT power spectrum of Uniform and HiLo images. All results are normalized by the Uniform image power spectrum, represented by a horizontal dash-dot line at ratio = 1.0. The horizontal axis represents spatial frequency in units of cycles/mm. INSET TOP LEFT: Magnified view at lower spatial frequencies. Low frequency information occupies a lower fraction of the energy spectrum after HiLo, due to removal of intra-ocular scatter. An example low frequency retinal feature - a blood vessel (~14 cycles/mm) is highlighted in the DOFx4 image at BOTTOM. INSET TOP RIGHT: Magnified view at medium spatial frequencies. Medium frequency information occupies a greater fraction of the energy spectrum after HiLo in DOFx4 compared to DOFx1. An example medium frequency feature - a nerve fibre bundle (86 cycles/mm) is highlighted at bottom.
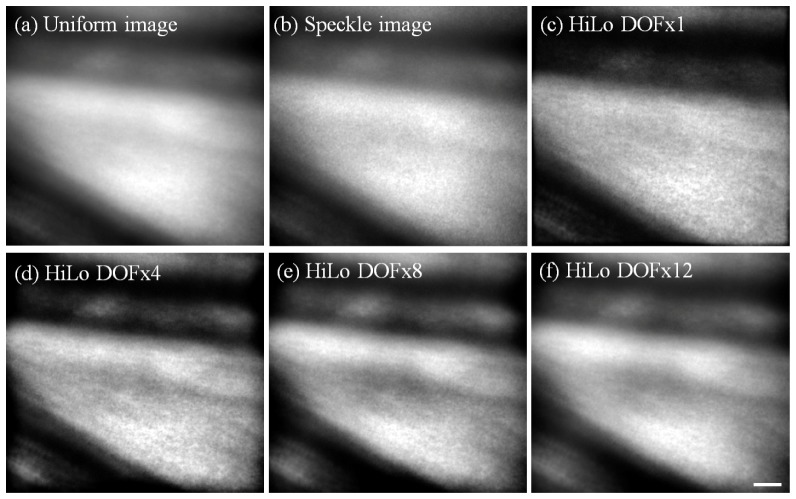
To demonstrate the robustness of the HiLo approach, Fig. 9 shows further images of blood vessels obtained from a different Long Evans rat near a bifurcation. The data was analysed and presented in the same way as Fig. 7. Fourier analysis results (not shown) are similar to the results shown in Fig. 8, in which DOFx1 is seen to be superior at higher frequencies beyond about 250 cycles/mm (4 µm in size), while DOFx4 was superior at lower frequencies. DOFx8 and 12 are also shown for comparison.
Fig. 9.
Example of in vivo AO retinal images obtained from another Long Evans rat (rat #2), showing two large blood vessels near a bifurcation. All images shown are the average of 82 frames and linearly stretched to fill the colormap for display purposes. Similar to Fig. 7, DOFx4 was considered most useful to enhance visualization of retinal features at this location. DOFx1, 8 and 12 are also shown here for comparison. Sensing wavelength = 670 nm, imaging wavelength = 532 nm. Scale bar = 10 µm.
4. Discussion
The results above demonstrate the benefits of speckle illumination HiLo imaging in selectively rejecting out-of-focus scattered light and improving the resolution and contrast of images obtained from a flood-illumination AO ophthalmoscope. Although originally developed for fluorescence microscopy, we have shown that HiLo imaging can also be used in reflectance to reject low frequency veiling glare and enhance the proportional contribution of higher frequency information. This pseudo-confocal effect has been shown in microscopy to potentially approach the true confocality offered by scanning systems which use a physical pinhole to reject out-of-focus light [24].
From the above applications, it can also be seen that the HiLo method is an empirical one, where algorithm parameters may be tuned as appropriate to enhance desired image features. However, it is important to note that no spurious image features are introduced from HiLo imaging. On the other hand, there is potential for the relative intensity of structures to be altered in the HiLo image when comparing to the raw uniform image. Nevertheless, in theory, relative comparisons of the same retinal structure could still be made over time (e.g. HiLo images acquired at different time points) or over wavelength (e.g. oxymetry with HiLo images acquired at different wavelengths), with the same HiLo filter applied. However, this remains to be validated empirically. In summary, there are several advantages and disadvantages of the HiLo approach.
4.1 Advantages of HiLo flood-illumination
The imaging frame rate using a flood ophthalmoscope can be more than an order of magnitude higher than in areal scanning modalities, thanks to the recent improvements in sCMOS camera technology. For example, AOSLO images from the human eye are typically acquired at 30 fps over an approximately 1° field [14, 18, 30, 37], although frame rates of up to 60 fps has been reported over a 1.5° field [19]. On the other hand, flood illumination AO ophthalmoscopy with sCMOS detectors can partially sacrifice vertical field-of-view extent to achieve much higher frame rates; with similar field size and pixel sampling density we have previously reported results acquired at 400 fps, and with more restricted field size have imaged at 1000 fps to study cone photoreceptor bleaching dynamics [22]. This makes it possible to capture fast cellular dynamics including the direct tracking of individual blood cells and of rapid optical changes in the photoreceptors. The frame rate can be further increased in both scanning and flood-sCMOS modalities by reducing the extent of the imaged field in one dimension, however the proportional advantage of sCMOS detection is retained. Therefore HiLo microscopy has the potential to offer improved image quality in applications that require high frame rate, while offering some of the benefits of confocality that would not be available with typical flood-illumination methods. This is especially relevant to the rodent eyes as we have shown here, which appear to suffer significant amounts of scatter.
Another advantage of HiLo imaging is that the degree of pseudo-confocality required can be tuned post hoc, by varying the depth-of-field parameter, to allow the visualization of particular structures of interest to be maximized. Thus the same 3D tissue structure can be viewed in multiple ways from the same set of data [24].
In addition to the above, other appealing factors of HiLo imaging are its low cost and greater simplicity which are also, speaking generally, advantages of flood AO systems compared to their scanning counterparts. Moreover, integrating HiLo imaging into a flood system requires only an additional de-speckler (in our case, a Spatial Phase Randomizer), capable of rapid modulation, placed immediately in front of a coherent illumination laser (in our case, a 532 nm DPSS laser). These potentially make HiLo imaging more accessible in situations where cost and alteration of existing setup are of concern.
4.2 Disadvantages of HiLo flood-illumination
The principal disadvantage of HiLo imaging is that the improvement in image quality attained by pseudo-confocality can approach but not equal those gained by the selection of an appropriately sized pinhole in a scanning system. Nonetheless, impressive gains may still be made as shown here. Although we do not have confocal AOSLO data from the same eyes with which to make comparisons, other work has shown that image quality between flood-HiLo and confocal scanning modalities has the potential to be quite similar under certain conditions [24], with resolution reaching 0.5 µm with HiLo in microscopy applications [36].
A second disadvantage of HiLo imaging is that currently analysis must be performed offline, making it more difficult to optimize the parameters of the imaging system and position the specimen (in this case the eye) to provide optimal image quality. Of course, this can be done to some extent by optimizing the quality of the real-time Uniform (speckle-free) image, but this is prone to increased error in images suffering from large amounts of scatter.
Since HiLo imaging rejects out-of-focus-plane scattered light during post-processing, the cameras must have a higher dynamic range than that used in confocal systems, which rejects background light using a physical pinhole. In addition, the background shot noise rejection in HiLo is imperfect, since only a bias from the shot noise can be corrected [24]. It is therefore important to have good knowledge of the specifications of the imaging and illumination setup to produce the optimal HiLo image.
Our current, preliminary, method of obtaining HiLo images has further limitations that prevent the realization of the high frame rates described above. The Uniform images in each sequence were obtained as a group, before the SPR was manually switched off to generate a coherent source for speckle imaging. This sequential acquisition approach together with the relatively slow switching of the spatial phase randomizer do not lend themselves to rapid frame rates. A viable alternative would be to use a fast-switching optical bypass circuit or even two illumination channels of sufficiently different wavelength such that a dichroic filter could be used to efficiently separate and recombine them, with one channel consisting of uniform, and the other of speckle, illumination. This would allow rapid multiplexed or even simultaneous acquisition of Uniform and Speckle images so that high speed HiLo data could then be constructed post hoc. The mismatch between wavelengths would need to be corrected in terms of only the magnification difference induced by chromatic aberration; it is not necessary for the wavelengths to otherwise be matched as would be necessary if the technique involved, for example, solution of the transport of intensity equation. There are also issues with our current approach in terms of eye movements and drifts in aberration over time that would be solved using this twin illumination channel approach.
4.3 Other limitations of the current study
Although we have shown improvement of flood AO images with HiLo imaging, and the image quality is the best that can be achieved by a flood AO system so far, rodent eye image quality from our flood system is still inferior to that from scanning systems, such as the nerve fibre bundle shown in reflectance by Geng et al. (2012) in the mouse eye [11]. Evidently, the rodent eye is less well corrected by our deformable mirror, with a measured residual RMS wavefront error of 0.06-0.10 µm. While it is possible that this could be ameliorated by using the latest generation deformable mirror technology (e.g. Alpao, Montbonnot St. Martin, France), the image quality (before HiLo) seen in the rodent is much worse than would be expected for even 0.10 µm RMS wavefront error. In other words, any residual wavefront error reported by the sensor is not the limiting factor for image quality.
There are other potential methods to improve image quality of rodent eye from flood systems. We can use the same wavelength for sensing and imaging, as this will reduce the residual aberration due to difference in sensing and imaging wavelengths in a high powered eye [10]. There is also the promise of sensorless AO methods, which can bypass the challenging wavefront sensing step and has been used in a human AOSLO [38] and a mouse AO-OCT system [39]. Regardless of the technique chosen, some degree of confocality is needed to image the rodent eye - and HiLo can provide that to a certain degree, when physical confocality is not possible or not desired.
5. Conclusion
We have shown that HiLo imaging can reject out-of-focus scatter, and improve resolution of images obtained from a flood AO ophthalmoscope. HiLo imaging has the advantage of being easily implemented within existing flood illumination systems, using relatively minimal hardware and software changes. Given the substantially improved image quality, the increased post-acquisition image processing time is largely acceptable, though a dual illumination channel setup will be required to achieve the gains in frame rate made possible by flood illumination.
References and links
- 1.Bui B. V., Edmunds B., Cioffi G. A., Fortune B., “The gradient of retinal functional changes during acute intraocular pressure elevation,” Invest. Ophthalmol. Vis. Sci. 46(1), 202–213 (2005). 10.1167/iovs.04-0421 [DOI] [PubMed] [Google Scholar]
- 2.Bui B. V., Loeliger M., Thomas M., Vingrys A. J., Rees S. M., Nguyen C. T., He Z., Tolcos M., “Investigating structural and biochemical correlates of ganglion cell dysfunction in streptozotocin-induced diabetic rats,” Exp. Eye Res. 88(6), 1076–1083 (2009). 10.1016/j.exer.2009.01.009 [DOI] [PubMed] [Google Scholar]
- 3.Kohzaki K., Vingrys A. J., Bui B. V., “Early inner retinal dysfunction in streptozotocin-induced diabetic rats,” Invest. Ophthalmol. Vis. Sci. 49(8), 3595–3604 (2008). 10.1167/iovs.08-1679 [DOI] [PubMed] [Google Scholar]
- 4.He Z., Bui B. V., Vingrys A. J., “Effect of repeated iop challenge on rat retinal function,” Invest. Ophthalmol. Vis. Sci. 49(7), 3026–3034 (2008). 10.1167/iovs.07-1628 [DOI] [PubMed] [Google Scholar]
- 5.Marc R. E., Jones B. W., Watt C. B., Vazquez-Chona F., Vaughan D. K., Organisciak D. T., “Extreme retinal remodeling triggered by light damage: Implications for age related macular degeneration,” Mol. Vis. 14, 782–806 (2008). [PMC free article] [PubMed] [Google Scholar]
- 6.Mansour S. L., Thomas K. R., Capecchi M. R., “Disruption of the proto-oncogene int-2 in mouse embryo-derived stem cells: A general strategy for targeting mutations to non-selectable genes,” Nature 336(6197), 348–352 (1988). 10.1038/336348a0 [DOI] [PubMed] [Google Scholar]
- 7.Capecchi M. R., “Altering the genome by homologous recombination,” Science 244(4910), 1288–1292 (1989). 10.1126/science.2660260 [DOI] [PubMed] [Google Scholar]
- 8.Abbott A., “Laboratory animals: The renaissance rat,” Nature 428(6982), 464–466 (2004). 10.1038/428464a [DOI] [PubMed] [Google Scholar]
- 9.Geurts A. M., Cost G. J., Freyvert Y., Zeitler B., Miller J. C., Choi V. M., Jenkins S. S., Wood A., Cui X., Meng X., Vincent A., Lam S., Michalkiewicz M., Schilling R., Foeckler J., Kalloway S., Weiler H., Ménoret S., Anegon I., Davis G. D., Zhang L., Rebar E. J., Gregory P. D., Urnov F. D., Jacob H. J., Buelow R., “Knockout rats via embryo microinjection of zinc-finger nucleases,” Science 325(5939), 433 (2009). 10.1126/science.1172447 [DOI] [PMC free article] [PubMed] [Google Scholar]
- 10.Zhou X., Bedggood P., Metha A., “Limitations to adaptive optics image quality in rodent eyes,” Biomed. Opt. Express 3(8), 1811–1824 (2012). 10.1364/BOE.3.001811 [DOI] [PMC free article] [PubMed] [Google Scholar]
- 11.Geng Y., Dubra A., Yin L., Merigan W. H., Sharma R., Libby R. T., Williams D. R., “Adaptive optics retinal imaging in the living mouse eye,” Biomed. Opt. Express 3(4), 715–734 (2012). 10.1364/BOE.3.000715 [DOI] [PMC free article] [PubMed] [Google Scholar]
- 12.Geng Y., Greenberg K. P., Wolfe R., Gray D. C., Hunter J. J., Dubra A., Flannery J. G., Williams D. R., Porter J., “In vivo imaging of microscopic structures in the rat retina,” Invest. Ophthalmol. Vis. Sci. 50(12), 5872–5879 (2009). 10.1167/iovs.09-3675 [DOI] [PMC free article] [PubMed] [Google Scholar]
- 13.Schallek J. B., Geng Y., Nguyen H., Williams D. R., “Morphology and topography of retinal pericytes in the living mouse retina using in vivo adaptive optics imaging and ex vivo characterization,” Invest. Ophthalmol. Vis. Sci. 54(13), 8237–8250 (2013). 10.1167/iovs.13-12581 [DOI] [PMC free article] [PubMed] [Google Scholar]
- 14.Roorda A., Romero-Borja F., Donnelly W., III, Queener H., Hebert T., Campbell M., “Adaptive optics scanning laser ophthalmoscopy,” Opt. Express 10(9), 405–412 (2002). 10.1364/OE.10.000405 [DOI] [PubMed] [Google Scholar]
- 15.Zawadzki R. J., Choi S. S., Jones S. M., Oliver S. S., Werner J. S., “Adaptive optics-optical coherence tomography: Optimizing visualization of microscopic retinal structures in three dimensions,” J. Opt. Soc. Am. A 24(5), 1373–1383 (2007). 10.1364/JOSAA.24.001373 [DOI] [PMC free article] [PubMed] [Google Scholar]
- 16.Pircher M., Zawadzki R. J., Evans J. W., Werner J. S., Hitzenberger C. K., “Simultaneous imaging of human cone mosaic with adaptive optics enhanced scanning laser ophthalmoscopy and high-speed transversal scanning optical coherence tomography,” Opt. Lett. 33(1), 22–24 (2008). 10.1364/OL.33.000022 [DOI] [PMC free article] [PubMed] [Google Scholar]
- 17.Jian Y. F., Zawadzki R. J., Sarunic M. V., “Adaptive optics optical coherence tomography for in vivo mouse retinal imaging,” J. Biomed. Opt. 18(5), 056007 (2013). 10.1117/1.JBO.18.5.056007 [DOI] [PMC free article] [PubMed] [Google Scholar]
- 18.Roorda A., “Applications of adaptive optics scanning laser ophthalmoscopy,” Optom. Vis. Sci. 87(4), 260–268 (2010). [DOI] [PMC free article] [PubMed] [Google Scholar]
- 19.Tam J., Tiruveedhula P., Roorda A., “Characterization of single-file flow through human retinal parafoveal capillaries using an adaptive optics scanning laser ophthalmoscope,” Biomed. Opt. Express 2(4), 781–793 (2011). 10.1364/BOE.2.000781 [DOI] [PMC free article] [PubMed] [Google Scholar]
- 20.Bedggood P., Metha A., “Analysis of contrast and motion signals generated by human blood constituents in capillary flow,” Opt. Lett. 39(3), 610–613 (2014). 10.1364/OL.39.000610 [DOI] [PubMed] [Google Scholar]
- 21.Bedggood P., Metha A., “Optical imaging of human cone photoreceptors directly following the capture of light,” PLoS ONE 8(11), e79251 (2013). 10.1371/journal.pone.0079251 [DOI] [PMC free article] [PubMed] [Google Scholar]
- 22.Bedggood P., Metha A., “Direct visualization and characterization of erythrocyte flow in human retinal capillaries,” Biomed. Opt. Express 3(12), 3264–3277 (2012). 10.1364/BOE.3.003264 [DOI] [PMC free article] [PubMed] [Google Scholar]
- 23.Lim D., Chu K. K., Mertz J., “Wide-field fluorescence sectioning with hybrid speckle and uniform-illumination microscopy,” Opt. Lett. 33(16), 1819–1821 (2008). 10.1364/OL.33.001819 [DOI] [PubMed] [Google Scholar]
- 24.Lim D., Ford T. N., Chu K. K., Mertz J., “Optically sectioned in vivo imaging with speckle illumination hilo microscopy,” J. Biomed. Opt. 16(1), 016014 (2011). 10.1117/1.3528656 [DOI] [PMC free article] [PubMed] [Google Scholar]
- 25.Santos S., Chu K. K., Lim D., Bozinovic N., Ford T. N., Hourtoule C., Bartoo A. C., Singh S. K., Mertz J., “Optically sectioned fluorescence endomicroscopy with hybrid-illumination imaging through a flexible fiber bundle,” J. Biomed. Opt. 14(3), 030502 (2009). 10.1117/1.3130266 [DOI] [PubMed] [Google Scholar]
- 26.Schneider C. A., Rasband W. S., Eliceiri K. W., “Nih image to imagej: 25 years of image analysis,” Nat. Methods 9(7), 671–675 (2012). 10.1038/nmeth.2089 [DOI] [PMC free article] [PubMed] [Google Scholar]
- 27.Lim D., Mertz J., “Hilo imagej plugin (version 1.2),” (2013), http://biomicroscopy.bu.edu/resources/
- 28.Ford T. N., Lim D., Mertz J., “Fast optically sectioned fluorescence hilo endomicroscopy,” J. Biomed. Opt. 17(2), 021105 (2012). 10.1117/1.JBO.17.2.021105 [DOI] [PMC free article] [PubMed] [Google Scholar]
- 29.Liang J., Williams D. R., “Aberrations and retinal image quality of the normal human eye,” J. Opt. Soc. Am. A 14(11), 2873–2883 (1997). 10.1364/JOSAA.14.002873 [DOI] [PubMed] [Google Scholar]
- 30.Dubra A., Sulai Y., “Reflective afocal broadband adaptive optics scanning ophthalmoscope,” Biomed. Opt. Express 2(6), 1757–1768 (2011). 10.1364/BOE.2.001757 [DOI] [PMC free article] [PubMed] [Google Scholar]
- 31.Tam J., Martin J. A., Roorda A., “Noninvasive visualization and analysis of parafoveal capillaries in humans,” Invest. Ophthalmol. Vis. Sci. 51(3), 1691–1698 (2010). 10.1167/iovs.09-4483 [DOI] [PMC free article] [PubMed] [Google Scholar]
- 32.Geng Y., Schery L. A., Sharma R., Dubra A., Ahmad K., Libby R. T., Williams D. R., “Optical properties of the mouse eye,” Biomed. Opt. Express 2(4), 717–738 (2011). 10.1364/BOE.2.000717 [DOI] [PMC free article] [PubMed] [Google Scholar]
- 33.Hughes A., “A schematic eye for the rat,” Vision Res. 19(5), 569–588 (1979). 10.1016/0042-6989(79)90143-3 [DOI] [PubMed] [Google Scholar]
- 34.Delori F. C., Webb R. H., Sliney D. H., American National Standards Institute , “Maximum permissible exposures for ocular safety (ansi 2000), with emphasis on ophthalmic devices,” J. Opt. Soc. Am. A 24(5), 1250–1265 (2007). 10.1364/JOSAA.24.001250 [DOI] [PubMed] [Google Scholar]
- 35.Sulai Y. N., Dubra A., “Optical design of a broadband scanning adaptive optics ophthalmoscope for the mouse eye,” in SPIE Proceedings (MEMS Adaptive Optics VIII, 2014), pp. 89780E–89780E–89789 [Google Scholar]
- 36.Michaelson J., Choi H. J., So P., Huang H. D., “Depth-resolved cellular microrheology using hilo microscopy,” Biomed. Opt. Express 3(6), 1241–1255 (2012). 10.1364/BOE.3.001241 [DOI] [PMC free article] [PubMed] [Google Scholar]
- 37.Pinhas A., Dubow M., Shah N., Chui T. Y., Scoles D., Sulai Y. N., Weitz R., Walsh J. B., Carroll J., Dubra A., Rosen R. B., “In vivo imaging of human retinal microvasculature using adaptive optics scanning light ophthalmoscope fluorescein angiography,” Biomed. Opt. Express 4(8), 1305–1317 (2013). 10.1364/BOE.4.001305 [DOI] [PMC free article] [PubMed] [Google Scholar]
- 38.Hofer H., Sredar N., Queener H., Li C., Porter J., “Wavefront sensorless adaptive optics ophthalmoscopy in the human eye,” Opt. Express 19(15), 14160–14171 (2011). 10.1364/OE.19.014160 [DOI] [PMC free article] [PubMed] [Google Scholar]
- 39.Jian Y., Xu J., Gradowski M. A., Bonora S., Zawadzki R. J., Sarunic M. V., “Wavefront sensorless adaptive optics optical coherence tomography for in vivo retinal imaging in mice,” Biomed. Opt. Express 5(2), 547–559 (2014). 10.1364/BOE.5.000547 [DOI] [PMC free article] [PubMed] [Google Scholar]


