Abstract
We introduce a new, non-invasive, diffuse optical technique, speckle contrast optical spectroscopy (SCOS), for probing deep tissue blood flow using the statistical properties of laser speckle contrast and the photon diffusion model for a point source. The feasibility of the method is tested using liquid phantoms which demonstrate that SCOS is capable of measuring the dynamic properties of turbid media non-invasively. We further present an in vivo measurement in a human forearm muscle using SCOS in two modalities: one with the dependence of the speckle contrast on the source-detector separation and another on the exposure time. In doing so, we also introduce crucial corrections to the speckle contrast that account for the variance of the shot and sensor dark noises.
OCIS codes: (170.6480) Spectroscopy, speckle; (170.7050) Turbid media; (170.1470) Blood or tissue constituent monitoring
1. Introduction
Non-invasive, optical imaging of blood flow has many applications in bio-medicine [1, 2]. Several optical approaches for non-invasive, in vivo blood flow measurements rely on the statistics of the laser speckles; laser Doppler flowmetry (LDF) uses the frequency broadening [3], diffuse correlation spectroscopy (DCS) [4–6] uses the light intensity auto-correlation and laser speckle flowmetry (LSF) [7] uses the spatio-temporal blurring of the speckles. A key difference between these methods is their penetration depth. LDF and LSF generally utilize single or few scattering events and therefore probe superficial (<1 mm) tissues whereas DCS uses photon diffusion theory and probes deep tissues up to several centimeters. Here, we present speckle contrast optical spectroscopy (SCOS) which, in a similar fashion to LSF, uses the speckle contrast but with point sources placed at a distance as in DCS, i.e. detecting photons that have undergone multiple scattering. This provides detection of many speckles in parallel but with extended path lengths for deep tissue sampling.
We note that, recently [8], it has been demonstrated in a flow phantom as well as in a human arm that it is possible to measure changes in blood flow by considering it as the inverse of the speckle contrast using one point source illumination and defining detectors at different distances in a CCD camera. This study was further extended [9] to multi-channel deep tissue flowmetry by fiber coupling the camera to the probed sample. However, unlike DCS, this study did not utilize a model based fitting to decouple the effects of absorption and scattering from the dynamics, and, therefore, did not extract a quantitative estimate of blood flow.
In a previous paper [10], we have introduced a three dimensional tomographic imaging method, speckle contrast optical tomography (SCOT), for quantitative three-dimensional reconstruction of deep tissue blood flow heterogeneities. In doing so, we have developed and tested a physical model (forward model) for the homogeneous blood flow which was then used to construct the Jacobian for tomography. SCOT was demonstrated in a preliminary phantom study. This model is the starting point of SCOS. However, as we discuss in this paper, in order to apply SCOS for realistic scenarios including in vivo measurements, we have developed a more thorough approach to account for the noise sources, a new experimental set-up for the re-emission geometry, new phantom measurements and an in vivo measurement. Furthermore, SCOS provides a more robust forward model for the future development of SCOT for in vivo tomography.
The method, SCOS, presented here merges the advantages of relatively inexpensive detectors with high frame rates that LSF uses and the quantitative deep tissue flow measurement capabilities of DCS. By using an array of two-dimensional (2D) detectors, SCOS has a broad field-of-view in a single-shot. The SNR can be greatly improved by averaging signals from many detectors, in case of a CCD/CMOS camera up to an order of a million speckles simultaneously. SCOS measurements can be performed in two different ways with equivalent results: one fixing an exposure time and measuring the speckle contrast at different distances from the source and the other measuring at multiple exposure times [11] with a fixed source-detector distance. One can also utilize both methods simultaneously for an even more complete data-set.
In section 1, we present the theoretical development of SCOS and the corrections done to the speckle contrast measurements to account for the shot noise and the noises introduced by the detector. In section 2, a series of experiments in liquid tissue simulating phantoms are shown to illustrate the feasibility of SCOS, one in transmission geometry using the speckle contrast dependence on distance from a point source and another, in re-emission geometry, with the dependence on exposure time at a fixed source-detector separation. We further present the extension of the re-emission geometry to an in vivo experiment in the human forearm muscle, showing the feasibility of both multiple source-detector separation and multiple exposure measurements from a single source-detector separation in section 3. Finally, in section 4, we discuss the results, compare the method to LSF, LDF and DCS, outline the advantages and disadvantages of the method and suggest future improvements.
1.1. Theoretical background
SCOS uses the speckle contrast (κ) that is defined as the ratio of the standard deviation (σI) of the measured intensity in a given exposure time to its mean (μI) value over different speckles in space or time, i.e., κ = σI/μI. The speckle contrast (κ) is related to the electric field autocorrelation function (G1(r, τ)) as [12]:
| (1) |
where G1(r, τ) = 〈E*(r, t) · E(r, t + τ)〉 and g1(r, τ) = G1(r, τ)/G1(r, 0) is the normalized field auto-correlation function. E(r, t) is the light electric field emerging from tissue, at time t and position r. The brackets 〈 〉 in the electric field auto-correlation function denote ensemble averages for theoretical calculations, whereas for experimental measurements denote time averages. β is an instrumental constant accounting for the optical system [6], τ is the correlation time and T is the exposure time of the detection system.
It is well known that G1(r, τ) obeys the correlation diffusion equation (CDE) [4–6]:
| (2) |
where k0 is the modulus of propagation vector of light, is the reduced scattering coefficient, D ≈ v/3 is the optical diffusion coefficient, μa is the absorption coefficient, S0(r − r0) is an isotropic source (point source) located at r0 and v is the velocity of light in the turbid medium. 〈Δr2(τ)〉 is the mean-square displacement (MSD) of the moving scatterers, i.e. red blood cells in case of tissues, in delay time τ. α is the ratio of moving scatterers to the total number of scatterers in the sample which estimates the fraction of photon scattering events from moving scatterers.
The electric field auto-correlation function, G1(r, τ), varies depending on the geometry of the diffusive medium. For the purpose of this work, we have used the analytical solutions [4, 5] for the homogeneous parallel plane slab [13] and the semi-infinite medium [14] corresponding to the transmission and re-emission geometries respectively. These solutions consider a parallel plane tissue slab of thickness s, an isotropic light source at depth z0 = 1/ inside the tissue and z as the light propagation direction. For this geometry and under the extrapolated boundary condition [14], the Green’s function, G1, at a distance r from the source is given by [6]:
| (3) |
where r±,m = (r2 + (z − z±,m)2)1/2 and . The extrapolated boundary is at a distance ze = 2AD from the physical, parallel plate boundaries where D is the optical diffusion coefficient as defined before and A = (1 + Reff)/(1 − Reff). Reff ≈ −1.440n−2 + 0.710n−1 + 0.668 + 0.00636n is the effective reflection coefficient to account for the index mismatch between tissue and air where n is refractive index ratio between diffusing medium and the external medium, i.e., n = ndiff /next. An infinite number of dipoles represent pairs of positive and negative sources placed at z+,m = 2m(s + 2ze)+ z0 for the positive sources and at z−,m = 2m(s + 2ze) − 2ze − z0 for the negatives with m = (0, ±1, ±2...). The semi-infinite medium solution is a special case of the slab solution when only the m = 0 terms are considered, i.e with only one planar boundary.
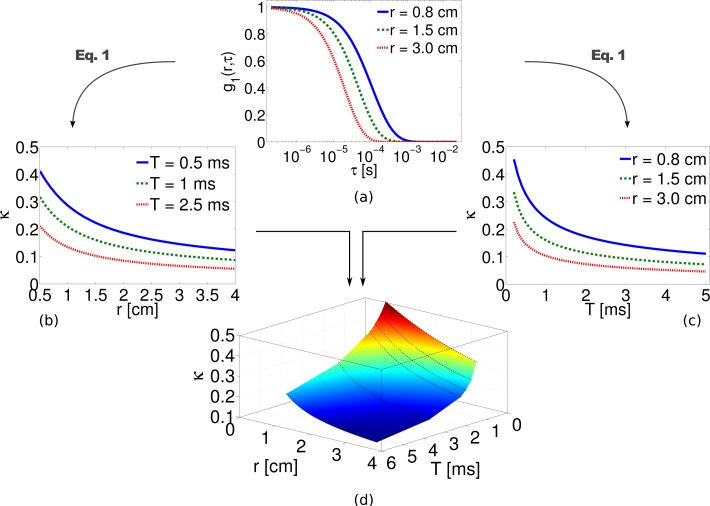
In most work on living tissues and on liquid phantoms, the mean square displacement, 〈Δr2(τ)〉, is assumed to be equal to 6DBτ, where DB is the particle diffusion coefficient. This has been tested extensively in DCS experiments on living tissues [6] and was found to follow a Brownian diffusion model where an “effective” αDB corresponds to a blood flow index (BFI). Typical normalized field autocorrelation functions as a function of correlation time (τ) for three different source detector separations (r) are plotted in Fig. 1(a) using the analytical Green’s function formula given in Eq. (3). The corresponding speckle contrast as function of source-detector separation and exposure time are computed using Eq. (1) and are plotted in Figs. 1(b) and (c) respectively. The surface plot of speckle contrast as function of both r and T is shown in Fig. 1(d) which depicts the complete set of theoretical data that is available in SCOS for measuring the blood flow. In the following section we will describe the extent to which the above-said plots deviates from their theoretical values due to presence of shot noise and detector/sensor specific noise, i.e. CCD or CMOS, and the necessary steps to be taken to overcome it.
Fig. 1.
Normalized field auto-correlation function for three different source-detector separations is calculated using Eq. (3) in panel (a). The dependence of the speckle contrast derived from Eq. (1) on (b) source-detector separation and (c) exposure time for a point source are also shown. The combined result can be viewed (d) as a surface plot of the speckle contrast dependence on both distance and exposure time. Here = 10 cm−1, μa = 0. 1 cm−1, DB = 1 × 10⁻⁸ cm2/s.
In summary, SCOS allows us to use Eq. (1) and Eq. (2) to determine the dynamic properties of a diffusive medium by relying on the dependence of the speckle contrast with the distance from the source and/or at multiple exposure times as presented in Fig. 1. This provide us with a tractable physical model for multiple scattering experiments with point-sources when measuring κ.
1.2. Noise corrections
In practice, it is critical that the calculations of speckle contrast derived from experimental measurements take into account the contributions to κ due to shot noise and different types of noise inherent to the specific detection system. Since κ depends on the variance of the observed signal, unless these systematic effects are accounted for, the speckle contrast will deviate from its theoretical behavior. This is specially visible in regions where SNR is lower.
The raw intensity images are initially corrected for the dark counts before computing the speckle contrast. A mean dark image, μID, is obtained by taking the mean of several dark frames, ID. From each raw intensity image, I, the μID is subtracted which gives the dark subtracted images denoted as Ic = I − μID. The speckle contrast is then defined as the ratio of the standard-deviation over different speckles separated in space or time, σ(Ic), to their mean, μ(Ic). Here the dark subtraction will in fact remove the contribution of the mean dark counts from the μ(Ic) because μ(Ic) = μ(I) − μID but the variance of the mean dark counts will be added to the variance of the raw intensity images due to the fact that σ2(Ic) = σ2(I) + σ2(μID). This observation leads us to conclude that subtracting the mean dark image from the raw image does not help to remove the noise (variance) associated with the dark image. Hence, we use a dark variance correction ( ) to remove the dark noise variance from the variance of raw intensity images. This parameter contains different sources of noise including the readout noise. The mean dark variance, , is the mean of variances computed from several dark frames which are acquired at the same exposure time as we use to obtain the raw intensity images. The variances and the mean can be computed either by using a fixed window or a sliding window as explained in section 2.2 and section 3.3. Note that the above observations are applicable to intensity images expressed in both electrons and digital counts.
Another, often more significant, noise source is the inherent shot-noise which obeys the Poisson statistics with a variance equal to the mean, i.e., in electrons [e−]. The speckle contrast purely due to shot-noise can be written as [15], where γ is the ratio of full well capacity of a CCD/sCMOS camera to its analog-to-digital conversion bits. In other words, we convert the counts into electrons [e−]. The shot-noise corrected speckle contrast is then defined as [15]. Finally, combining the dark correction and shot noise correction we have the corrected speckle contrast (κc) as
| (4) |
Here all the variances and the mean are computed from the intensity images in electrons unit which are obtained by multiplying the intensity images in digital units with γ.
1.3. Fitting procedure
In all experiments, a non-linear least squares fit is carried out assuming known, independently measured, optical properties of the probed medium to obtain a DB value corresponding to a blood flow index in tissues. The fit uses the appropriate Green’s function (Eq. (3)) as the solution of the correlation diffusion equation (Eq. (2)) and relates the model to the speckle contrast versus source-detector separation (S-D separation) and/or exposure time using Eq. (1). Since the instrumental/optical constant, β, was not measured accurately, we normalize both the measured and calculated speckle contrast by its mean. In order to illustrate the importance of the correction procedures, we fit both corrected and uncorrected speckle contrast and discuss the differences in section 3.1.
2. Methods
2.1. Tissue simulating phantoms
In order to demonstrate that SCOS is capable of retrieving the dynamic properties of a medium, we have performed measurements in tissue simulating phantoms in a similar fashion as previous DCS experiments [16, 17]. The primary phantom consists of a 1% solution of Lipofundin® MCT/LCT 20% (B.Braun, Spain) in water with μa = 0.026cm−1, = 6.31 cm−1 and DB = (1.95 ± 0.05) × 10−8 cm2/s. Another phantom with a reduced DB is prepared with an increased viscosity consisting of 50% glycerol (G2025, Sigma-Aldrich, Spain)- 50% Lipofundin® MCT/LCT (20%) with μa = 0.02 cm−1, = 9.72 cm−1 and DB = (6.93 ± 0.39) × 10−10 cm2/s. The optical properties of the phantoms were independently measured using time resolved spectroscopy (TRS) and the DB value by DCS. From this point on, we denote these phantoms as Lipofundin phantom and glycerol phantom respectively.
First we present an experiment in transmission geometry where the two liquid phantoms presented above were studied using the speckle contrast measurement made at multiple source-detector separations at a given exposure time. Subsequently, the Lipofundin phantom is studied using the speckle contrast measurement made at different exposure times for a given source-detector separation in the re-emission geometry.
2.2. Transmission geometry
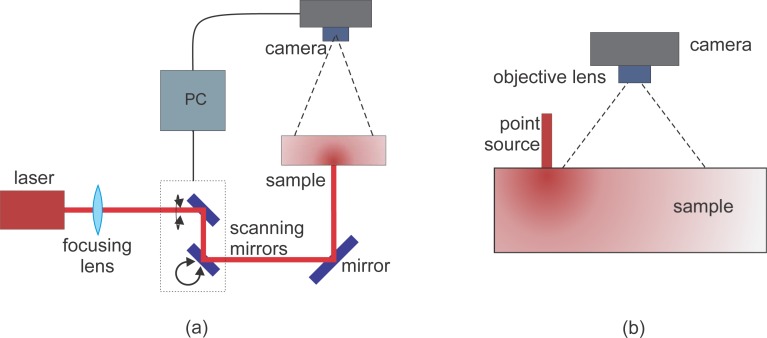
The experiment is illustrated in Fig. 2(a). A continuous-wave, temperature controlled laser diode (Thorlabs L785P090, 785 nm, 90 mW) was focused down to 1 mm diameter and illuminated the sample from the bottom. The speckle patterns due to the transmitted light were imaged from the top with a monochrome scientific complementary metal-oxide-semiconductor camera (sCMOS; ORCA-Flash4.0, Hamamatsu, Japan γ = 0.4578). A lens with f=50 mm and f/#=16 was chosen to match the speckle size to pixel size. The sample liquid filled a transparent container with very thin walls filled up to a height of 1.5 cm giving a parallel plane slab geometry with s = 1.5cm.
Fig. 2.
SCOS experimental set up. (a) Transmission geometry: The laser is raster scanned illuminating the sample on one plane of a 1.5cm thick, parallel plane while the camera collects the transmitted speckles on the other plane. (b) Re-emission geometry: The laser is coupled to a multi-mode optical fiber and illuminates the phantom on the same plane as the camera.
Statistically independent speckle contrast measurements were acquired by scanning the point source in a three by twenty-five (3×25) grid centered in the field of view of the camera (4 cm × 3.5 cm). The exposure time was set to 1 ms and a frame rate of 100 fps was used to ensure that the speckles were temporally uncorrelated over the different images [7]. The point source illuminated each source position for 0.5 s, i.e. we have acquired up to fifty images at each position. In order to avoid any instabilities from when the source may still be moving (≈150ms), we have used only the latest thirty-five images for analysis.
For every image, we have defined 75 detectors with a size of twenty-five by twenty-five pixels (∼0.75×0.75 mm2). These detectors were positioned matching the 3×25 scanning grid. The speckle contrast was calculated in each of the defined detectors in regions of five by five (5×5) pixels. Then these regions were temporally averaged over thirty-five frames and spatially averaged over the entire detector. This resulted in seventy-five by seventy-five source-detector pairs with a minimum source-detector distance of 1.5 cm, corresponding to the slab thickness, i.e. the phantom height. A similar geometry was previously utilized in speckle contrast optical tomography (SCOT) [10].
2.3. Re-emission geometry
For many non-invasive in vivo applications, it is desirable to work with the re-emission geometry where the illumination and collection are done on the same surface. Here, we have used the same equipment, lens and field-of-view employed in the transmission experiment but the point source illumination was done through a 200μm multimode fiber in contact with the surface of the liquid phantom on the same plane as the camera field-of-view.
To demonstrate the ability of SCOS to work with multiple exposure times even at a single source-detector separation, we have performed the measurement on the Lipofundin phantom where the fiber was fixed at one position for the whole experiment as presented in Fig. 2(b). The active rows of the camera were reduced to eight to allow exposure times from 0.2 to 1 ms, and up to 1000 images were obtained for each exposure time.
2.4. In vivo experiment
After showing the feasibility of SCOS in tissue simulating phantoms, we present a demonstration of the method in vivo using a re-emission geometry on the human forearm muscle. The optical properties of the arm were measured with TRS obtaining = 5.68 cm−1 and μa = 0.11 cm−1 and were utilized in the analysis.
For this experiment, neutral density filters were placed after the focusing lens to ensure that the illumination power was below the maximum permissible exposure. The source position was fixed at one position out of the camera field-of-view for the whole measurement to avoid saturated pixels inside it. A CCD camera (Orca-R2, Hamamatsu, Japan, γ = 0.2747) was set to image a region of 2.4 × 1.8 cm2 in the forearm with a lens with f=50mm and f/#=16 to match the pixel to speckle size. The camera was operated in the 16-bit mode and in the low light mode [18] to increase the quantum efficiency at the working wavelength. From the sensor, we have used only 672×496 pixels and we have acquired 1000 images at 16 fps for each exposure time from 250 μs to 5 ms. From these measurements, it is possible to work with both the dependence of the speckle contrast on the distance from the point source and on the exposure time. Figure 3 shows a photograph of the set-up for the in vivo experiment. The arm is held in place using an adapted off-the-shelf wrist-cast.
Fig. 3.
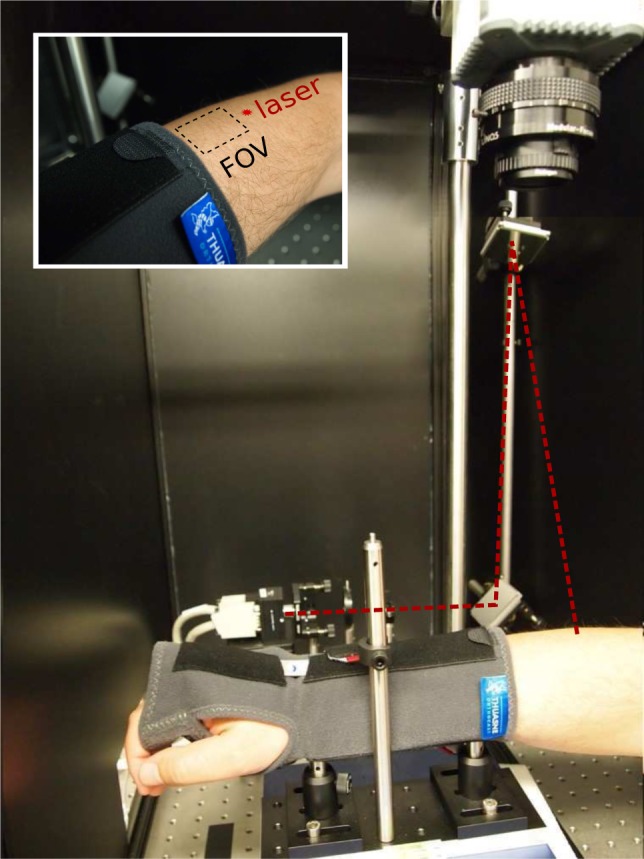
The photograph of the setup for the in vivo experiment. The inset figure depicts the approximate location of the source and the field-of-view.
3. Results
3.1. Transmission geometry
The speckle contrast of each 75×75 source-detector pair is plotted against the distance between each pair as shown in Fig. 4(a) for the Lipofundin phantom [10]. We note that theoretically all pixels with a sufficient SNR can be utilized as an independent detector. The squares represent the speckle contrast calculated without any noise correction but it is seen that after about 1.7 cm there is a systematic deviation from the expected decay. In fact, even the early parts of this curve are affected by the additive variance due to shot-noise. The circles represent the corrected curve where working range is increased to about ∼2.3 cm.
Fig. 4.
(a) The normalized speckle contrast for the Lipofundin phantom with (circles) and without (squares) shot noise correction [10]. (b) A comparison of experimental data to a fit for DB = 1.68 ×10⁻⁸ cm2/s obtained using SCOS for 1% Lipofundin phantom [10] along with the κ computed using the DB = 1.95 × 10⁻⁸ cm2/s from the DCS measurement. (c) Data and fit for DB = 5.31 × 10⁻¹⁰ cm2/s from a 50% glycerol-50% Lipofundin (20%) phantom, along with the κ computed using the DB = 6.93 × 10⁻¹⁰ cm2/s from the DCS measurement.
If we fit the uncorrected speckle contrast in the range from 1.5 cm to 1.7 cm we obtain a value of DB = 1.05 × 10⁻⁹ cm2/s which is one order of magnitude away from the measured value by DCS and indicates that the decay of this curve is not correct. On the other hand, the shot noise corrected data truncated at the point where SNR is too low as shown in Fig. 4(b) gives DB = 1.68 × 10⁻⁸ cm2/s which is in reasonable agreement with the DCS measured value of DB = (1.95 ± 0.05) × 10−8 cm2/s [10].
The same procedure described above was applied to characterize the glycerol phantom and the fitting results for this sample are presented in Fig. 4(c). The longer source-detector separation of 3.0 cm with good SNR in a sample with lower DB is expected since the speckle contrast decreases slower compared to a sample with higher DB. For the glycerol phantom, we have obtained DB = 5.31 × 10⁻¹⁰ cm2/s which is again in reasonable agreement with the DCS measured value of DB = (6.93 ± 0.39) × 10−10 cm2/s.
3.2. Re-emission geometry
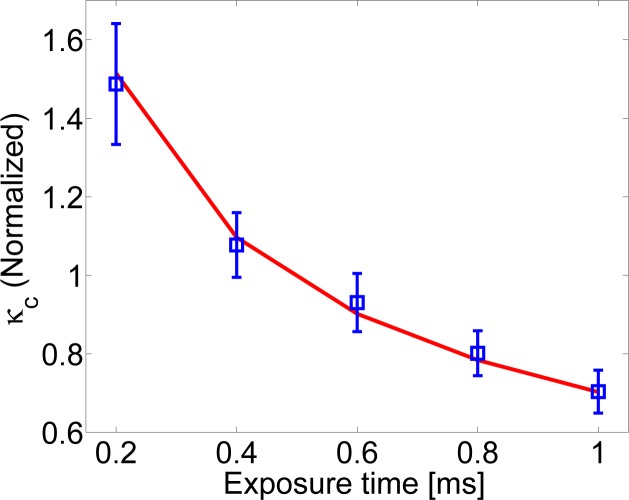
Temporal speckle contrast analysis was done for every pixel in the image over the 1000 frames. In the resulting image we have defined several detectors at different distances from the source. Each detector was 0.75 mm × 0.75 mm. They were positioned in a horizontal line from 5 mm to 20 mm from the source at steps of 2.5 mm. In Fig. 5, we show the corrected speckle contrast as a function of the camera exposure time and the DB obtained by fitting the theoretical model for the Lipofundin phantom at a detector located at 1.50 cm from the source. The obtained value was DB = 1.64 × 10⁻⁸ cm2/s which again, is in reasonable agreement with the values measured using DCS.
Fig. 5.
The normalized speckle contrast versus the exposure time at 1.5 cm from the source where DB = 1.64 × 10⁻⁸ cm2/s was obtained.
3.3. In vivo Experiments
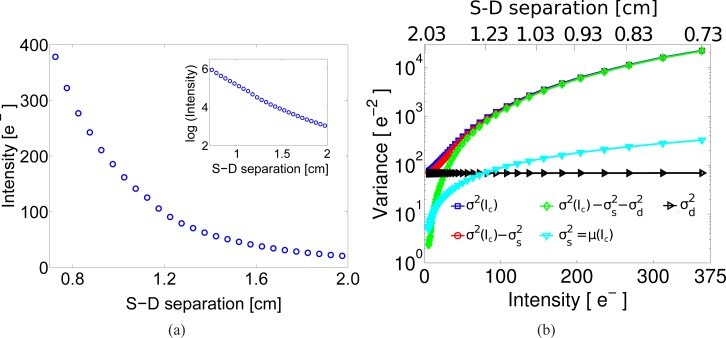
After showing that SCOS is able to measure DB with results comparable to those obtained with DCS in liquid phantoms, we present the results for the in vivo experiment shown in Fig. 3. In order to check how the light intensity decays from the point source, we have averaged the intensity over thousand dark subtracted images and assigned a distance to every pixel taking as origin the position of the point source. Then, to improve the SNR in the measurements, and to average out inhomogeneities, we have defined arc detectors around the source each with a width of 0.5 mm. At each arc, we have averaged all the pixels and assigned this intensity value to the mean distance between the inner and outer radii of the arc. This binned data is represented in Fig. 6(a) which shows the intensity decay from 0.7 to 2 cm for an exposure time of 1 ms. Here it is also observed that the sensor was not saturated at shorter distances from the source available in the image and that at 2 cm the intensity was still decaying as expected from the diffusion theory. This is confirmed in the inset of this figure where we present the logarithm of the intensity in the same distance range.
Fig. 6.
The in vivo data. (a) The decay of the intensity over source-detector separation (S-D separation) in electrons for the in vivo experiment. The inset shows the logarithm of the intensity. (b) Representation of the variance of the dark subtracted intensity (σ2(Ic)), the variance of the shot noise ( ), the shot variance corrected variance ( ), the dark variance ( ) and the dark and shot variance corrected variance ( ) used in the calculation of the corrected speckle contrast from in vivo experiment. All quantities are shown as a function of the measured intensity (in electrons, bottom axis) and the corresponding source-detector separation (top axis).
In order to demonstrate the correction procedure adopted for shot noise and the noises in dark images, Fig. 6(b) shows different quantities that are used in it: the variance of the mean dark subtracted intensity (σ2(Ic)); the variance of the shot noise ( ); the shot variance corrected variance ( ); the dark variance ( ); and the dark and shot variance corrected variance ( ). All quantities are shown as a function of the measured intensity (in electrons) and the corresponding source-detector separation. For this graph, all the variables were calculated with a sliding window to be comparable to all the speckle contrast calculations. The intersection of the shot noise variance and the dark variance define two regions at approximately 75e−, corresponding to a source-detector separation of approximately 1.3 cm. In other words, above 75e− the shot noise dominates the dark variance and the previously described shot noise variance correction is mostly sufficient [15]. On the other hand, for the region below 75e− where the dark variance noise dominates, the inclusion of dark variance correction is critical. These effects are particularly relevant for in vivo experiments where the SNR is low.
For this experiment, the speckle contrast was calculated in each image using a 5×5 sliding window and then a pixel based average was made using the acquired 1000 frames. Afterwards we binned the data as explained before for the intensity. The same procedure was applied for every acquired image sets under different exposure times. In Fig. 7(a) we present the raw, the shot noise corrected and the shot and dark variance corrected speckle contrast as a function of source-detector separation for 1 ms exposure time. This figure demonstrates the effect of the noise variance in the speckle contrast calculation at large source-detector separations, where the intensity is very low and the detector dark variance dominates the measurements. It can be seen that the shot noise correction alone is sufficient for correcting the raw speckle contrast only up to about 1.2 cm. On the other hand, the shot noise and the dark corrections together extend the usable range of the speckle contrast in order to apply a model fitting up to above 1.9 cm. This could also be seen in Fig. 6(b).
Fig. 7.
(a) The speckle contrast versus the source-detector separation with and without the two different corrections in the in vivo experiment. (b) The standard deviation of the speckle contrast measurement for different number of averaged images in the in vivo experiment.
In this experiment, we have used 1000 images for the calculation of the averaged speckle contrast but to demonstrate the utility of the fast frame rates, in Fig. 7(b) we present the calculation of the corrected speckle contrast when averaging 10, 100 and 1000 images with error bars representing the standard deviation of the speckle contrast at each distance. As expected, the SNR improves with increased averages and allows the extension of the fitting range. In fact, fast CCD, CMOS cameras allow the acquisition of hundreds of samples in seconds and with this technology advancing rapidly, this could be improved. The only condition in the acquisition is that the time between images should be larger than the speckle decorrelation time.
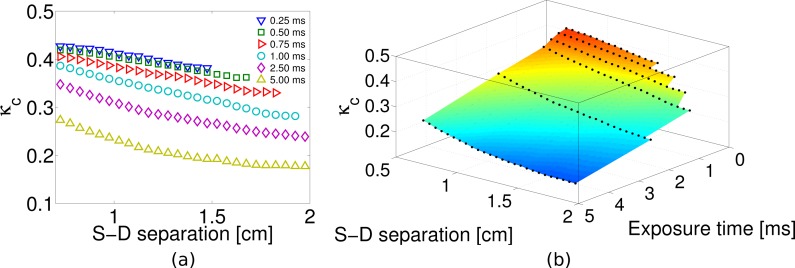
The images for all the other exposure times were analyzed following the same procedure described before to calculate the speckle contrast and binning the data for the data taken at 1 ms exposure time. The results are presented in Fig. 8(a), where the speckle contrast dependence with the distance is shown. It could be observed that for all exposure times, we have usable speckle contrast information up to 1.5 cm. Nevertheless, when the exposure time is increased, this distance is extended up to 2 cm for the largest exposure time which was 5 ms. An interesting way of presenting this data is shown in Fig. 8(b), where a surface plot shows the dependence of the speckle contrast on both the distance and the exposure time for this particular experiment. The parts of the surface that appear cropped represent the regions for which the speckle contrast is dominated by the dark noise of the detector.
Fig. 8.
(a) Speckle contrast over distance for all the exposure times available in the SCOS measurement on a forearm muscle. (b) Surface plot of the data plotted in (a).
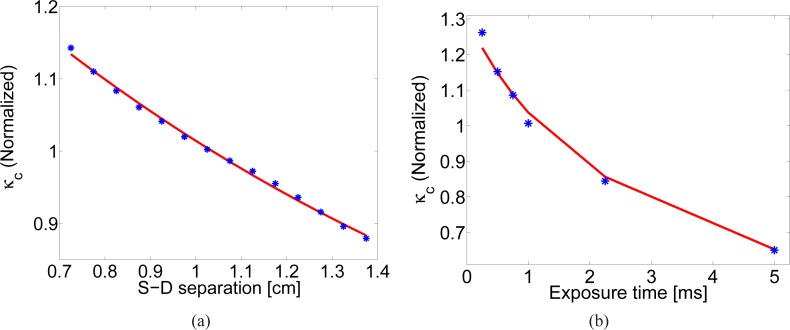
In Fig. 9(a) the dark corrected speckle contrast as a function of source-detector distance in a range between 0.7 and 1.4 cm at an exposure time of 1 ms is shown. αDB was fitted to be (4.14 ± 0.38) × 10−9 cm2/s. On the other hand, in Fig. 9(b) where the exposure time approach at a distance of 0.73 cm is used, αDB obtained was (2.44 ± 0.68) × 10−9 cm2/s. The corresponding DCS values were αDB = (4.05 ± 0.40) × 10−9 cm2/s at 0.73cm and αDB = (4.12 ± 0.25) × 10−9 cm2/s at 1.5cm. Both values obtained by SCOS are similar to the DCS results showing different fitting approaches are feasible.
Fig. 9.
(a) Speckle contrast over distance in a forearm muscle where αDB = (4.14 ± 0.38) × 10−9 cm2/s was obtained with an exposure time of 1 ms. (b) Speckle contrast versus exposure times at 0.73 cm from the source for the same experiment with αDB = (2.44 ± 0.68) × 10−9 cm2/s.
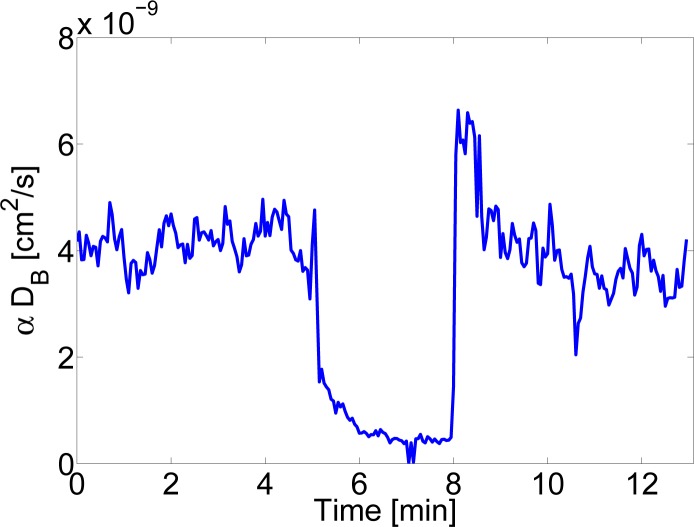
Finally, Fig. 10 shows the results before, during and after three minutes of arterial cuff occlusion of 180 mmHg. Multi-distance SCOS fitting as shown in Fig. 9(a) was utilized at each time point corresponding to a temporal resolution of 3 seconds per point. The results are in overall agreement with previous work with DCS [19].
Fig. 10.
αDB versus time using multi-distance SCOS as shown in Fig. 9(a) before, during and after arterial cuff-occlusion. The cuff was rapidly occluded at ∼ 5 minute to 180 mmHg and kept there for three minutes.
4. Discussion
We have presented speckle contrast optical spectroscopy (SCOS) as a method to non-invasively measure deep tissue blood flow. The method was proposed and demonstrated using a point source and acquiring simultaneously speckle measurements at multiple distances using 2D array of detectors like a CCD or CMOS camera and/or measuring speckles at different exposure times. Our results show that it is possible to model the dependence of the speckle contrast on the source-detector separation and the exposure time with a photon diffusion model. This model is fitted to the data and the information about the blood flow is obtained.
We have first demonstrated the theoretical behavior of the speckle contrast with respect to the source-detector separation as well as the exposure time using the diffuse propagation model given a point source illumination. Then, in order to validate the theoretical model, we have performed experiments in tissue mimicking liquid phantoms. All these experiments were validated by a direct comparison to DCS which is a well known deep tissue blood flow measurement [4–6]. Our results in transmission geometry for two samples with different viscosity demonstrated that SCOS can measure the Brownian, particle diffusion coefficient of the scatterers accurately. Furthermore, to demonstrate the utility of SCOS for a more easily accessible geometry, i.e. the re-emission geometry one liquid phantom was measured in a way to study both the source-detector separation and exposure time dependence of the measurements and we have obtained comparable results between both approaches. Finally, having validated SCOS in tissue mimicking phantoms, in both transmission and re-emission geometries, we have extended it to non-contact in vivo measurement of blood flow in the forearm muscle.
Overall, we assert that our results show that SCOS allows deep tissue blood flow measurements with comparable results to those obtained by DCS but the fact that SCOS uses fairly standard CCD/CMOS cameras, makes it a relatively low cost, fast method.
To put SCOS in a better context, we now compare it to the state-of-the art in related techniques; laser speckle flowmetry (LSF), laser Doppler flowmetry (LDF) and diffuse correlation spectroscopy (DCS).
LSF uses the speckle contrast as a wide-field imaging method that uses a uniform illumination of the whole field-of-view and provides relatively fast mapping of blood flow with tens of micrometer spatial axial resolution with none or limited (∼4 mm, using structured illumination) [20] depth resolution. It has been shown that, by employing LSF in transmission geometry, it is possible to sample deeper layers of the tissue (10–15 mm) but without quantification or depth resolution [21]. In contrast to the traditional full field illumination, doing a line beam scanning illumination improves the sampling depth of blood flow imaging [22] while doing laser speckle contrast imaging with point source illumination modulated in frequency over the exposure time allows the determination of the scattering properties of a static turbid medium [23].
As was mentioned earlier, we note that SCOS is a more general and quantitative method compared to similar speckle contrast point source measurements proposed previously [8,9] due to the fact that it is a model based measurement. In these works, the authors introduced the proper model to relate the speckle contrast to the dynamics of the scatterers but they did not extract the dynamic parameters information directly from the speckle contrast measurement for a single source-detector separation and a single exposure time. They kept their measurements in a range in which the dynamic parameters and the speckle contrast are linearly related and considered the inverse of the speckle contrast as an index of blood flow. In this work, we show how to use the dependence of the speckle contrast on the source-detector separation and/or the exposure time to do a model based, quantitative fitting as well as how to account for the systematic problems due to noise.
Laser Doppler flowmetry (LDF) is, in general, a point-by-point measurement using point-sources. Wide-field variants of LDF have been proposed in the past by utilizing two dimensional (2D) detectors [24] which is comparable to LSF in speed but requires a very high frame rate camera [25], although some variants including heterodyne optical-mixing detection allow the use of 8Hz CCD cameras [26]. LDF can be performed using large (1.5 cm) source-detector separations in order to analyze large tissue volumes but, in this approach, the main limitation of the LDF method is that the modeling and data acquisition becomes intractable with increased distance, leading itself to the time-domain methods such as DCS [27].
Diffuse correlation spectroscopy (DCS) is a diffuse optical method which probes deep tissues up to several centimeters using point-sources and detectors placed several centimeters away [4–6]. A common issue with DCS is the low signal-to-noise ratio (SNR) which is due to the need to sample each speckle independently using single-mode or few-mode fibers with small collection areas [6]. This implies that very few (order of 10,000) photons/second are detected by each (expensive) detector. For a given averaging time, the path for improved SNR is to use a collection of multiple detectors sampling several independent speckles simultaneously [28], i.e., ideally an array of fast single photon detectors. However, to achieve breakthrough improvements in SNR is prohibitively expensive and complex with the current technologies since the SNR increases with the square-root of the number of speckles.
SCOS is analogous to all three methods in being sensitive to the motion of the scatterers, i.e. red blood cells, in tissues. It is able to exploit the relatively inexpensive detectors with high frame rates that LSF can utilize with the multiple scattering, i.e. deep tissue, sensitivity of DCS. These detectors allow the potential of improved SNR by averaging thousands of speckles in space and/or time. As our previous paper has demonstrated, this also allows for a tomographic approach [10] and this work paves the way towards its in vivo application.
In our SCOS experiments, we have established the importance of accounting for the contributions of both the shot noise and the sensor noise to the speckle contrast. In Fig. 4(a) we have shown that it is crucial to correct for the shot noise contribution in order to get an accurate measurement of blood flow. Then, as seen in Fig. 7(a) we have shown that it is further important to correct for the dark variance at large detection distances when working at lower light levels. These corrections are not critical in traditional LSF measurements because the intensity over all the images is homogeneous and, usually, when working with different exposure times, the intensity at the detector is set to be constant for all of them to keep the shot noise constant over all the experiment [11].
Several aspects of SCOS require further research and improvement. We now discuss some important effects and suggest potential solutions.
For example, there are other sources of noise from both CCD and CMOS cameras whose variance may cause systematic errors. This is evident in the in vivo experiment in re-emission geometry where even after including the noise corrections, we are not able utilize the whole range where the intensity continues to decay according to the photon diffusion level. In other words, the SNR of the intensity is greater than one but there are sources of variance that dominate the speckle contrast. A further characterization of the camera technologies and the consideration of different technologies such as single-photon counting avalanche photo detector arrays may allow us to overcome this limitation. Nevertheless, our results show that we can work at source-detector separations up to ≈2 cm at the current state of SCOS which is relevant for numerous applications ranging from small animal measurements to adult humans.
We note that Eq. (1) is an integral over the correlation delay times over the field autocorrelation function. Therefore, in general, SCOS does not retain the fine-details that DCS measurements which are contained in the complete shape of the auto-correlation curve. This is not expected to be very important for in vivo experiments of relatively homogeneous tissues but may be relevant in multi-layered tissues with large differences between the blood flow in different layers. This could be partially accounted for by doing tomography, i.e. by SCOT. This also implies a potential issue with volumes of high blood flow which is also limitation for DCS in exceptional cases. Finally, the same integral may imply a loss of sensitivity to very small changes in blood flow when using larger exposure times that are comparable to the correlation decay time. To overcome this, the exposure time could be further reduced but this has implications in SNR. These effects should carefully be characterized in the future.
In all the measurements presented in this work, we have matched the speckle size to pixel size, but perhaps, according to some references [29, 30] the results could be improved by increasing the speckle to pixel size ratio. This is readily possible by controlling the aperture of the camera lenses but we have chosen to stick to the simpler, more generally utilized approach to demonstrate the feasibility of SCOS.
Finally, since SCOS is a non-contact measurement, it relies on the correct calibration of the source-detector distance with a source that is often out of the field-of-view which is a challenge for in vivo measurements on curved surfaces. Motion and surface artifacts also affect the measurements. These could be dealt with by building better interfaces with appropriate windows and/or by using fiber-coupled cameras as was suggested previously [9].
5. Conclusions
In summary, we have proposed and demonstrated speckle contrast optical spectroscopy, SCOS, as a diffuse optical method to non-invasively measured the deep tissue blood flow using fairly standard CCD/CMOS cameras. The method was demonstrated in both transmission and re-emission geometries using both spatial and temporal speckle contrast analysis in liquid tissue mimicking phantoms. Afterwards, the feasibility of SCOS in in vivo experiments was presented using both dependences of the speckle contrast in the source-detector separation and the exposure time. The wide-field acquisition with thousands of speckles in a small region would allow us to average results from many speckles to improve the SNR of speckle based blood flow measurements as well as high density tomographic measurements.
Acknowledgments
The project was funded by Fundació Cellex Barcelona, Ministerio de Economía y Competitividad (PHOTOSTROKE), Institució CERCA (DOCNEURO, PROVAT-002-11), Laserlab III (BIOPTHICAL), European Regional Development Fund, Generalitat de Catalunya and National Institutes of Health (NIH) grant R01-NS078223 (J.P.C). C.P.V. acknowledges Erasmus Mundus Joint Doctorate program Europhotonics grant No. 159224-1-2009-1-FR. The Orca-Flash4 camera was provided courtesy of Hamamatsu Spain. We acknowledge the Super-resolution Light Microscopy and Nanoscopy facility at ICFO for their support for the in vivo experiments.
References and links
- 1.Devor A., Sakadžić S., Srinivasan V. J., Yaseen M. A., Nizar K., Saisan P. A., Tian P., Dale A. M., Vinogradov S. A., Franceschini M. A., Boas D. A., “Frontiers in optical imaging of cerebral blood flow and metabolism,” J. Cerebr. Blood F. Met. 32, 1259–1276 (2012). 10.1038/jcbfm.2011.195 [DOI] [PMC free article] [PubMed] [Google Scholar]
- 2.Leahy M. J., Enfield J. G., Clancy N. T., Doherty J. O., McNamara P., Nilsson G. E., “Biophotonic methods in microcirculation imaging,” Med. Las. App. 22, 105–126 (2007). 10.1016/j.mla.2007.06.003 [DOI] [Google Scholar]
- 3.Briers J., “Laser speckle contrast imaging for measuring blood flow,” Opt. Appl. 37, 139–152 (2007). [Google Scholar]
- 4.Boas D. A., Campbell L. E., Yodh A. G., “Scattering and Imaging with Diffusing Temporal Field Correlations,” Phys. Rev. Lett. 75, 1855–1858 (1995). 10.1103/PhysRevLett.75.1855 [DOI] [PubMed] [Google Scholar]
- 5.Boas D., Yodh A., “Spatially varying dynamical properties of turbid media probed with diffusing temporal light correlation,” J. Opt. Soc. Am. A 14, 192–215 (1997). 10.1364/JOSAA.14.000192 [DOI] [Google Scholar]
- 6.Durduran T., Choe R., Baker W., Yodh A. G., “Diffuse Optics for tissue monitoring and tomography,” Rep. Prog. Phys. 73, 076701 (2010). 10.1088/0034-4885/73/7/076701 [DOI] [PMC free article] [PubMed] [Google Scholar]
- 7.Boas D. A., Dunn A. K., “Laser speckle contrast imaging in biomedical optics,” J. Biomed. Opt. 15, 011109 (2010). 10.1117/1.3285504 [DOI] [PMC free article] [PubMed] [Google Scholar]
- 8.Bi R., Dong J., Lee K., “Deep tissue flowmetry based on diffuse speckle contrast analysis,” Opt. Lett. 38, 1401–1403 (2013). 10.1364/OL.38.001401 [DOI] [PubMed] [Google Scholar]
- 9.Bi R., Dong J., Lee K., “Multi-channel deep tissue flowmetry based on temporal diffuse speckle contrast analysis,” Opt. Express 21, 22854–22861 (2013). 10.1364/OE.21.022854 [DOI] [PubMed] [Google Scholar]
- 10.Varma H. M., Valdes C. P., Kristoffersen A. K., Culver J. P., Durduran T., “Speckle contrast optical tomography: A new method for deep tissue three-dimensional tomography of blood flow,” Biomed. Opt. Express 5, 1275–1289 (2014). 10.1364/BOE.5.001275 [DOI] [PMC free article] [PubMed] [Google Scholar]
- 11.Parthasarathy A. B., Tom W. J., Gopal A., Zhang X., Dunn A. K., “Robust flow measurement with multi-exposure speckle imaging,” Opt. Express 16, 1975–1989 (2008). 10.1364/OE.16.001975 [DOI] [PubMed] [Google Scholar]
- 12.Bandyopadhyay R., Gittings A., Suh S., Dixon P., Durian D., “Speckle-visibility spectroscopy: A tool to study time-varying dynamics,” Rev. Sci. Instrum. 76, 093110 (2005). 10.1063/1.2037987 [DOI] [Google Scholar]
- 13.Contini D., Martelli F., Zaccanti G., “Photon migration through a turbid slab described by a model based on diffusion approximation. I. Theory,” Appl. Opt. 36, 4587–4599 (1997). 10.1364/AO.36.004587 [DOI] [PubMed] [Google Scholar]
- 14.Haskell R. C., Svaasand L. O., Tsay T.-T., Feng T.-C., Tromberg B. J., McAdams M. S., “Boundary conditions for the diffusion equation in radiative transfer,” J. Opt. Soc. Am. A 11, 2727–2741 (1994). 10.1364/JOSAA.11.002727 [DOI] [PubMed] [Google Scholar]
- 15.Yuan S., “Sensitivity, noise and quantitative model of laser speckle contrast imaging,” Ph.D. thesis, Tufts University; (2008). [Google Scholar]
- 16.Cheung C., Culver J. P., Takahashi K., Greenberg J. H., Yodh A., “In vivo cerebrovascular measurement combining diffuse near-infrared absorption and correlation spectroscopies,” Phys. Med. Biol. 46, 2053–2065 (2001). 10.1088/0031-9155/46/8/302 [DOI] [PubMed] [Google Scholar]
- 17.Boas D. A., “Diffuse Photon Probes of Structural and Dynamical Properties of Turbid Media: Theory and Biomedical Applications,” Ph.D. thesis, University of Pennsylvania; (1996). [Google Scholar]
- 18.Japan Hamamatsu, ORCA-R2 Technical Note (2008).
- 19.Yu G., Durduran T., Lech G., Zhou C., Chance B., Mohler E. R., Yodh A. G., “Time-dependent blood flow and oxygenation in human skeletal muscles measured with noninvasive near-infrared diffuse optical spectroscopies,” J. Biomed. Opt. 10, 024027 (2005). 10.1117/1.1884603 [DOI] [PubMed] [Google Scholar]
- 20.Mazhar A., Cuccia D. J., Rice T. B., Carp S. A., Durkin A. J., Boas D. A., Choi B., Tromberg B. J., “Laser speckle imaging in the spatial frequency domain,” Biomed. Opt. Express 2, 1553–1563 (2011). 10.1364/BOE.2.001553 [DOI] [PMC free article] [PubMed] [Google Scholar]
- 21.Dunn J., Forrester K., Martin L., Tulip J., Bray R., “A transmissive laser speckle imaging technique for measuring deep tissue blood flow: an example application in finger joints,” Laser Surg. Med. 43, 21–28 (2011). 10.1002/lsm.21018 [DOI] [PubMed] [Google Scholar]
- 22.He H., Tang Y., Zhou F., Wang J., Luo Q., Li P., “Lateral laser speckle contrast analysis combined with line beam scanning illumination to improve the sampling depth of blood flow imaging,” Opt. Lett. 37, 3774–3776 (2012). 10.1364/OL.37.003774 [DOI] [PubMed] [Google Scholar]
- 23.McKinney J., Webster M., Webb K., Weiner A., “Characterization and imaging in optically scattering media by use of laser speckle and a variable-coherence source,” Opt. Lett. 25, 4–6 (2000). 10.1364/OL.25.000004 [DOI] [PubMed] [Google Scholar]
- 24.Draijer M. J., Hondebrink E., van Leeuwen T. G., Steenbergen W., “Connecting laser Doppler perfusion imaging and laser speckle contrast analysis,” in “Biomedical Optics (BiOS) 2008,” (International Society for Optics and Photonics, 2008), p. 68630C [Google Scholar]
- 25.Rajan V., Varghese B., van Leeuwen T. G., Steenbergen W., “Review of methodological developments in laser Doppler flowmetry,” Laser Med. Sci. 24, 269–283 (2009). 10.1007/s10103-007-0524-0 [DOI] [PubMed] [Google Scholar]
- 26.Atlan M., Gross M., Forget B. C., Vitalis T., Rancillac A., Dunn A. K., “Frequency-domain wide-field laser Doppler in vivo imaging,” Opt. Lett. 31, 2762–2764 (2006). 10.1364/OL.31.002762 [DOI] [PubMed] [Google Scholar]
- 27.Binzoni T., Leung T., Boggett D., Delpy D., “Non-invasive laser Doppler perfusion measurements of large tissue volumes and human skeletal muscle blood RMS velocity,” Phys. Med. Biol. 48, 2527–2549 (2003). 10.1088/0031-9155/48/15/318 [DOI] [PubMed] [Google Scholar]
- 28.Dietsche G., Ninck M., Ortolf C., Li J., Jaillon F., Gisler T., “Fiber-based multispeckle detection for time-resolved diffusing-wave spectroscopy: characterization and application to blood flow detection in deep tissue,” Appl. Opt. 46, 8506–8514 (2007). 10.1364/AO.46.008506 [DOI] [PubMed] [Google Scholar]
- 29.Kirkpatrick S. J., Duncan D. D., Wells-Gray E. M., “Detrimental effects of speckle-pixel size matching in laser speckle contrast imaging,” Opt. Lett. 33, 2886–2888 (2008). 10.1364/OL.33.002886 [DOI] [PubMed] [Google Scholar]
- 30.Ramirez-San-Juan J., Ramos-Garcia R., Martinez-Niconoff G., Choi B., “Simple correction factor for laser speckle imaging of flow dynamics,” Opt. Lett. 39, 678–681 (2014). 10.1364/OL.39.000678 [DOI] [PMC free article] [PubMed] [Google Scholar]


