Abstract
Speckle variance optical coherence angiography (OCA) was used to characterize the vascular tissue response from craniotomy, window implantation, and electrode insertion in mouse motor cortex. We observed initial vasodilation ~40% greater than original diameter 2-3 days post-surgery (dps). After 4 weeks, dilation subsided in large vessels (>50 µm diameter) but persisted in smaller vessels (25-50 µm diameter). Neovascularization began 8-12 dps and vessel migration continued throughout the study. Vasodilation and neovascularization were primarily associated with craniotomy and window implantation rather than electrode insertion. Initial evidence of capillary re-mapping in the region surrounding the implanted electrode was manifest in OCA image dissimilarity. Further investigation, including higher resolution imaging, is required to validate the finding. Spontaneous lesions also occurred in many electrode animals, though the inception point appeared random and not directly associated with electrode insertion. OCA allows high resolution, label-free in vivo visualization of neurovascular tissue, which may help determine any biological contribution to chronic electrode signal degradation. Vascular and flow-based biomarkers can aid development of novel neural prostheses.
OCIS codes: (110.4500) Optical coherence tomography, (170.3880) Medical and biological imaging, (170.1470) Blood or tissue constituent monitoring, (170.6900) Three-dimensional microscopy
1. Introduction
Optical coherence angiography (OCA) is an extension of optical coherence tomography (OCT) used to visualize vasculature and detect blood flow in tissue [1–3]. It works by sensing temporal variations in intensity or phase, which are primarily associated with moving blood. In order to resolve vessels, it is necessary to match the pixel sampling time interval to the blood flow rates of the vessels imaged. For low flow velocities in capillaries (~1-10 mm/s), millisecond time intervals are required, and calculation of speckle or phase variance across adjacent B-scans is the customary method used to achieve this requirement [4]. However, the spectrum of tissue motion, particularly for ophthalmic applications, sets an upper bound on the time interval of a few tens of milliseconds. A range of B-scan intervals can be achieved, within the constraints of the hardware (i.e., camera line rates), by adjusting the lateral pixel sampling density. Schemes such as scan back-stitching have also been demonstrated to attain variable B-scan intervals [5]. A high lateral pixel density, along with millisecond B-scan flow-matched time intervals necessitate high-speed optical coherence microscopy (OCM) imaging (line rate of ~100 kHz) in order to resolve the smallest capillaries in tissue.
Both speckle- (or reflectance-) and phase-based angiography techniques have been demonstrated for neural imaging in the spectral domain OCT (SD-OCT) era [1, 3, 6–11]. The majority of these studies involved acute preparations and described new processing algorithms. However, recent interest has grown for use of OCA in applications that require longer-term preparations, such as brain trauma and ischemic stroke [12, 13].
Another application where longitudinal preparations are required is in the study of implanted neural electrodes. Recent advances have been made in the development of neuroprosthetic systems, where electrode arrays are inserted in the motor cortex to actively control a prosthetic limb [14]. However, current neural recording electrode technology is not reliable for long-term use, and a brief device lifetime ultimately limits usefulness to potential patients [15–18]. The cause of chronic electrode degradation is thought to arise either from a neuroinflammatory response or from biomaterial failure [19–22]. Cortical vessels can undergo extensive re-modeling in response to injury, as demonstrated in studies of stroke and traumatic brain injury [23–25]. Change to the vascular around an implanted electrode has the potential to be an early indicator or biomarker of signal degradation.
Longitudinal preparations to examine small animal cortical tissue with optical imaging techniques such as OCA or two-photon microscopy involve a thinned skull, window implantation, or a hybrid preparation [26–28]. The immediate aim of these preparations is to render the skull optically transparent, so that underlying neurovascular tissue can be imaged. Thinned skull and hybrid preparations, which involve thinning but not complete removal of a portion of the parietal bone with a blade or dental burr, exhibit bone re-growth after a few weeks. Conversely, the window preparation, which involves complete bone removal, is known to evoke an inflammatory response, but presumably will remain transparent for a longer duration.
For investigation of a tissue response to longitudinal electrode implantation, a stable preparation on time scales similar to that seen for in vivo degradation is required to fully characterize the response (i.e., longer than 6 months). For this reason, we chose a window preparation to investigate vascular remapping associated with electrode implants. The goals of this study are to quantify baseline changes in vasculature from the window preparation and to differentiate these from any response associated with electrode implantation. Our overall aim is to test the hypothesis that vasculature re-mapping and flow changes accompany a long-term decrease in electrode electrophysiological signals in neuroprosthetic systems.
2. Materials and methods
2.1 Optical setup
A custom-built SD-OCT system was used in the study and is shown in Fig. 1(a). A spectrometer (Wasatch Inc.), designed to match the source (Exalos Inc.) center wavelength (1315 nm) and bandwidth (85 nm FWHM) was used. The theoretical axial resolution in air is 9 µm. The spectrometer uses a high-speed InGaAs camera (Sensors Unlimited Inc.) with 2048 pixels and a maximum line rate of 76 kHz. The system was designed to have a spectral resolution of ~0.05 nm. The depth roll-off achieved by the spectrometer is 1.8 dB/mm from 0 to 2.5 mm and 3.4 dB/mm from 0 to 5 mm. The scan lens (ThorLabs Inc.) had a magnification of 5 × and was chosen to have a moderate depth-of-focus for sectioning the cortical volume with implanted electrode in a limited number of depth steps without focus tracking. The lateral resolution measured with a nanoparticle-embedded point spread function (PSF) phantom was ~9 µm (FWHM). The depth-of-focus was estimated to be ~100 µm. Dispersion from the scan lens was matched in the reference arm with a glass cube (ThorLabs Inc.).
Fig. 1.

(a) SD-OCT setup for mouse cortical angiography and (b) photograph showing window preparation (black arrowhead) with implanted electrode (white arrow).
The experimental animal preparation, including cortical window insertion, electrode implantation, and head-bar attachment, is shown in Fig. 1(b) and described further in §2.3. Care was taken to place the window flat with respect to the motor cortex during surgery to avoid focal shifts as a function of depth beneath the window and to obviate use of goniometer (roll-pitch) stages. The animal was positioned on a motorized three-axis translation stage (ThorLabs Inc.) during imaging for collection of montages.
2.2 Image acquisition and processing
Reflectance (i.e., speckle)-based OCA requires collection of at least two consecutive B-scans at each lateral position [1]. The speckle variance of pixels from the same physical location but separated by the B-scan interval records dynamic changes from blood flow. B-scan intervals in the low millisecond range are generally chosen to capture low capillary flow without perturbation from other sources of motion. Thus a trade-off exists between lateral pixel density and B-scan interval. That is, longer B-scan intervals susceptible to motion are required for higher pixel sampling across the volume. This trade-off is somewhat averted in this study by acquisition of 2 × 2 volumetric montages (1000 × 1000 × 1024 pixels) using the three-axis animal stage. The individual raster scans used in the montage were 500 × 500 pixels (excluding galvanometer fly-back time) and acquired at 134 B-scans/s with a B-scan interval of ~7.5 ms.
All image processing from the raw linear detector output to generation of the OCT reflectance and angiography images was executed in real-time on the graphical processing unit (GPU) of the system computer’s video card using custom CUDA software (CUDA = Compute Unified Device Architecture). It took 3 ms to process a single B-scan reflectance image (500 × 500 pixels) and 7 ms to process a reflectance/angiography pair using 2 adjacent B-scans on a NVIDIA GeForce GTX-760 video card with 1152 CUDA cores. High-speed processing enabled real-time display of the en-face OCA image, which aided in confirmation of correct axial focus position.
Prior to angiography processing, the raw data was processed with the customary OCT processing chain [29], which includes background subtraction, λ- to k-space re-sampling (using linear or spline interpolation), fast Fourier transformation, and logarithmic scaling. Software dispersion compensation was also available but not applied to this data set because dispersion was compensated optically in the reference arm with the matched cube.
Speckle-based angiography processing at its core involves calculating the variance pixel-by-pixel across consecutive B-scans, which is equivalent to low-pass filtering in the spatial (speckle)-domain. Use of standard deviation rather than variance applies a power scaling (i.e., power of 0.5), and is equivalent to calculation of the absolute difference when only 2 B-scans are used [1]. The choice of number of B-scans involves a trade-off between static signal suppression, where use of a higher number of B-scans is desirable, and scan duration and motion noise, which are minimized with use of a lower number of B-scans. In this paper, we used two adjacent B-scans in our speckle processing algorithm.
All acquired images in a raster scan were saved directly to memory without dropping frames, and then transferred to disk with further processing including x-y lateral flattening (i.e., B-scan flattening and stack co-alignment using a cross-correlation technique on the OCT intensity image) and cropping. In this way, disk space consumed by saving processed videos was a fraction of the space needed for raw binary data.
The resultant angiography volumes were stitched manually after three-dimensional shifting and vascular metrics (e.g., vessel diameter, vessel coverage) calculated using custom software written in LabVIEW (described in §2.4). The final angiography montage data cube was summed over en-face planes 100 µm in depth (25 pixels) up to 500 µm using either average or maximum projections. Angiography images over multiple days were registered with StackReg in ImageJ (Fiji).
For each imaging session, montages from two depth locations of the 2 × 2 mm cortical window implanted in the mouse were collected. The focus for the first depth was set just beneath the window to capture capillary growth and vessel dilation in the superficial layers associated with window surgery. The focus for the second depth was set 250 µm below the first depth, to capture vascular changes associated with electrode implantation. Figure 2 shows representative depth planes from the two focus depths and the accompanying video (Media 1 (32.6MB, MOV) ) is an en-face fly-through of the entire OCA volumes.
Fig. 2.
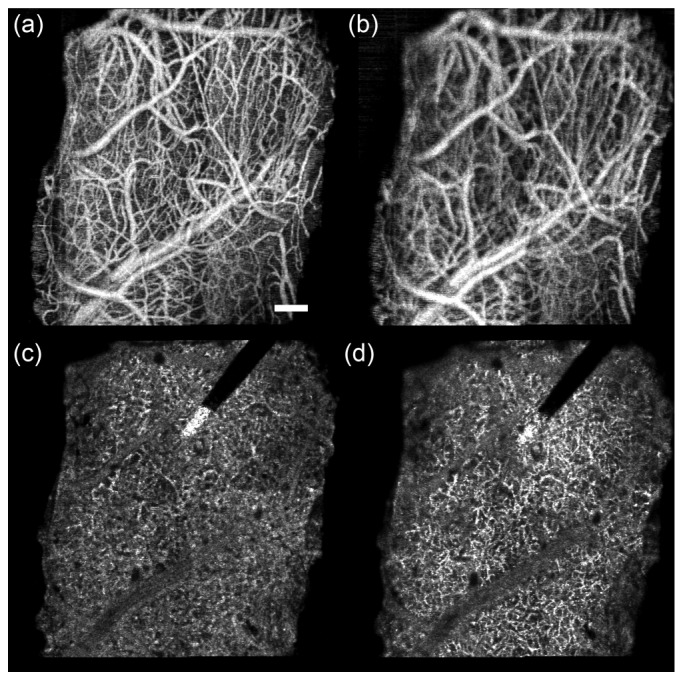
Representative depth planes from OCA volumes for electrode animal W41 (day 19). (a,c) Focus depth 1. (b,d) Focus depth 2 (250 µm below focus depth 1). (a,b) Average projection for superficial plane spanning 0-100 µm below window. (c,d) Maximum projection for deep plane spanning 300-400 µm below window. Accompanying video (Media 1 (32.6MB, MOV) ) has side-by-side fly-through from 0 to 800 µm for both focus conditions. Each frame of the video is a running average projection of 8 depth slices (32 µm). Scale bar = 200 µm.
2.3 Animal window surgery and preparation
A protocol was approved for all animal use in this study by the FDA White Oak Institutional Animal Care and Use Committee. Adult (>12 weeks old), male, wild-type (C57BL/6J) and transgenic (Thy1-EYFP, H line, Jackson Laboratories) mice weighing 25-30 g were used. During surgical procedures, anesthesia was induced with isoflurane (4%) and maintained with a combination of isoflurane (1%) and xylazine (13.3 mg/kg, i.p.). The animal was positioned in a stereotaxic frame, the skin and connective tissue were removed, and the skull cleaned. Body temperature was maintained with a feed-back controlled heating pad (CWE Inc.) and eyes were covered with ophthalmic ointment. A 2 × 2 mm craniotomy, positioned over the mouse primary motor cortex, was made using a high speed dental drill and surgical forceps. Care was taken to prevent vascular damage during drilling and bone removal. A 16-channel silicon shank-style linear microelectrode array (Neuronexus Inc.) held with a micromanipulator was inserted into the cortex at an oblique angle to the cortical surface (~35°), avoiding disruption of major surface vasculature. A small cover glass window was positioned over the craniotomy and secured with C&B Metabond dental cement (Parkell Inc.). Kwik-Sil (WPI Inc.) was used to fill in any gap between cranial window and skull prior to dental cement application. A custom machined metal head-bar was glued onto the contralateral skull surface to minimize motion artifact during imaging. A photograph of the preparation with window, implanted electrode, and head-bar is shown in Fig. 1(b). Immediately following surgery, the mouse received 0.3 mL of Ringer’s solution, analgesic (meloxicam, 2 mg/kg, i.p.) and antibiotic (gentamicin, 8 mg/kg, s.c.).
Mice were separated into a control group without electrode (n = 4) and an experimental group with electrode (n = 6). OCA images were collected out to 22 weeks for the control animals and 15 weeks for the electrode animals. During imaging, mice were anesthetized with isoflurane (4% induction, 1.5% maintenance) and their body temperature was maintained with a heating pad. Mice with the window surgery were designated with ‘W’ and a number.
2.4 Analysis
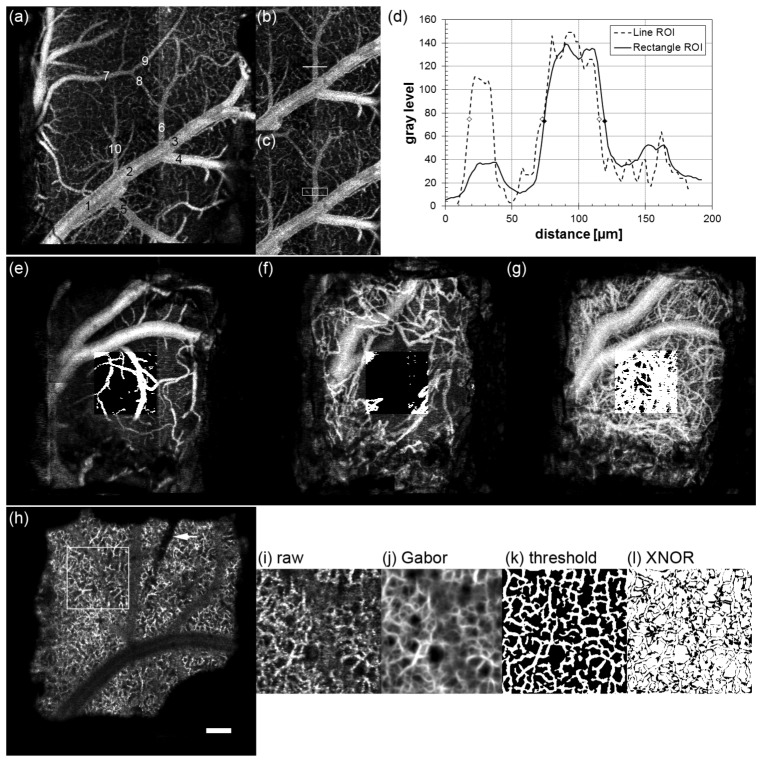
Custom analysis software was written to quantify cortical vascular dynamics [Fig. 3] in a region-of-interest (ROI) in the 2 × 2 mm window. We gathered metrics for: (a) acute vasodilation in the second plane (100-200 µm below window), (b) longer-term neovascularization and vessel migration in the first plane (0-100 µm below window), and (c) capillary remapping in the fourth plane (300-400 µm below window). Custom analysis algorithms were written for each of these metrics as described in the following paragraphs. The results are detailed in §3.1-3.3.
Fig. 3.
Illustrated methodology to quantify cortical vascular dynamics, including vasodilation (a-d), vessel growth (e-g), and capillary remapping (h-l). (a) OCA image plane 100-200 µm for control animal W44 indicating 10 profile locations. (b,c) Line and rectangle ROIs for location 6. (d) Single (dashed line) and 30-line average (solid line) profiles across location 6. Symbols indicate FWHM values. OCA image plane 0-100 µm for control animal W38 for 1 (e), 8 (f) and 27 (g) dps. Thresholded ROI is overlaid on each image. (h) OCA image plane 300-400 µm for electrode animal W51 on 1 dps. ROI is indicated as well as electrode location (arrow). Similarity processing: (i) ROI (day 26), (j) Gabor filtered image, (k) local thresholded image, and (l) XNOR image between day 26 and day 34. Scale bar = 200 µm.
For superficial vasodilation, the vessel diameter (FWHM) was measured by creating average intensity profiles of 30 lines perpendicular to each vessel of each OCA image in the registered stack. The second plane (100-200 µm) was chosen to avoid artifacts from vessel growth, but also because this plane corresponded to the center of the medium and large vessels examined in the analysis. Ten locations across the image, half from large vessels >50 µm in diameter and half from medium size vessels in the range 25-50 µm diameter were selected for each animal [Fig. 3(a)]. Only one location on the same vessel between branch points was chosen. Averaging over a region of the vessel as shown in Figs. 3(b) and 3(c) resulted in smoother profiles without artifacts from adjacent capillaries [Fig. 3(d)]. The profiling software processed the stack in a semi-automated manner – the location was manually chosen and the diameter was checked and corrected to remove artifacts.
Superficial vessel density and growth in the first plane (0-100 µm) was quantified by measurement of fractional vessel area (% vessels/ROI area). After stack registration, the fractional area of each OCA image was calculated using contrast enhancement, thresholding (for vessel segmentation), and particle filtering (for noise removal). A fixed threshold level and particle filter size were used for all identically scaled data. A 500 × 500-µm sampled region was manually selected as close to the center of the window as possible, while avoiding the largest vessel beneath the window in order to capture capillary growth and remodeling, and also to exclude any image artifacts (motion noise, etc.). Figures 3(e)-3(f) show vessel growth in control animal W38 on 1, 8, and 27 dps with thresholded ROI overlay.
In order to quantify potential vascular remodeling associated with an implanted electrode, software was written to capture longitudinal changes in the deeper capillary network [Fig. 3(h)]. A metric, called the similarity index, was devised to measure changes between successive OCA images in the stack (separated by 1 week) in the maximum projection plane at a depth closest to the electrode tip (300-400 µm below the window). Similarity was measured with an algorithm that consisted of ROI registration (in addition to stack registration), Gabor filtering, local thresholding, and an exclusive-nor (XNOR) operation on every pixel of successive OCA images. Because motion or misalignment of planes across weeks can be a large source of dissimilarity, the stacks were registered twice: once using the entire plane (2 × 2 mm), and a second time on a local ROI slightly larger than the 500 × 500-µm sampled region eventually selected adjacent to the electrode.
A Gabor filter is a two-dimensional Gaussian filter convolved with a sinusoid. It allows directional smoothing and was first proposed for use in vision science [30]. Recently, Hendargo et al. used it to smooth the retinal capillary network in speckle variance images [2]. By varying the filter kernel (k) and the sinusoidal angle (θ), vessels of varying size and orientation can be smoothed. The Gabor filter applied to each OCA image plane, f(x,y), was:
| (1) |
| (2) |
| (3) |
| (4) |
where λ is the filter wavelength (spatial frequency parameter), σ is standard deviation of the Gaussian, and the phase and aspect ratio (often used in Gabor filters but not shown in the equation above) are set to 0 and 1, respectively. The Gabor filter is applied over a full range of angles (0-π radians) and kernels heuristically determined to provide appropriate smoothing for our OCA data sets.
A local adaptive thresholding method, using a Niblack algorithm, was chosen to delineate vessels in the presence of large background fluctuation. The threshold used a 16 × 16 pixel window and 0.2 Niblack deviation factor. Finally, XNOR was performed between adjacent frames separated by one week to capture weekly pixel differences. Pixels in the final XNOR image were summed and divided by the total pixels. A similarity index of 1 means the images were identical, a similarity index of 0.5 means the images were completely dissimilar. Two images with randomly-generated noise processed through the algorithm resulted in a similarity index of 0.5. Figures 3(i)-3(l) show similarity processing for electrode animal W51 approximately one month after window surgery.
3. Results
3.1 Initial vasodilation
We observed dilation in the vessels below the window in the days after window surgery. Figure 4 shows a set of images from the 100-200 µm plane – where the analysis was performed – from one electrode animal where vasodilation was particularly stark. The accompanying video is a time-lapsed registered OCA stack for electrode animal W43 up to 98 dps (Media 2 (2.2MB, MOV) ).
Fig. 4.
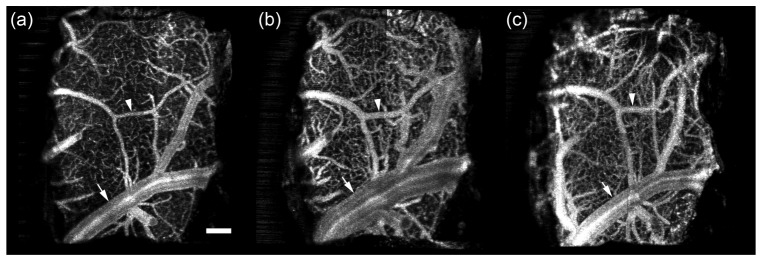
Example of vasodilation in electrode animal W43. Shown is the 100-200 µm plane on (a) 1, (b) 3, and (c) 56 dps. Arrow indicates large vessel with massive dilation on day 3 that subsides by day 56. Arrowhead indicates medium vessel with dilation on day 3 that persists on day 56. Accompanying video (Media 2 (2.2MB, MOV) ) shows registered stack to visualize vasodilation over the entire time course up to 98 dps. Scale bar = 200 µm.
The results for all study animals are shown in Fig. 5. We measured the diameter of medium (mean = 32.8 µm) and large (mean = 110.9 µm) vessels with profiling as described in §2.4. Small capillaries were excluded from analysis because of their particular susceptibility to defocus errors. Vasodilation over time is quantified by reporting the vessel diameter normalized to the diameter on the first day. The data in Fig. 5 indicate that the response peaks 2-3 dps for both size vessels, increasing by ~40% from their original diameter. The larger vessels return to their original diameter after about 2-4 weeks while dilation in the smaller vessels persists. The larger vessels also exhibited less variability than the smaller vessels.
Fig. 5.
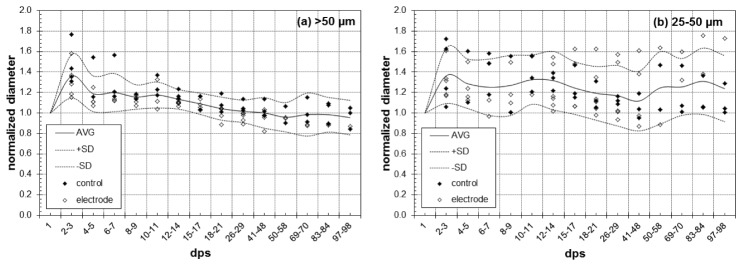
Normalized vessel diameter in (a) large and (b) medium vessels measured with OCA. Control and electrode animals are indicated by filled and open symbols and the average and standard deviation of all data is indicated by lines. Each data point represents an average of five profiles for that animal and day.
Statistical differences were evaluated by a two-tailed Student’s t-test with p<0.05 (α = 5%). Tests were performed to evaluate differences between control and electrode groups, between small and large vessels, and over time within each vessel size.
There were no statistically significant differences between control and electrode groups, regardless of the vessel size considered. We performed the test using both the slope of the normalized diameter over the time and the maximum normalized diameter after day 15 as representative parameters for each mouse. None of the tests was significant. However, there was a statistical difference in early vasodilation for different vessel sizes. We computed the t-test to compare differences between days 2-3 and days 10-15, averaging observations for each animal over those timeframes. For large vessels (>50 µm), differences were found between days 2-3 and 10-15 (p = 0.0035), while for small vessels (<50 µm), no differences were found. Thus, early vasodilation in large vessels subsides and in small vessels persists.
3.2 Vessel growth and migration
We observed significant vessel growth in the superficial plane below the window. Figure 6 shows the fractional area covered by vessels in the plane 0-100 µm below the window for control animal W38. The trend representative of all animals (control and electrode) is exhibited in Fig. 6(a). In the first day immediately following surgery, capillaries account for a minor portion of the area (~30%). A first hump (~40%) occurs within 10 days (point v) that appears to be attributed to vasodilation and not new growth. Vessel dilation typically peaks between 3 and 5 dps. As the vessel begin to return to their original diameter, the fractional area decreases back to a minimum around day 7-9 (point w). Rapid growth of new vessels is observed in next few days (point x), and by day 15-25 neovascularization has reached a maximum (point y). Thereafter the vessels stabilize with a slight trend toward reduced fractional area over the next months (point z), possibly indicating minor retraction and continued remodeling. During this stabilization, the new vessels continue to migrate, shifting with respect to the underlying vasculature (see Media 3 (766.3KB, MOV) ).
Fig. 6.
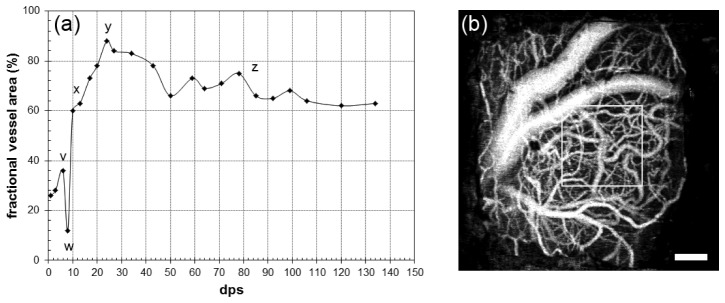
Representative vessel coverage in control animal W38. (a) Fractional area (%) covered by vessels in first depth plane (0-100 µm) in a 500 × 500 µm region delineated by the box in (b) for 133 dps. Accompanying video (Media 3 (766.3KB, MOV) ) shows the time-lapsed registered stack. Scale bar = 200 µm.
The fractional vessel area in the first depth plane for all animals is shown in Fig. 7. Because the second minimum is variable (occurring between days 5 and 8 for this cohort) and we did not always image the animals with sufficient temporal resolution to definitively capture the point immediately before new growth, the curves in Fig. 7 are shifted to align the second minimum so the trends can be better visualized. No difference in trend was observed between control and electrode animals, though the maximum fractional vessel area obtained by neovascularization did vary considerably across all animals.
Fig. 7.
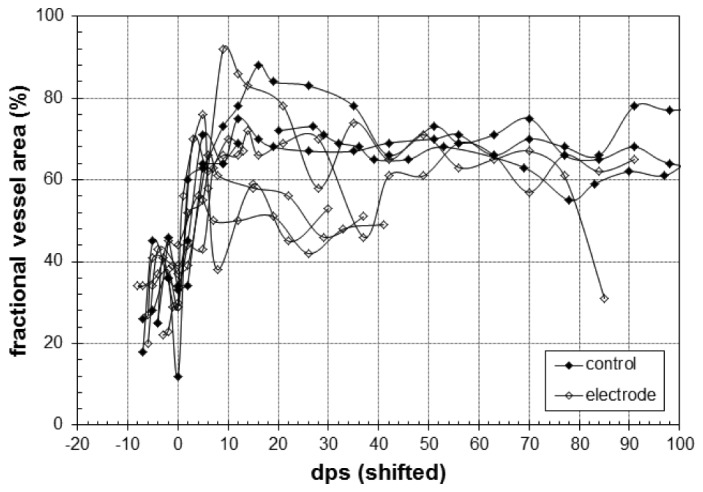
Fractional area (%) covered by vessel in first depth plane (0-100 µm) for control (closed symbols) and electrode (open symbols) animals in a 500 × 500 µm region. For visual clarity, the curves are aligned to the second minimum, which is set to day 0 (i.e., after vessel dilation and before new vessel growth).
3.3 Capillary remodeling
To investigate vascular changes in tissue immediately surrounding the electrode tip, the similarity index was calculated for OCA images at the depth of tip insertion (300-400 µm plane) for adjacent weeks for all control and electrode animals. The ROI was chosen centrally for the control group and immediately adjacent to the implanted electrode for the experimental group, avoiding any aberrant tissue growth (see §3.4). The first two weeks were excluded from analysis because in some animals visualization of the deeper capillary network was initially degraded, presumably from the inflammatory response that gave rise to vasodilation and vessel growth/migration.
The similarity index was calculated between all weeks, yielding a matrix symmetric about the diagonal. The similarity matrix was examined in two ways to describe longitudinal vessel remapping. First, the similarity index for OCA images calculated between one week and the rest (i.e., along a single row of the similarity matrix) is shown for all animals in Fig. 8(a). Shown are the weekly similarity indices for all animals, measured between the last week and all preceding weeks. The similarity index was measured in an inverted fashion (i.e., from the last week earlier) because the duration that any animal has been imaged to date is variable. Second, the average similarity for all paired OCA images is shown in Fig. 8(b). The average similarity is calculated by grouping sequentially paired weeks by their respective time difference (Δ week). So the difference between weeks 3 and 4 is grouped with the difference between weeks 5 and 6 (Δ week = 1) and the difference between weeks 3 and 6 is grouped with the difference between weeks 6 and 9 (Δ week = 3). The number of measurements used to calculate the average similarity decrease with increasing Δ week. While both analysis techniques show similar trends – that is, decreasing similarity with time – the first only captures difference between one time point and the rest, while the second captures the entire similarity matrix. The accompanying video is a time-lapsed registered stack for electrode animal W51 showing raw, Gabor filtered, and thresholded ROI (Media 4 (2.7MB, MOV) ).
Fig. 8.
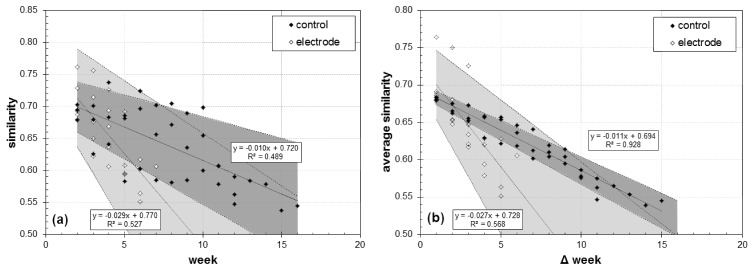
Capillary remodeling measured by OCA image similarity. (a) Similarity measured between the last week and all preceding weeks (excluding first two weeks). (b) Average similarity as a function of time separation between OCA images. Linear regression (solid line), 95% confidence limits (dashed line and shaded area), and correlation coefficient are shown for both groups. Accompanying video is the time-lapsed registered stack of the raw, Gabor filtered, and thresholded ROI from electrode animal W51 up to 44 dps (Media 4 (2.7MB, MOV) ).
3.4 Additional tissue response
In addition to vasodilation, neovascularization, and capillary remodeling, we also observed the formation of aberrant tissue growths. The abnormal tissue growth occurred in 5 of 6 animals with electrodes and 1 of 4 control animals. The single electrode animal without evidence of growth died for other reasons on 22 dps. In the others, the growth began on 7-9 dps for four animals and on 35 dps for the fifth. Lesions that formed in the window center grew faster than those that grew from the periphery. The cellular composition of the growth is undetermined, but the tissue mass was vascularized and highly scattering.
Figure 9 shows a growth in animal W49. Note the hyper-reflective layer that delineates the bottom of the new growth in the cross-sectional reflectance image. Figure 10 shows the remaining electrode animals, where lesions were observed in all animals but W41.
Fig. 9.
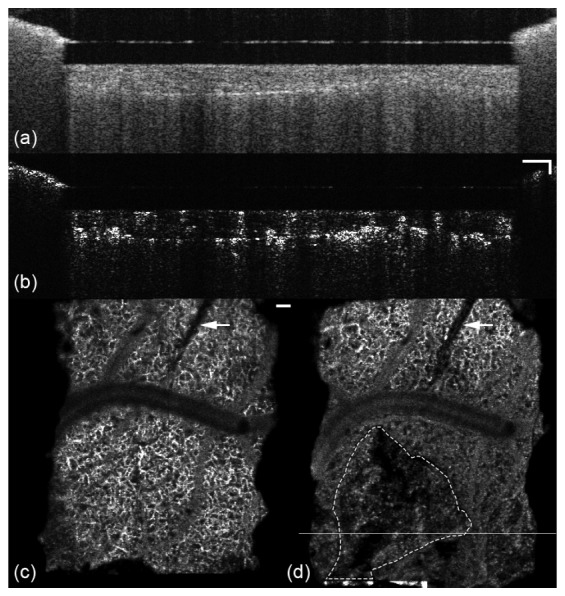
Cross-sectional reflectance (a) and angiography (b) images of a lesion in animal W49. En face angiography images from the 300-400 µm depth plane are shown in (c) and (d) for day 1, before formation, and day 50. Line in (d) indicates location of B-scan in (a) and (b). Electrode is denoted by arrow and lesion margin with dashed line. Accompanying video (Media 5 (2MB, MOV) ) shows the growth in 0-200 µm and 300-400 µm depth planes. Scale bars = 100 µm.
Fig. 10.
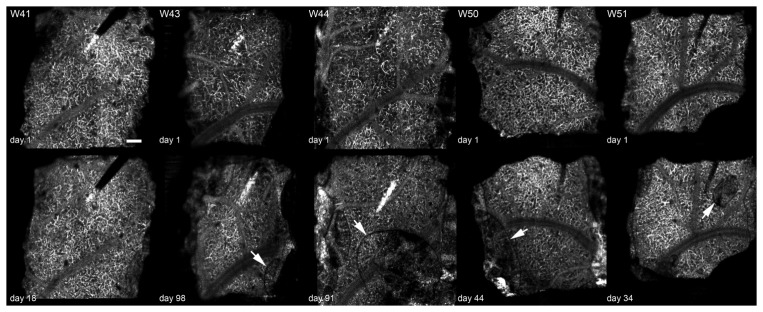
En face angiography images 300-400 µm below cortical surface for electrode animals W41, W43, W44, W50, and W51. W41 showed no growth. In the others, the growth is indicated by an arrow. Upper row shows vasculature on day 1 before new growth and lower row show vasculature after lesion formation (dps indicated). Each image is 2 × 2 mm. Scale bar = 200 µm.
4. Discussion
Speckle variance optical coherence angiography was used to characterize longitudinal vascular dynamics associated with window surgery and electrode implantation. The study was performed to differentiate the baseline inflammatory response associated with window surgery from the chronic response that may occur from electrode implantation. Evidence of vascular disruption may serve as a biomarker of future electrode failure.
We observed initial short-term vasodilation, neovascularization, and vessel migration in the superficial layers up to 200 µm below the window. Quantification of vasodilation sought to answer three questions: What were the temporal and magnitude characteristics of the vasodilation? Were there response differences between large and medium vessels? Were there response differences between control and electrode animals? The mean vasodilation was ~40% in all animals and up to 60-80% in some animals. There were temporal differences in large and medium vessels, with the former returning to initial diameter after ~3-4 weeks, and the latter showing persistent dilation. There were no statistically significant differences between the control and electrode groups, so the response is primarily attributed to window surgery and not electrode implantation. The cause of dilation and the reasons for differential effects between vessels of different diameter is not known. An effect of the general anesthetic, isoflurane, which is known to cause vasodilation with prolonged use [28, 31], cannot be ruled out. However, the animal’s anesthesia depth was kept constant by close monitoring throughout the imaging session and across imaging days, so that replicable day-to-day differences observed at specific days post-implantation are not likely to be anesthesia related. Defocus can also cause errors in measured vessel diameter, though we carefully controlled this in our study and excluded capillaries, where a defocus effect may be more pronounced. Also, averaging over a relatively thick plane mitigates this error.
Neovascularization and migration in the superficial layers below the window exhibited consistent trends in the control and electrode groups. Therefore, this response is also attributed to window surgery and not electrode implantation. Unlike vasodilation (in the larger vessels), neovascularization persisted >100 dps and migration of the vessel layers continued throughout (see Media 3 (766.3KB, MOV) ). Superficial vessels may shift more because of the visco-elastic properties in the tissue immediately below the window, though this hypothesis requires further investigation. There does appear to be a slow recession of vessels over the later time period in some animals. Because we measured new vessel growth immediately below the window, artifact (noise) from the window may have had some effect on the measured fractional vessel area, though this was carefully monitored and not large (a few percent at most). Also, while noise may have contributed to the oscillations in the stabilized period (see Fig. 6), it didn’t affect the overall trend observed. One limitation of the vessel coverage analysis is that it is two-dimensional, and axial re-modeling is not completely captured. This may account for a portion of the trend shown in Figs. 6 and 7, for example, the first minimum (point w) involves some movement of existing vessels into deeper planes during the early phase of remodeling.
We devised a similarity index to measure longitudinal capillary remapping in the deeper cortical layers. No remapping was observed upon subjective examination of the capillary network in the control and electrode groups (see Media 4 (2.7MB, MOV) ). Nor did superficial vasodilation, neovascularization, and vessel migration appear to affect the underlying capillary network adjacent to the electrode, other than perhaps causing temporary poorer quality OCA images during the acute inflammatory phase, presumably from increased scattering and absorption in the new vessels. However, OCA images from the electrode animals became dissimilar more quickly than those from the control group. The slope in the data in Fig. 8 is three times higher for the electrode group compared to the control group. If a similarity index value of 0.6 is somewhat subjectively determined as the point the capillary network in adjacent images becomes dissimilar, this threshold was crossed after 11 and 6 weeks in the control and electrode groups when comparing across the last day, and the threshold was crossed after 9 and 5 weeks in the control and electrode groups when comparing across all days. This result should be judged with caution for several reasons. First, the number of animals is relatively small, and further investigation using more animals is necessary. Second, the length of time that each group was observed differed, where the capillary network in the control animals was imaged longer. This may influence the mean value of the overall similarity calculations, particularly for longer Δ weeks. Third, visualization of the capillary network, while sufficient for this preliminary study, can be improved with use of a higher NA objective. We have already performed preliminary measurements with these animals using a 10 × objective (though not over such a long time period), and others have also used systems with higher lateral resolution [9]. Also, a large portion of dissimilarity may come from imperfect alignment of the images and better registration algorithms may be applied in the future with better success. Therefore, system and algorithmic improvements may change results. (An improvement in lateral resolution is less likely to affect vasodilation measurements because capillaries are specifically excluded from that analysis.) Fourth, even if there is different capillary re-mapping between electrode and control animals, it may be difficult to determine the cause, or to correlate this with electrode signal degradation. While a ROI adjacent to electrode was chosen, the important biological response may be confined to a tighter margin around the electrode. Clearly, this investigation is nascent and root causes and mechanisms of electrode failure difficult to discern.
We also observed new growth in many of the animals with electrode implantation. Schendel et al. observed micro-hematomas and other tissue growth with micro-electrocorticography arrays implanted in rats [32]. The cause of new tissue growth is undetermined, but we note that they were seen in 83% of electrode animals and 25% of control animals. However, the site of genesis for the growth was never near the electrode (several hundred µm away), and often located at the periphery. This suggests it may be associated with the window itself or another cause unrelated to electrode insertion. Post-hoc immunohistological analysis of the cellular content will be performed at the termination of the imaging experiment. Further studies with more subjects are required to determine the cause of lesion formation and growth.
Craniotomy and insertion of an optical window into the skull of a small animal is known to cause an inflammatory response [27], though until now the detailed dynamics of the response on a chronic timescale was not completely clear. In this study, we provided a systematic characterization of vascular morphological changes associated with cranial window implantation and electrode insertion for time points up to six months. All surgical preparations have to be managed with care to avoid detrimental contribution toward the primary observation or measurement endpoint. Without commenting on the relative suitability of this preparation compared to others for measurement of vascular dynamics, which is not the topic of this study, the current window preparation was deemed appropriate for longitudinal investigations. This time frame is necessary to link vascular dynamics to recording electrode failure, which may occur several months to years after implantation in human patients.
Acknowledgments
This work was funded by an interagency agreement with DARPA (RE-NET Program, Microsystems Technology Office) and a grant from the FDA Medical Counter Measures Initiative. We thank Sina Farsui for helpful suggestions. The mention of commercial products, their sources, or their use in connection with material reported herein is not to be construed as either an actual or implied endorsement of such products by the US Department of Health and Human Services.
References and links
- 1.Srinivasan V. J., Jiang J. Y., Yaseen M. A., Radhakrishnan H., Wu W., Barry S., Cable A. E., Boas D. A., “Rapid volumetric angiography of cortical microvasculature with optical coherence tomography,” Opt. Lett. 35(1), 43–45 (2010). 10.1364/OL.35.000043 [DOI] [PMC free article] [PubMed] [Google Scholar]
- 2.Hendargo H. C., Estrada R., Chiu S. J., Tomasi C., Farsiu S., Izatt J. A., “Automated non-rigid registration and mosaicing for robust imaging of distinct retinal capillary beds using speckle variance optical coherence tomography,” Biomed. Opt. Express 4(6), 803–821 (2013). 10.1364/BOE.4.000803 [DOI] [PMC free article] [PubMed] [Google Scholar]
- 3.Liu G., Lin A. J., Tromberg B. J., Chen Z., “A comparison of Doppler optical coherence tomography methods,” Biomed. Opt. Express 3(10), 2669–2680 (2012). 10.1364/BOE.3.002669 [DOI] [PMC free article] [PubMed] [Google Scholar]
- 4.Fingler J., Schwartz D., Yang C., Fraser S. E., “Mobility and transverse flow visualization using phase variance contrast with spectral domain optical coherence tomography,” Opt. Express 15(20), 12636–12653 (2007). 10.1364/OE.15.012636 [DOI] [PubMed] [Google Scholar]
- 5.Braaf B., Vermeer K. A., Vienola K. V., de Boer J. F., “Angiography of the retina and the choroid with phase-resolved OCT using interval-optimized backstitched B-scans,” Opt. Express 20(18), 20516–20534 (2012). 10.1364/OE.20.020516 [DOI] [PubMed] [Google Scholar]
- 6.Wang R. K., Jacques S. L., Ma Z., Hurst S., Hanson S. R., Gruber A., “Three dimensional optical angiography,” Opt. Express 15(7), 4083–4097 (2007). 10.1364/OE.15.004083 [DOI] [PubMed] [Google Scholar]
- 7.Wang R. K., An L., “Doppler optical micro-angiography for volumetric imaging of vascular perfusion in vivo,” Opt. Express 17(11), 8926–8940 (2009). 10.1364/OE.17.008926 [DOI] [PMC free article] [PubMed] [Google Scholar]
- 8.Srinivasan V. J., Radhakrishnan H., Jiang J. Y., Barry S., Cable A. E., “Optical coherence microscopy for deep tissue imaging of the cerebral cortex with intrinsic contrast,” Opt. Express 20(3), 2220–2239 (2012). 10.1364/OE.20.002220 [DOI] [PMC free article] [PubMed] [Google Scholar]
- 9.Srinivasan V. J., Radhakrishnan H., Lo E. H., Mandeville E. T., Jiang J. Y., Barry S., Cable A. E., “OCT methods for capillary velocimetry,” Biomed. Opt. Express 3(3), 612–629 (2012). 10.1364/BOE.3.000612 [DOI] [PMC free article] [PubMed] [Google Scholar]
- 10.Radhakrishnan H., Srinivasan V. J., “Compartment-resolved imaging of cortical functional hyperemia with OCT angiography,” Biomed. Opt. Express 4(8), 1255–1268 (2013). 10.1364/BOE.4.001255 [DOI] [PMC free article] [PubMed] [Google Scholar]
- 11.Lee J., Jiang J. Y., Wu W., Lesage F., Boas D. A., “Statistical intensity variation analysis for rapid volumetric imaging of capillary network flux,” Biomed. Opt. Express 5(4), 1160–1172 (2014). 10.1364/BOE.5.001160 [DOI] [PMC free article] [PubMed] [Google Scholar]
- 12.Jia Y., Grafe M. R., Gruber A., Alkayed N. J., Wang R. K., “In vivo optical imaging of revascularization after brain trauma in mice,” Microvasc. Res. 81(1), 73–80 (2011). 10.1016/j.mvr.2010.11.003 [DOI] [PMC free article] [PubMed] [Google Scholar]
- 13.Srinivasan V. J., Mandeville E. T., Can A., Blasi F., Climov M., Daneshmand A., Lee J. H., Yu E., Radhakrishnan H., Lo E. H., Sakadžić S., Eikermann-Haerter K., Ayata C., “Multiparametric, longitudinal optical coherence tomography imaging reveals acute injury and chronic recovery in experimental ischemic stroke,” PLoS ONE 8(8), e71478 (2013). 10.1371/journal.pone.0071478 [DOI] [PMC free article] [PubMed] [Google Scholar]
- 14.Hochberg L. R., Bacher D., Jarosiewicz B., Masse N. Y., Simeral J. D., Vogel J., Haddadin S., Liu J., Cash S. S., van der Smagt P., Donoghue J. P., “Reach and grasp by people with tetraplegia using a neurally controlled robotic arm,” Nature 485(7398), 372–375 (2012). 10.1038/nature11076 [DOI] [PMC free article] [PubMed] [Google Scholar]
- 15.Kim S.-P., Simeral J. D., Hochberg L. R., Donoghue J. P., Black M. J., “Neural control of computer cursor velocity by decoding motor cortical spiking activity in humans with tetraplegia,” J. Neural Eng. 5(4), 455–476 (2008). 10.1088/1741-2560/5/4/010 [DOI] [PMC free article] [PubMed] [Google Scholar]
- 16.Kim S.-P., Simeral J. D., Hochberg L. R., Donoghue J. P., Friehs G. M., Black M. J., “Point-and-click cursor control with an intracortical neural interface system by humans with tetraplegia,” IEEE Trans. Neural Syst. Rehabil. Eng. 19(2), 193–203 (2011). 10.1109/TNSRE.2011.2107750 [DOI] [PMC free article] [PubMed] [Google Scholar]
- 17.Durand D. M., Ghovanloo M., Krames E., “Time to address the problems at the neural interface,” J. Neural Eng. 11(2), 020201 (2014). 10.1088/1741-2560/11/2/020201 [DOI] [PubMed] [Google Scholar]
- 18.Judy J. W., “Neural interfaces for upper-limb prosthesis control: opportunities to improve long-term reliability,” IEEE Pulse 3(2), 57–60 (2012). 10.1109/MPUL.2011.2181026 [DOI] [PubMed] [Google Scholar]
- 19.Polikov V. S., Tresco P. A., Reichert W. M., “Response of brain tissue to chronically implanted neural electrodes,” J. Neurosci. Methods 148(1), 1–18 (2005). 10.1016/j.jneumeth.2005.08.015 [DOI] [PubMed] [Google Scholar]
- 20.Prasad A., Xue Q.-S., Sankar V., Nishida T., Shaw G., Streit W. J., Sanchez J. C., “Comprehensive characterization and failure modes of tungsten microwire arrays in chronic neural implants,” J. Neural Eng. 9(5), 056015 (2012). 10.1088/1741-2560/9/5/056015 [DOI] [PubMed] [Google Scholar]
- 21.Kozai T. D., Vazquez A. L., Weaver C. L., Kim S.-G., Cui X. T., “In vivo two-photon microscopy reveals immediate microglial reaction to implantation of microelectrode through extension of processes,” J. Neural Eng. 9(6), 066001 (2012). 10.1088/1741-2560/9/6/066001 [DOI] [PMC free article] [PubMed] [Google Scholar]
- 22.Takmakov P., Ruda K., Phillips S. K., Isayeva I. S., Krauthamer V., Welle C. G., “Rapid evaluation of the durability of cortical neural implants using accelerated aging with reactive oxygen species,” J. Neural Eng. submitted. [DOI] [PMC free article] [PubMed]
- 23.Schaffer C. B., Friedman B., Nishimura N., Schroeder L. F., Tsai P. S., Ebner F. F., Lyden P. D., Kleinfeld D., “Two-photon imaging of cortical surface microvessels reveals a robust redistribution in blood flow after vascular occlusion,” PLoS Biol. 4(2), e22 (2006). 10.1371/journal.pbio.0040022 [DOI] [PMC free article] [PubMed] [Google Scholar]
- 24.Hayashi T., Deguchi K., Nagotani S., Zhang H., Sehara Y., Tsuchiya A., Abe K., “Cerebral ischemia and angiogenesis,” Curr. Neurovasc. Res. 3(2), 119–129 (2006). 10.2174/156720206776875902 [DOI] [PubMed] [Google Scholar]
- 25.Roth T. L., Nayak D., Atanasijevic T., Koretsky A. P., Latour L. L., McGavern D. B., “Transcranial amelioration of inflammation and cell death after brain injury,” Nature 505(7482), 223–228 (2013). 10.1038/nature12808 [DOI] [PMC free article] [PubMed] [Google Scholar]
- 26.Holtmaat A., Bonhoeffer T., Chow D. K., Chuckowree J., De Paola V., Hofer S. B., Hübener M., Keck T., Knott G., Lee W. C., Mostany R., Mrsic-Flogel T. D., Nedivi E., Portera-Cailliau C., Svoboda K., Trachtenberg J. T., Wilbrecht L., “Long-term, high-resolution imaging in the mouse neocortex through a chronic cranial window,” Nat. Protoc. 4(8), 1128–1144 (2009). 10.1038/nprot.2009.89 [DOI] [PMC free article] [PubMed] [Google Scholar]
- 27.Drew P. J., Shih A. Y., Driscoll J. D., Knutsen P. M., Blinder P., Davalos D., Akassoglou K., Tsai P. S., Kleinfeld D., “Chronic imaging and manipulation of cells and vessels through a polished and reinforced thinned-skull,” Nat. Methods 7, 981–984 (2010). 10.1038/nmeth.1530 [DOI] [PMC free article] [PubMed] [Google Scholar]
- 28.Shih A. Y., Driscoll J. D., Drew P. J., Nishimura N., Schaffer C. B., Kleinfeld D., “Two-photon microscopy as a tool to study blood flow and neurovascular coupling in the rodent brain,” J. Cereb. Blood Flow Metab. 32(7), 1277–1309 (2012). 10.1038/jcbfm.2011.196 [DOI] [PMC free article] [PubMed] [Google Scholar]
- 29.Ustun T. E., Iftimia N. V., Ferguson R. D., Hammer D. X., “Real-time processing for Fourier domain optical coherence tomography using a field programmable gate array,” Rev. Sci. Instrum. 79(11), 114301 (2008). 10.1063/1.3005996 [DOI] [PMC free article] [PubMed] [Google Scholar]
- 30.Daugman J. G., “Uncertainty relation for resolution in space, spatial frequency, and orientation optimized by two-dimensional visual cortical filters,” J. Opt. Soc. Am. A 2(7), 1160–1169 (1985). 10.1364/JOSAA.2.001160 [DOI] [PubMed] [Google Scholar]
- 31.Lassen N. A., Christensen M. S., “Physiology of cerebral blood flow,” Br. J. Anaesth. 48(8), 719–734 (1976). 10.1093/bja/48.8.719 [DOI] [PubMed] [Google Scholar]
- 32.Schendel A. A., Thongpang S., Brodnick S. K., Richner T. J., Lindevig B. D. B., Krugner-Higby L., Williams J. C., “A cranial window imaging method for monitoring vascular growth around chronically implanted micro-ECoG devices,” J. Neurosci. Methods 218(1), 121–130 (2013). 10.1016/j.jneumeth.2013.06.001 [DOI] [PMC free article] [PubMed] [Google Scholar]


