Abstract
Second-harmonic generation (SHG) can be used for imaging membrane potential in neurons, but poor signal-to-noise (S/N)limits accurate measurements of small voltage transients. We use photon counting to improve the S/N of weak SHG signal detection. Photon counting generates shot-noise limited and integrable signals, eliminates pulse-to-pulse variation, and built-in discriminators reduces the background to practically zero. In single trials, by using photon counting, we obtain a more than a twofold S/N increase over analog voltage detection. Trial-to-trial variability is also reduced by 50%. Finally, we show that, using photon counting, the kinetics of fast events such as action potentials can be recorded more accurately.
Keywords: second-harmonic generation, photon counting, neuron, membrane potential
INTRODUCTION
Second-harmonic generation (SHG) is a nonlinear optical phenomenon where photons interact with a nonlinear material and generate photons with twice the energy. SHG process is forbidden in a bulk medium with inversion symmetry, but is allowed at surface and interfaces where the inversion symmetry is broken (Eisenthal, 1996). Thus, SHG is a sensitive surface-selective technique with no signal interference from the bulk. Recently, SHG microscopy based imaging has caught attention among biologists, especially neuroscientists, due to its exquisite sensitivity to interfaces (Moreaux et al., 2000) and to its fast and linear response to changes in membrane potential (Millard et al., 2003b; Nemet et al., 2004; Jiang et al., 2007). Thus, SHG can be potentially a noninvasive method with superb spatial and temporal resolution for membrane potential mapping (for a review, see Millard et al., 2003a). Commonly used SHG chromophores are push-pull styryl dyes with a dominant uniaxial molecular dipole. Some of these dyes, such as FM 4-64, are amphiphilic. They are highly soluble in water, and at the same time readily interact with membrane phospholipids to form a dense structure, yet the hydrophilic charge group prevents them from permeating through the membrane bilayer.
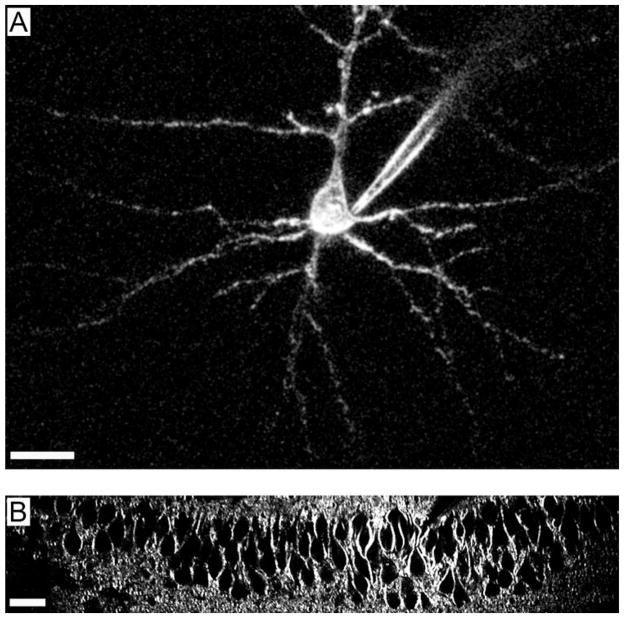
To date, several groups have demonstrated how SHG can be used to image action potential voltage transients (Dombeck et al., 2004, 2005; Yuste et al., 2005; Nuriya et al., 2006), and even action potential backpropagating into dendritic spines (Nuriya et al., 2006), so far impossible to record with traditional patch-clamp techniques. Moreover, at least in some instances, the mechanism by which SHG senses membrane potential appears to be electrooptic (Jiang et al., 2007). This provides a solid methodological foundation for this technique and also could enable the rational design of better SHG chromophores. As we show in Figure 1, neurons patched with whole-cell electrodes and filled with FM 4-64 generate strong SHG signals that revealed not just the morphology of the cell body of the neurons, but also that of the main dendritic processes (Fig. 1A). When FM 4-64 was bath applied, SHG signals outlined the cell bodies of dozens of pyramidal neurons from the CA1 region of the hippocampus (Fig. 1B). The observed SHG signals are coming exclusively from cell membrane regions but not from the cytosol, because the membrane impermeable FM 4-64 only stains one leaflet of the cell membrane (inner side when filled inside or the outer side when bath applied), which results in a noncentrosymmetric structure. Thus, with good signal-to-noise ratio, quantitative SHG should be able to address questions like single cell electrical properties as well as electrical dynamics from a population of neurons.
Figure 1.
Single neuron and cell population SHG imaging. A: SHG image of a layer 5 pyramidal neuron from mouse visual cortex, injected with the chromophore FM-4-64. The SHG signal outlines the plasma membrane and the dendrites of the cell are clearly visible. B: SHG image of a field of pyramidal neurons in the CA1 region of the hippocampus. The cells were labeled by bath application of a SHG chromophore. Dozens of cell bodies are visible. Scale bars: 20 μm.
As a second-order scattering process, SHG suffers from weak signals, with single molecule cross sections that are three to four orders of magnitude smaller than that of two-photon fluorescence (Moreaux et al., 2001), a common nonlinear optical microscopy technique used for biological imaging with near-infrared (IR)excitations. Other factors, such as chromophore flip-flop in the membrane, may also reduce the signal-to-noise ratio (S/N) (Pons et al., 2002). Various efforts have been put into improving SHG S/N, such as designing chromophores with high hyperpolarizability, imaging at optical resonance, and signal averaging (for a recent review, see Millard et al., 2003a; Dombeck et al., 2004, 2005; Nuriya et al., 2006). With signal averaging, S/N can be improved, but it comes at a price of losing spatial information, as in the case of averaging over many neighboring membrane areas, or increasing photodamage due to repetitive light representation (Sacconi et al., 2006).
For SHG signal detection, photomultiplier tubes (PMT) are routinely used. PMT convert light into electrical signals in the form of analog current or voltage in most applications. However, for very weak optical signals, such as SHG signals from dendritic spines, the low rate of incident photons results in detecting separated photon pulses or sparse pulses with very little temporal overlap, yielding a noisy analog current or voltage signal. Signal variation also occurs due to the variable gain in the photoelectron amplification stage (pulse-height distribution). Therefore, under such low light level conditions, photon counting methods could provide a better way of measuring numbers of photoelectrons directly, with better S/N and stability. In addition, the dark current, mostly due to thermal emission, can be largely eliminated by setting appropriate discrimination levels in the photon counting unit.
Herein we present our effort in improving the S/N of quantitative SHG imaging using photon counting. Multi-photon imaging using photon counting devices has been described by several research groups before using acoustic-optical scanners (Iyer et al., 2006; Salomé et al., 2006). We have implemented photon counting into our custom-made two-photon microscope using a low noise photon counting PMT head. We show that the SHG signal collected from photon counter is shot-noise limited, and, compared to signals recorded in analog mode, at least a twofold increase in S/N is observed for single trials. The increased S/N and decreased background signal improve the reproducibility between trials by 50%, yielding more consistent results across experiments. With this improved S/N, the kinetics of fast membrane potential changes such as action potential transient can be optically recorded with better fidelity.
MATERIALS AND METHODS
Samples for SHG imaging consisted of pollen grains or layer 5 pyramidal neurons from mouse visual cortex neurons filled with FM 4-64 dye in acute coronal slices as described previously (Nuriya et al., 2006). All animal experiments were performed according to the National Institutes of Health guidelines and were approved by the local Institutional Animal Care and Use Committee (IACUC). Fast action potential measurements were carried out with pointscan detection by positioning the illuminating excitation laser at a fixed target position for 30 ms. Measurements were repeated ~20 times at a rate of 2 Hz, with a simultaneous current injection in every other cycle to elicit action potentials. SHG voltage sensitivity characterization was performed by applying voltage steps of ~30–50 mV at 1 Hz, while SHG signal from the target position was sampled at 2 Hz. Averaged SHG signals from control and stimulation conditions were then calculated and used to determine the percentage of changes in SHG signals normalized to the corresponding voltage changes.
Instrumentation
A custom-made two-photon laser scanning microscope (Nikolenko et al., 2003) based on a confocal Fluoview microscope (Olympus, Melville, NY) was used for SHG imaging. A Nd:glass laser at 1064 nm (~80 fs, 50 MHz, IC-100, HighQ Laser) was used as the laser excitation source, typically with less than 5 mW at the sample plane. Laser power was modulated by a Pockel’s cell (Quantum Technology 327, Lake Mary, FL). SHG signals, passing through an IR filter and a narrow bandpass filter (530/20 nm, Chroma Technology Corp.) to block the laser light and fluorescence emission, were collected by a photomultiplier tube (Hamamatsu H7422P-40) with photon counting capability, whose output was then either amplified by an analog voltage amplifier (Signal Recovery 5113) or fed into a photon counting unit (Hamamatsu C9744) to generate 5V TTL output of photon pulses.
Data Acquisition and Analysis
Analog voltage and photon counter output were connected to a two-way switch, which inputs to a data acquisition card (National Instruments 6052E). Electrophysiology and PMT voltage were simultaneously acquired using custom written LabVIEW programs (National Instruments, Austin, TX). Photon counting was performed using the two built-in counters on the NI-6052E board: one generates counting gate pulses using the internal 20 MHz clock as base, and the other one counts number of photons in between the gating signal. Photon counts were then recorded using custom written LabVIEW programs. All data analysis was done using custom written code in MATLAB (Mathworks, Natick, MA).
RESULTS AND DISCUSSION
Photon Counting Signal Is Shot-Noise Limited
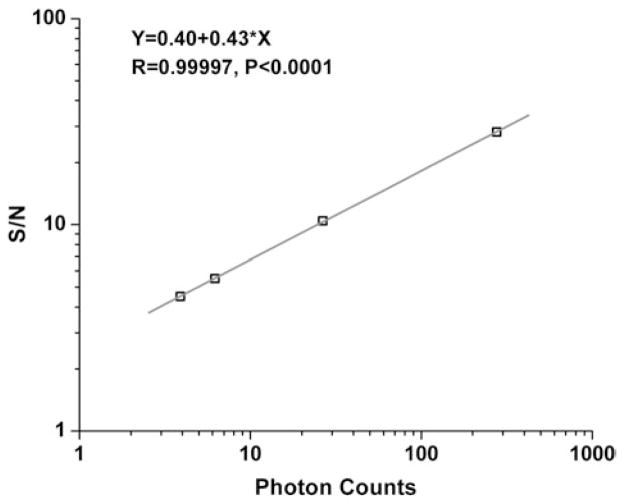
To quantitatively characterize our detection, we used pollen grains as our SHG model system, which has the advantage of less prone to photobleaching and photodamage compared to biological samples. For weak optical signals, due to the variable gain of PMT amplification stage and smaller overlap of the amplified photocurrent pulses, severe trial-to-trial variation can occur. Photon counting removes thermal noise by signal thresholding before outputting the digital signals, which enables signal summation with much less dark counts and pulse to pulse variations. With pollen grains, we recorded the number of SHG photons with 1064-nm laser excitation as we changed the frequency of the photon counting gate from 100 Hz to 10 kHz. As shown in Figure 2, by integrating photons over different time periods, the signal intensity summed up and increased linearly, while S/N increased nonlinearly, to a power of ~0.43, as expected for a shot-noise limited situation of 0.5. In contrast, for analog detection utilizing the voltage output from PMT, by increasing preamplifier gains, changing low-pass filter settings and decreasing sampling rate, we did not observe a significant increase of S/N (data not shown). This demonstrates the advantage of digital photon counting over analog detection in terms of improving S/N significantly by longer signal integration.
Figure 2.
Photon counting is shot-noise limited. Logarithmic plot of S/N, defined as signal mean divided by standard deviation, as a function of SHG photon counts from pollen grains. Photon counts were recorded with a counting gate frequency of 100 Hz, 1 kHz, 5 kHz, and 10 kHz, respectively. The straight line is the linear fit of the data points with a slope value of 0.43, close to 0.5 as expected for shot-noise limited detection.
Photon Counting Improves S/N from Weak Signal Sources
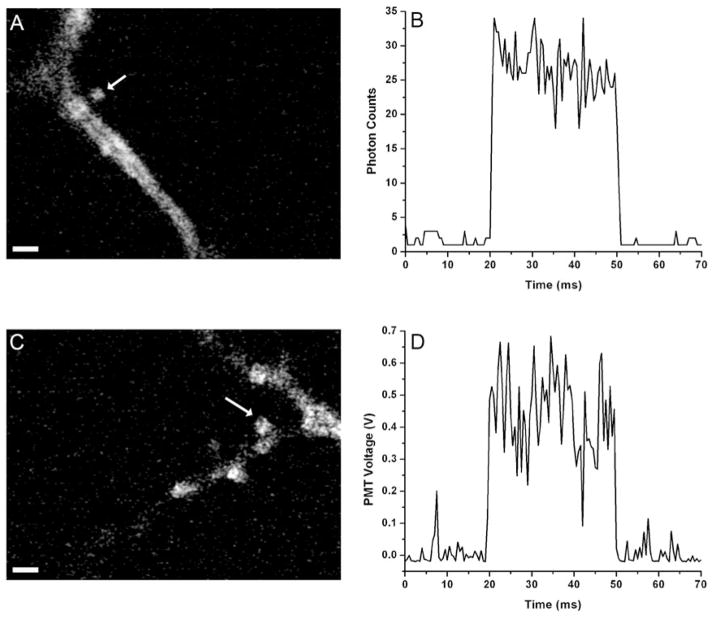
Dendritic spines are among one of the most interesting samples for SHG imaging, as they are the main sites of synaptic contacts and are critical for cortical circuit formation, but yet almost inaccessible by traditional electrophysiology techniques. Because spines are located quite far away from cell somata, the SHG chromophore loading site, and with thin spine neck acting as a diffusion barrier (Svoboda et al., 1996), dendritic spines tend to show very weak SHG intensity and also are particularly prone to photobleaching and photodamage. Thus, recording weak SHG signal from dendritic spines with good S/N is vital to imaging SHG changes in response to changes in membrane potential. Next, we examined and compared weak SHG signals from dendritic spines with both analog and digital recordings in pointscan configuration. As shown in Figure 3, digital recording shows clearly improved S/N compared to analog ones, and in this case, an increase of more than twice (13% versus 29%, coefficient of variation) was observed for signals collected in photon counting mode from single trial. Considering that the voltage sensitivity of SHG response is ~10–15%/100 mV (Nuriya et al., 2006; Jiang et al., 2007), 13% corresponds to an S/N of ~1 for measuring 100-mV events. Also notable was the smoother baseline in the digital recording, which demonstrates the advantage using photon counter to achieve an almost zero background data acquisition.
Figure 3.
Improvements in S/N using photon counting imaging of dendritic spines. Comparison of signal variations between digital (i.e., photon counting) and analog detection schemes. A,C: SHG images of dendritic spines under investigation, where arrow heads indicate target points from where SHG signals were collected for comparison. B: Signal obtained using photon counter with counting gate frequency of 2 kHz. D: Analog signal from PMT with data acquisition rate of 2 kHz and low-pass filtered at 1 kHz. Laser was on target from time t = 20 ms to t = 50 ms controlled by modulating Pockel’s cell. Coefficient of variation during the laser on period is 13% for B and 29% for D. Note the large fluctuations of signal baseline from analog detection. Scale bars: 2 μm.
Improvement in Measurement Reproducibility Using Photon Counting
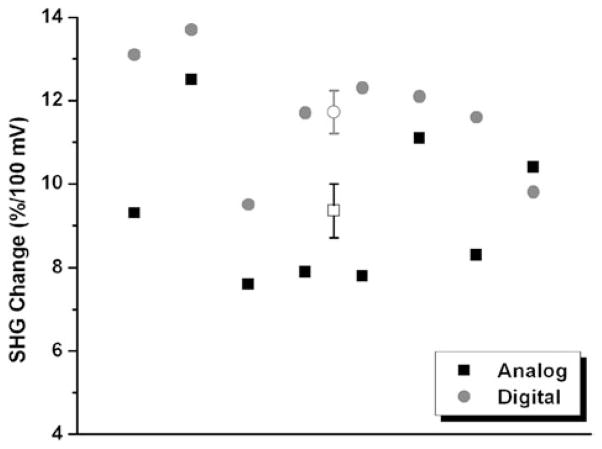
With improved S/N from photon counting mode compared to analog detection, we also observed better trial-to-trial reproducibility using photon counter. For these comparisons, we performed SHG imaging of membrane potential under voltage-clamp conditions. SHG signals from a target point in plasma membrane were recorded with the cell at resting membrane potential and its depolarization was then controlled by the patch pipette. The differences of the optical signals were then calculated and normalized to the membrane voltage change. As can be seen in Figure 4, we found that across experiments, data obtained with a photon counter showed a trial-to-trial variation of 12.5% (coefficient of variation), compared to 19.2% of analog detection, a significant improvement in reproducibility across experiments. This should enable more consistent quantitative measurement of electrical events using SHG microscopy.
Figure 4.
Photon counting SHG imaging shows increased reproducibility. Stability comparisons between analog (■) and digital (●) detections. Each solid point represents data from one voltage-clamp experiment. □ (○) shows mean value with standard error from analog (digital) detections. For analog detection, the average SHG change is 9.36 ± 0.64 (mean ± SE), while the number is 11.73 ±0.52 for detection using photon counter.
Photon Counting Reveals More Accurate Kinetics
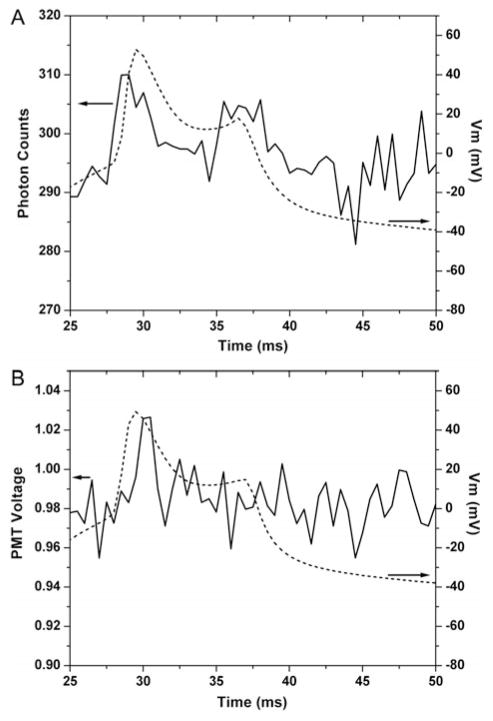
The electrical activity of neuronal system spans a wide range in both strength and temporal kinetics. SHG is a good tool to faithfully monitor these electrical events noninvasively, due to its linear and fast electro-optical response to local electric field changes (Jiang et al., 2007). To compare the performances of digital and analog detection of fast potential change events, we examined action potential detection using both data collecting methods. In Figure 5, SHG responses averaged over 20 action potential presentations for both digital and analog detection methods are shown, superimposed with neuronal voltage recorded simultaneously using the patch pipette. The improved S/N from digital mode yields better fidelity in terms of following the kinetics of the membrane voltage compared to the analog mode, although at the same time, even with photon counting, the S/N is still not ideal to monitors these fast changes.
Figure 5.
Enhanced kinetics measurements using photon counting. Action potential measurements using digital (A) and analog (B) detections. Signals acquired at 2-kHz sampling rate with analog signal low-pass filtered at 1 kHz. Data are averages of 20 presentations without control signal subtraction. Left axis shows SHG signal strength, and right axis denotes neuronal membrane potential (dashed curve) recorded simultaneously with the patch pipette. Notice how the shoulder of the depolarization (at 35–40 ms) appears in the digital but not in the analog trace.
CONCLUSIONS
In summary, we find an improvement of quantitative SHG microscopy imaging of neuronal membrane potential in living neuronal preparations using photon counting. A simple photon counting unit, coupled with our custom-made microscope, enabled us to obtain analog voltage or digital photoelectron pulse output. Photon counting signal was shot-noise limited and integrable, which allowed increasing the S/N by signal integration. With the built-in discriminator in the photon counting unit, background noise could be significantly decreased. Digital pulse counting also eliminated the pulse-to-pulse variation due to variable gains during the amplification stage. These factors resulted in improvements of S/N (measured as inverse of coefficient of variation) of more than twofold, when compared to analog voltage detection. Trial-to-trial variability was also reduced by 50% by switching from analog to digital recording. Finally, we showed that the kinetics of electrical events such as action potential can be recorded with more fidelity using photon counting method. The improved S/N in SHG imaging could allow us to obtain reproducible results with less averaging, thus reducing the possible photodamage and phototoxicity. This, combined with new SHG probes with higher voltage sensitivity, could allow us to image action potentials in single trial or events with smaller amplitude such as postsynaptic potentials.
Acknowledgments
We thank K. Eisenthal for extensive discussions and support, and members of the laboratory for comments. This work is supported by the Kavli Institute for Neural Science, the NYSTAR program, the Gatsby Institute for Brain Science, the National Eye Institute, and the Binational US-Israel Science Foundation.
References
- Dombeck DA, Blanchard-Desce M, Webb WW. Optical recording of action potentials with second-harmonic generation microscopy. J Neurosci. 2004;24(4):999–1003. doi: 10.1523/JNEUROSCI.4840-03.2004. [DOI] [PMC free article] [PubMed] [Google Scholar]
- Dombeck DA, Sacconi L, Blanchard-Desce M, Webb WW. Optical recording of fast neuronal membrane potential transients in acute mammalian brain slices by second-harmonic generation microscopy. J Neurophysiol. 2005;94(5):3628–3636. doi: 10.1152/jn.00416.2005. [DOI] [PubMed] [Google Scholar]
- Eisenthal KB. Liquid interfaces probed by second-harmonic and sum-frequency spectroscopy. Chem Rev. 1996;96(4):1343–1360. doi: 10.1021/cr9502211. [DOI] [PubMed] [Google Scholar]
- Iyer V, Hoogland TM, Saggau P. Fast functional imaging of single neurons using random-access multiphoton (RAMP) microscopy. J Neurophysiol. 2006;95(1):535–545. doi: 10.1152/jn.00865.2005. [DOI] [PubMed] [Google Scholar]
- Jiang J, Eisenthal KB, Yuste R. Second harmonic generation in neurons: Electro-optic mechanism of membrane potential sensitivity. Biophys J. 2007;93(5):L26–28. doi: 10.1529/biophysj.107.111021. [DOI] [PMC free article] [PubMed] [Google Scholar]
- Millard AC, Campagnola PJ, Mohler W, Lewis A, Loew LM. Second harmonic imaging microscopy. Meth Enzymol. 2003a;361:47–69. doi: 10.1016/s0076-6879(03)61005-0. [DOI] [PubMed] [Google Scholar]
- Millard AC, Jin L, Lewis A, Loew LM. Direct measurement of the voltage sensitivity of second-harmonic generation from a membrane dye in patch-clamped cells. Opt Lett. 2003b;28(14):1221–1223. doi: 10.1364/ol.28.001221. [DOI] [PubMed] [Google Scholar]
- Moreaux L, Sandre O, Blanchard-Desce M, Mertz J. Membrane imaging by simultaneous second-harmonic generation and two-photon microscopy. Opt Lett. 2000;25(5):320–322. doi: 10.1364/ol.25.000320. [DOI] [PubMed] [Google Scholar]
- Moreaux L, Sandre O, Charpak S, Blanchard-Desce M, Mertz J. Coherent scattering in multi-harmonic light microscopy. Biophys J. 2001;80(3):1568–1574. doi: 10.1016/S0006-3495(01)76129-2. [DOI] [PMC free article] [PubMed] [Google Scholar]
- Nemet BA, Nikolenko V, Yuste R. Second harmonic imaging of membrane potential of neurons with retinal. J Biomed Opt. 2004;9(5):873–881. doi: 10.1117/1.1783353. [DOI] [PubMed] [Google Scholar]
- Nikolenko V, Nemet B, Yuste R. A two-photon and second-harmonic microscope. Methods. 2003;30(1):3–15. doi: 10.1016/s1046-2023(03)00003-3. [DOI] [PubMed] [Google Scholar]
- Nuriya M, Jiang J, Nemet B, Eisenthal KB, Yuste R. Imaging membrane potential in dendritic spines. Proc Natl Acad Sci USA. 2006;103(3):786–790. doi: 10.1073/pnas.0510092103. [DOI] [PMC free article] [PubMed] [Google Scholar]
- Pons T, Moreaux L, Mertz J. Photoinduced flip-flop of amphiphilic molecules in lipid bilayer membranes. Phys Rev Lett. 2002;89(28):288104. doi: 10.1103/PhysRevLett.89.288104. [DOI] [PubMed] [Google Scholar]
- Sacconi L, Dombeck DA, Webb WW. Overcoming photodamage in second-harmonic generation microscopy: Real-time optical recording of neuronal action potentials. Proc Natl Acad Sci USA. 2006;103(9):3124–3129. doi: 10.1073/pnas.0511338103. [DOI] [PMC free article] [PubMed] [Google Scholar]
- Salomé R, Kremer Y, Dieudonné S, Léger JF, Krichevsky O, Wyart C, Chatenay D, Bourdieu L. Ultrafast random-access scanning in two-photon microscopy using acousto-optic deflectors. J Neurosci Meth. 2006;154(1–2):161–174. doi: 10.1016/j.jneumeth.2005.12.010. [DOI] [PubMed] [Google Scholar]
- Svoboda K, Tank DW, Denk W. Direct measurement of coupling between dendritic spines and shafts. Science. 1996;272 (5262):716–719. doi: 10.1126/science.272.5262.716. [DOI] [PubMed] [Google Scholar]
- Yuste R, Nemet B, Jiang J, Nuriya M, Eisenthal K. Imaging Neurons and Neural Activity: New Methods, New Results. Cold Spring Harbor, NY: Cold Spring Harbor Press; 2005. Second harmonic generation imaging of membrane potential; pp. 16–17. [Google Scholar]


