

Abstract
Background and Objectives
Dipeptidyl peptidase-4 (DPP4) inhibition is a potential strategy to increase the engraftment rate of hematopoietic stem/progenitor cells. A recent clinical trial using sitagliptin, a DPP4 inhibitor approved for type 2 diabetes mellitus, has shown to be a promising approach in adults with hematological malignancies after umbilical cord blood (UCB) hematopoietic cell transplant (HCT). Based on data from this clinical trial, a semi-mechanistic model was developed to simultaneously describe DPP4 activity after multiple doses of sitagliptin in subjects with hematological malignancies after a single-unit UCB HCT.
Methods
The clinical study included 24 patients that received myeloablative conditioning followed by 4 oral sitagliptin 600mg with single-unit UCB HCT. Using a nonlinear mixed effects approach, a semi-mechanistic pharmacokinetic/pharmacodynamic model was developed to describe DPP4 activity from this trial data using NONMEM 7.2. The model was used to drive Monte-Carlo simulations to probe various dosage schedules and the attendant DPP4 response.
Results
The disposition of sitagliptin in plasma was best described by a 2-compartment model. The relationship between sitagliptin concentration and DPP4 activity was best described by an indirect response model with a negative feedback loop. Simulations showed that twice a day or three times a day dosage schedules were superior to once daily schedule for maximal DPP4 inhibition at the lowest sitagliptin exposure.
Conclusion
This study provides the first pharmacokinetic/pharmacodynamic model of sitagliptin in the context of HCT, and provides a valuable tool for exploration of optimal dosing regimens, critical for improving time to engraftment in patients after UCB HCT.
1 Introduction
Sitagliptin is a dipeptidylpetidase-4 (DPP4) inhibitor approved for use in type 2 diabetes mellitus. DPP4 inhibition leads to decreased cleavage of endogenous incretins, indirectly improving glucose homeostasis [1]. However, DPP4, also known as CD26, truncates other endogenous proteins, including the cytokine stromal-derived factor-1α (SDF-1α), which in combination with its receptor CXCR4 plays a critical role in chemotaxis and engraftment of hematopoietic stem/progenitor cells [2–4] as well as for colony stimulating factors, which are growth factors for hematopoiesis [5].
The use of Umbilical Cord Blood (UCB) in Hematopoietic Cell Transplant (HCT) has been limited due to delayed engraftment resulting in increased morbidity and mortality [6–8]. Pre-clinical studies in mice have shown inhibition of DPP4 enhances stem cell engraftment [5]. A recent trial investigated the feasibility, safety, and potential efficacy of systemic inhibition of DPP4 using sitagliptin to enhance engraftment of single unit UCB transplants in adults with hematological malignancies (clinical trial NCT00862719) [9]. While prior studies, summarized in Table 1 [9–17], have extensively explored the pharmacokinetics of sitagliptin and DPP4 inhibition, this had not been done in a population of recipients undergoing a HCT [10, 11, 14–17]. Surprisingly, this trial [9] did not achieve the reported sustained inhibition of plasma DPP4 activity, greater than 90% plasma DPP4 inhibition for 24 hours in healthy volunteers [10, 15]. In the HCT population sitagliptin exposure, as measured by Cmax and AUC0-∞, was approximately half that previously observed in non-HCT populations. These differences highlight the need for a quantitative description of sitagliptin pharmacokinetics and DPP4 inhibition during HCT.
Table 1.
Sitagliptin pharmacokinetic parameters already published in the literature.
| Dose (mg) | AUC0-∞ (ng·h/mL) | Cmax (ng/mL) | Reference |
|---|---|---|---|
| 600 OD | 22772.81 a | 3156.65 | Bergman, A.J. et al. [10] |
| 600 OD | 22402.05 | 3437.7 | Herman, G.A. et al. [11] |
| 83 OD | 2460.15 | 309.14 | Vincent, S.H. et al. [12] |
| 100 OD | 2407.23 | 383.17 | Kim, B.H. et al. [13] |
| 100 OD | 3523.23 | 390.61 | Herman, G.A. et al. [14] |
| 100 OD | 3217.74 | 332.77 | Bergman, A. et al. [17] |
| 200 BID | 5987.45 b | 928.66 | Herman, G.A. et al. [16] |
| 100 OD | 3470.28 | 386.94 | Bergman, A. et al. [15] |
| 600 OD | 11661 | 1690 | Farag, S.S. et al. [9] |
AUC0-∞, area under the concentration-time curve to infinite time; Cmax, maximum concentration; OD, once daily; BID, bis in die –twice a day.
AUC0-24;
AUC0-12
Population pharmacokinetic-pharmacodynamic models can facilitate the clinical development of DPP4 inhibition for the acceleration of engraftment. Based on data from a pilot UCB HCT study in adult patients with leukemia and lymphoma [9], we have developed a semi-mechanistic model simultaneously describing sitagliptin pharmacokinetics and DPP4 activity after multiple doses of sitagliptin. The model-based approach to understanding sitagliptin concentration and DPP4 activity provides opportunity to explore and optimize dose and schedule for this novel approach to enhance engraftment of UCB cells from a single UCB unit in adult patients.
2 Methods
2.1 Study design
The full details of the clinical trial are presented in Farag et al. [9] but salient design issues to the trial are as follows. The trial was approved by the Indiana University Institutional Review Board and was registered at ClinicalTrials.gov (NCT00862719). All patients gave written informed consent. Twenty four adult patients with advanced hematologic malignancies, Karnofsky performance status ≥70, with adequate end-organ function, but lacking HLA-identical or well-matched unrelated donors were enrolled in the clinical trial. The preparative regimen consisted of 13.2 Gy total body irradiation in 8 fractions days −7 to −4, cyclophosphamide 60 mg/kg days −3 to −2, and rabbit antithymocyte globulin (ATG) 2.5 mg/kg days −4 to −2. After 11 patients were recruited, ATG was replaced with fludarabine 30 mg/m2 days −4 to −2. Single units of UCB were infused on day 0. Prophylaxis of graft-versus-host disease was with sirolimus and tacrolimus. Filgastrim 5 g/kg/day was administered subcutaneously day +5 until neutrophil recovery. Sitagliptin, 600 mg once daily (OD), was administered days −1 to +2.
Sampling for blood to measure sitagliptin plasma concentrations and plasma DPP4 activity were taken at baseline, 0.5, 1, 2, 4, 8, 12, 16, and 24 hours after the first dose, and at 2, 4, 8, 16 and 24 hours after the second, third and fourth dose. Sitagliptin concentrations were assayed by high-turbulence liquid chromatography online extraction method and detected by mass spectroscopy (API 4000, Applied Biosystems, Toronto, Canada) using selected reaction monitoring with turbo-ionspray interface in positive ion mode. Plasma DPP4 activity was assayed using the DPPIV-Glo Protease Assay (Promega, Madison, WI, USA), according to manufacturer’s instructions. More details regarding the bioanalytical assay are presented in the electronic supplementary material.
2.2 Data analysis
Population modeling of sitagliptin concentrations and DPP4 inhibition was performed in NONMEM version 7.2 (Icon Development Solutions, Hanover, Maryland, USA) using the First Order Conditional Estimation method with the INTERACTION option implemented. Pharmacokinetic and pharmacodynamic analyses were performed simultaneously. Between subject variability (BSV) was modeled using exponential functions. Statistical significance was set at p<0.01.
2.2.1 Model selection/evaluation
Selection between models was based on visual inspection of goodness of fit plots, including conditional weighted residuals, CWRES [18] and predictive checks, the objective function value and the precision of the parameter estimates. The minimum value of the objective function provided by NONMEM, which is approximately equal to −2 log likelihood (-2LL), served as a guide during model design. A decrease in −2LL of 6.63 points for one additional model parameter, was regarded as a significant model improvement corresponding to p-value of 0.01 for nested models. For non-nested models the Akaike information criteria (AIC), calculated as , where NP is the number of parameter in the model, was used [19]. Precision of parameter estimates expressed as 5th to 95th percentiles were computed from the analysis of 200 bootstrap data sets (sampling with replacement). The bootstrap analysis was performed using Perl-speaks-NONMEM [20]. Model parameter estimates were presented together with the corresponding relative standard error [RSE(%)], as a measure of parameter imprecision, which were computed from the results obtained from bootstrap analysis. The quantified BSV was expressed as coefficient of variation [CV(%)]. Model performance was evaluated with visual predictive checks (VPC) and numerical predictive checks (NPC). Predictive checks were performed using MATLAB environment (The Mathworks, Natick, MA, USA).
The VPC was performed as follows. Two hundred simulated studies were simulated with the same design characteristics as the original study. At each time observation point the 2.5, 50 and 97.5th percentiles of sitagliptin plasma concentration (Cp) and DPP4 activity were calculated for every simulated study. Then, the 95% predicted interval for the three percentiles (2.5, 50 and 97.5th) was calculated and represented over time together with the raw data.
The NPC was performed as follows. Two hundred simulated studies were simulated with the same design characteristics as the original study. The median and 2.5 and 97.5th percentiles were calculated for the following pharmacokinetic- pharmacodynamic descriptors: (i) pharmacokinetics descriptors: Cmax(0-24h), Cmax(24-48h), Cmax(48-72h), Cmax(72-96h) (ng/mL), sitagliptin AUC<24h, AUC<48h, AUC<72h and AUC<96h (ng h/mL); (ii) pharmacodynamics descriptors: the minimum DPP4 activity level Nadir0-24h, Nadir24-48h, Nadir48-72h, Nadir72-96h (relative light units - RLU), DPP4 AUC<24h, AUC<48h, AUC<72h and AUC<96h (RLU h). Then, the results were compared with the corresponding percentiles obtained from the raw data. Mismatching of these numerical descriptors (predicted and observed values) might help to identify possible model misspecifications.
2.2.2 Pharmacokinetic/pharmacodynamic modelling
Disposition of sitagliptin in plasma was described with compartmental models parameterized in apparent volumes of distribution, inter-compartmental clearances, and total elimination clearance. Selection was made between one-, two-, and three-compartment models.
The following two steps were followed to establish the pharmacokinetic/pharmacodynamic model: baseline model and drug effect model.
-
Step 1: Baseline model. DPP4 activity (unbound) was best described by one ordinary differential equation (eq.1):
(1) where ksyn (zero order) and kdeg (first order) are the synthesis and degradation rates, respectively. During homeostasis this system remains in equilibrium, thus:(2) where DPP40 is the baseline value for DPP4 (homeostatic value).
-
Step 2: Drug effect. Sitagliptin is a competitive, reversible and potent inhibitor of DPP4. Initially, simple pharmacodynamic models were evaluated including a direct response model, linear effect-concentration-response model, log-linear effect-concentration model and Emax models (with and without sigmoidicity - hill exponent different from 1). Since DPP4 is a factor that is endogenously produced and eliminated, the indirect response model structures were also assessed. More specifically, three strategies were evaluated using this class of models to reflect the observed decrease in DPP4 activity with drug administration. These strategies were to: (i) inhibit the input [ksyn], (ii) stimulate the output [kdeg DPP4(t)] or (iii) both effects simultaneously. The three of them were explored and evaluated using changes in the OFV. In the selected model, binding between sitagliptin and DPP4 affects the output rate (eq.3).
(3) where Edrug is increasing hill function (eq. 4) of the sitagliptin CP:(4) where Emax is the maximum effect; EC50 is the drug concentration necessary to achieve 50% of the Emax, and h hill exponent (the sigmoid degree).
In order to describe an observed rebound of DPP4 activity following recovery from sitagliptin-mediated inhibition a delayed negative feedback loop (eq. 6) had to be included:
| (5) |
| (6) |
where kf regulates the delay of the feedback loop and γ the effect in it after changes in the DPP4activity. Fig. 1 shows the schematic representation of the semi- mechanistic population pharmacokinetic/pharmacodynamic model of sitagliptin effect on DPP4 for patients who underwent umbilical cord blood transplantation.
Fig. 1.

Schematic representation of the selected pharmacokinetic/pharmacodynamic model. Pharmacokinetics: ka, first order rate constant of absorption; VC/F, and VP/F, apparent volumes of distribution of the central and the peripheral compartments, respectively; CL/F apparent plasma clearance (oral); Q/F, inter-compartmental distribution clearance. pharmacodynamics: DPP4 activity (free receptor) can be synthesized at a zero-order rate (ksyn) and degraded at a first-order (kdeg). Edrug induces activity loss by the receptor binding. CP, predicted sitagliptin plasma concentration; Emax is the maximum effect; EC50 is the drug concentration need to achieve the 50% of the Emax; h is the hill exponent. 1/kf represents the expected time delay for the feedback.
2.3 Dose regimen exploration: Methods
Dose exploration was based on the simulation of one thousand patients at each of the following doses: 50, 100, 200, 400, 600, 800, 1000 and 1200mg once daily (OD). Regimen exploration was based on the simulation of one thousand patients dosed at 600 mg at each of the following schedules: OD, twice daily (BID), three times daily (TID) and four times daily (QID).
2.4 Dose regimen optimization: Methods
Mathematical optimization is the selection of the conditions (in this instance, dosing regimen) to maximize achieving a set of criterion. Sitagliptin DPP4 inhibition can be maximized by increased frequency of administration and/or bigger doses. However, this produces an incrementally increased risk of side effects and toxicity. Therefore, the criterion defined were the minimum bi-dimensional space of DPP4 AUC0-24h and sitagliptin AUC0-24h. Using different simulated dosing schemes, both descriptors were calculated and faced in a scatter plot. The optimal dose was defined as the dose whose Euclidean distance to the origin ([0, 0]) is minimized. Population simulations were generated using different doses from 100 mg to 1200mg in increments of 100 mg for OD, BID, TID and QID regimens. Sitagliptin Cmax, AUC0-24h and DPP4 AUC0-24h were calculated for every dose/scheme.
3 Results
3.1 Pharmacokinetic model
Disposition of sitagliptin in plasma was best described by a 2-compartment model, with drug absorption as a first order rate constant. Lag in absorption was not supported by the data. BSV was significant for the apparent total plasma clearance (CL/F), apparent volume of distribution in the central compartment (VC/F), apparent volume of distribution in the peripheral compartment (VP/F), and relative bioavailability (F), which typical value was fixed to 1 (p<0.01). No pharmacokinetic parameters were time or dose dependent. Covariance between random effects associated to the pharmacokinetics was not significant. Covariate effects were not explored. Table 2 lists the parameter estimates corresponding to the selected pharmacokinetic model, together with the corresponding 90% confidence interval obtained from the nonparametric bootstrap analysis. None of the confidence intervals included zero. -shrinkage (%) was 24.3 (CL/F), 18.41 (VC/F), 14.27 (VP/F), and 4.67 (F); -shrinkage was 4.38%. Individual model predictions with the corresponding patient observations of sitagliptin plasma concentrations are plotted in Fig. S1 (electronic supplementary material). Fig. 2 (top) shows the goodness of fit plots, which indicate the selected model properly describes the sitagliptin observations. Similar results were obtained from the numeric predictive check (NPC) (see Table 3). The calculated percentiles of all pharmacokinetic descriptors (Cmax(0-24h), Cmax(24-48h), Cmax(48-72h), Cmax(72-96h), sitagliptin AUC<24h, AUC<48h, AUC<72h and AUC<96h) from the simulated data were very similar to the corresponding percentiles calculated from the raw data (Table 3). Fig. 3A, the visual predictive check (VPC) corresponding to the four days treatment, shows that both typical profiles and data dispersion were captured well by the model.
Table 2.
Population pharmacokinetic/pharmacodynamic parameter estimates
| Parameters | Estimate (RSE%) | ISV (RSE%) | Bootstrap analysis Median [5
– 95th percentiles] |
|
|---|---|---|---|---|
| Estimate | BSV | |||
| CL/F (L/h) | 84.79 (11.91) | 36.55 (51.16) | 79.48 [64.33 – 98.44] | 36.18 [17.26 – 49.99] |
| VC/F (L) | 176.43 (16.39) | 63.19 (60.85) | 169 [125.89 – 223.47] | 62.02 [28.11 – 99.19] |
| ka (h−1) | 0.22 (7.47) | 0.22 [0.20 – 0.25] | ||
| Q/F (L/h) | 14.29 (13.25) | 13.14 [10.47 – 16.45] | ||
| VC/F (L) | 217.62 (13.19) | 41.53 (44.80) | 207.51 [160.11 – 249.82] | 40.71 [26.14 – 56.78] |
| F | 1 FIXED | 85.70 (38.37) | 84.56 [46.72 – 107.44] | |
| Residual error [log(ng/mL)]a | 0.70 (17.66) | 0.70 [0.51 – 0.93] | ||
|
| ||||
| DPP40 (RLU) | 3573.82 (5.83) | 20.12 (60.71) | 3608 [3239 – 3932] | 19.53 [1.34 – 28.20] |
| ksyn(h−1) | 3924.63 (13.07) | 56.60 (43.95) | 3788 [2963 – 4481] | 54.25 [25.43 – 75.93] |
| kf (h−1) | 0.06 (21.43) | 0.06 [0.05 – 0.09] | ||
| Emax (unitless) | 7.64 (17.43) | 7.32 [5.78 – 9.93] | ||
| EC50 (ng/mL) | 353.88 (21.56) | 102.17 (38.39) | 357.57 [296.57 – 530.99] | 101.33 [54.53 – 129.86] |
| h (unitless) | 1.76 (9.95) | 1.75 [1.48 – 2.05] | ||
| (unitless) | 0.80 (16.98) | 0.79 [0.63 – 1.06] | ||
| Cov(2EC50, 2F) | 86.08 (44.22) | 85.04 [31.65 – 110.50] | ||
| Residual error [log(RLU)]a | 0.20 (11.12) | 0.20 [0.16 – 0.24] | ||
Additive error model in log scale
All parameters were simultaneously estimated and listed here twith their corresponding relative standard error (RSE%); BSV, between subject variability expressed as coefficient of variation (%). CL/F, total apparent oral clearance; VC/F and VP/F, apparent volumes of distribution of the central, and peripheral compartments, respectively; ka, first order rate constant of absorption; Q/F inter-compartmental distribution clearances between the central and peripheral compartment; F, oral bioavailability; DPP40, baseline value for DPP4 activity; ksyn, synthesis rate of DPP4; kf regulates the delay of the feedback loop; Emax, maximum effect; EC50, the drug concentration necessary to achieve 50% of the Emax; h, hill exponent; γ, feedback exponent; 2, variance.
Fig. 2.
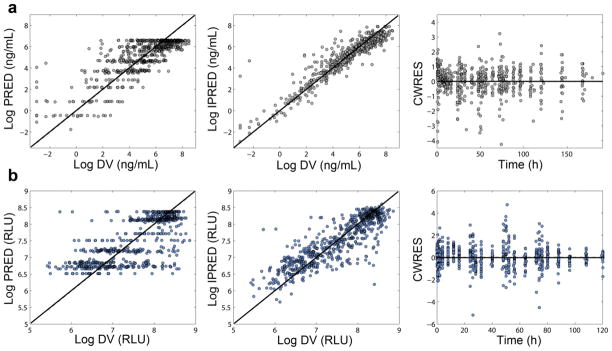
Goodness-of-fit plots corresponding to the selected population pharmacokinetic/pharmacodynamic model. Sitagliptin plasma concentrations (a) and DPP4 activity (b). IPREDs = individual model predictions; DV = observed concentrations; CWRES = Conditional Weighted Residuals.
Table 3.
Numerical Predictive Check of sitagliptin pharmacokinetic descriptors
| PK descriptor | Observeda | Simulateda |
|---|---|---|
|
| ||
| Log AUC<24h (ng·h/mL) | 9.23 (6.56–10.29) | 8.79 (7.03–10.58) |
| Log AUC<48h (ng·h/mL) | 9.73 (7.34–10.85) | 9.41 (7.53–11.26) |
| Log AUC<72h (ng·h/mL) | 9.86 (7.72–11.32) | 9.79 (7.86–11.66) |
| Log AUC<96h (ng·h/mL) | 10.05 (8.09–11.71) | 10.05 (8.00–11.96) |
|
| ||
| Log Cmax(0-24h) (ng/mL) | 7.50 (4.80–8.46) | 6.55(4.83–8.32) |
| Log Cmax(24-48h) (ng/mL) | 6.85 (3.69–8.43) | 6.27 (2.56–8.26) |
| Log Cmax(48-72h) (ng/mL) | 6.72 (3.83–7.92) | 6.27 (2.56–8.28) |
| Log Cmax(72-96h) (ng/mL) | 6.67 (3.25–8.48) | 6.34 (2.58–8.30) |
Values are expressed as median (2.5th–97.5th percentiles)
AUC<xh, area under the plasma drug concentration time curve from 0h to xh; Cmax(i-jh), maximum plasma concentration from ih to jh.
Fig. 3.
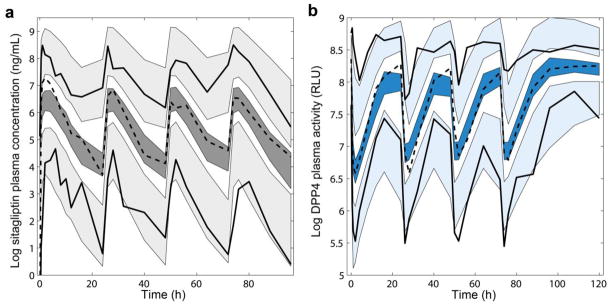
Visual Predictive Checks (VPC). Results from 200 simulated studies. Shaded area corresponds to the 95% prediction interval of the 2.5th, 50th and 97.5th percentiles. Dashed lines represent the mean of the raw data profiles; solid lines the 2.5th and 97.5th percentile. (a) VPC for the pharmacokinetics (grey): sitagliptin plasma concentrations in log scale. (b) VPC for the pharmacodynamics (blue): DPP4 plasma activity (relative light units - RLU) in log scale.
3.2 Pharmacokinetic/pharmacodynamic model
Fig. 1 shows the schematic representation of the selected semi-mechanistic population pharmacokinetic/pharmacodynamic model of sitagliptin effect on DPP4 for patients who underwent umbilical cord blood transplantation. While other drug effect models were explored (see methods), a binding process between sitagliptin and DPP4 affecting the output rate best described the observations. The inclusion of a negative feedback loop was strongly supported by the observed data, although not previously reported in the literature (p<0.01). BSV was identified for DPP40, ksyn and EC50.
Table 2 also list the parameter estimates corresponding to the pharmacodynamic model and the corresponding 90% confidence interval obtained from the nonparametric bootstrap analysis. None of the confidence intervals included zero. -shrinkage (%) was 20.31 (DPP40), 12.53 (ksyn), and 4.27 (EC50); -shrinkage was 5.07 %. Inclusion of covariance (positive correlation) between the random effect associated to EC50 and the bioavailability (F) parameter significantly improved the objective function value (-2LL). Individual model predictions and observed DPP4 levels for every patient are plotted in Fig. S2 (electronic supplementary material). Fig. 2 (bottom) shows the goodness of fit plots for the selected model. Results from the NPC are shown in table 4. The calculated percentiles of all pharmacodynamic descriptors (Nadir0-24h, Nadir24-48h, Nadir48-72h, Nadir72-96h, DPP4 AUC<24h, AUC<48h, AUC<72h and AUC<96h) from the simulated data were very similar to the corresponding percentiles calculated from the raw data (Table 4). Fig. 3B, the VPC corresponding to DPP4 values during the period of treatment, show that typical profiles and data dispersion were accurately captured by the model.
Table 4.
Numerical predictive check of sitagliptin pharmacodynamic (DPP4 activity)
| PD descriptor | Observeda | Simulateda |
|---|---|---|
|
| ||
| Log AUC<24h (RLU·h) | 11.01 (10.45–11.47) | 10.86 (10.04–11.42) |
| Log AUC<48h (RLU·h) | 11.64 (11.28–12.11) | 11.57 (10.79–12.11) |
| Log AUC<72h (RLU·h) | 12.09 (11.58–12.52) | 11.99 (11.22–12.53) |
| Log AUC<96h (RLU·h) | 12.31 (11.90–12.80) | 12.29 (11.53–12.82) |
|
| ||
| Log Nadir0-24h (RLU) | 6.30 (5.51–7.88) | 6.57 (5.61–7.48) |
| Log Nadir24-48h (RLU) | 6.47 (5.50–7.11) | 6.82 (6.09–7.55) |
| Log Nadir48-72h (RLU) | 6.53 (5.49–7.36) | 6.84 (6.12–7.55) |
| Log Nadir72-96h (RLU) | 6.55 (5.47–7.83) | 6.85 (6.12–7.56) |
Values are expressed as median (2.5th–97.5th percentiles)
AUC<xh, area under the DPP4 activity time curve from 0h to xh; Nadiri-jh, minimum DPP4 activity level from ih to jh.
Inter occasion variability was evaluated but no tendency or differences were found in any of the model parameters including no change in the objective function value. Data exploration showed no variability or tendency within the four days of DPP4 inhibitor administration (Table 3 and Table 4).
3.3 Dose regimen exploration
Fig. 4 shows the relationship described by the model (eq. 4) between sitagliptin plasma concentration and drug effect in percentage. At the dose of 600mg (dose utilized in the first phase of the clinical trial), the predicted maximum concentration after one single dose produced almost 80% of the maximum possible drug effect. Simulated maximum concentrations reached by other doses (50, 100, 200, 400, 800, 1000 and 1200 mg) were also indicated in Fig. 4.
Fig. 4.

Drug effect. Relationship between the plasma concentration and the drug effect in percentage defined in the equation 4 (see methods). Squares identify the maximum concentration reached after the 50, 100, 200, 400, 600, 800, 1000 and 1200 mg doses.
Four different pharmacokinetic/pharmacodynamic descriptors were calculated from model simulations changing the dose amount and schedule of drug administration: (i) pharmacokinetics: Cmax(0-24h) (ng/mL) and sitagliptin AUC0-24h (ng h/mL); (ii) pharmacodynamics: Nadir0-24h (relative light units - RLU) and DPP4 AUC0-24h (RLU h).
Fig. 5 shows dose-dependent changes in these descriptors from one thousand simulated individuals at each of the following doses: 50, 100, 200, 400, 600, 800, 1000 and 1200mg OD. Increasing the dose up to 1200mg OD, sitagliptin Cmax(0-24h) increased by 84.34% and AUC0-24h increased by 81.01%, with respect to the reference dose of 600mg OD; DPP4 activity minimum value, Nadir0-24h, decreased 17.08%; and DPP4 area under the curve, AUC0-24h, diminished by18.77%. Fig. 6 shows the schedule-dependent changes in the same descriptors based on one thousand simulated individuals dosed at 600 mg at each of the following schedules: OD, BID, TID and QID (x-axis). With BID dosing (1200mg total daily dose) sitagliptin Cmax(0-24h) increased by 17.86%, and sitagliptin AUC0-24h increased by 90.10%, maximum DPP4 suppression (Nadir0-24h) remained similar (increased by 4.24%) and the DPP4 AUC0-24h decreased by 41.34%, compared to a reference schedule of 600mg OD. Fig. S3 (electronic supplementary material) shows this same analysis for a 200mg dose. Due to the linearity of pharmacokinetics, the increments for Cmax(0-24h) and sitagliptin AUC0-24h were similar to the 600mg dose. However, DPP4 AUC0-24h diminished only by 41.34%.
Fig. 5.
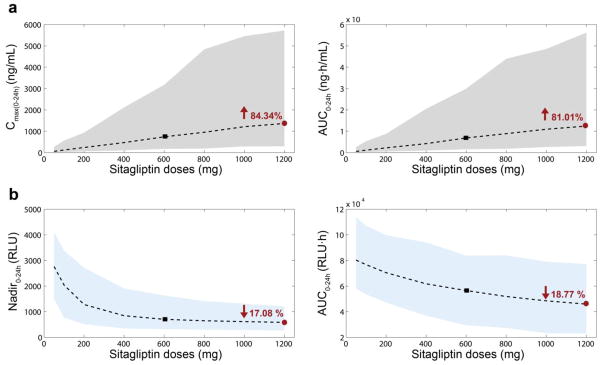
Changes in pharmacokinetic/pharmacodynamic descriptors depending on the dose amount. One thousand individuals were simulated per dose. Doses simulated were 50, 100, 200, 400, 600, 800, 1000 and 1200mg (X axis). Two pharmacokinetic descriptors were calculated (a): Cmax(0-24h) (ng/mL) (left) and AUC0-24h (ng·h/mL) (right). Two pharmacodynamic descriptors were calculated (b): Nadir0-24h (RLU) (left) and AUC0-24h (RLU·h) (right). Shaded areas correspond to the 90% prediction interval for the pharmacokinetics (grey) and the pharmacodynamics (blue) descriptors. Dashed lines represent the medians. Black squares indicate the median values for the reference dose −600mg (OD). Red circles correspond to twice the reference dose −1200mg (OD); values in red are the corresponding increment/decrement (%) with respect to the reference dose (black square). AUC0–24 area under the concentration time curve from 0 to 24 h, Cmax(0–24h) maximum concentration from 0 to 24 hours, OD once daily, RLU relative light units
Fig. 6.

Changes in pharmacokinetic/pharmacodynamic descriptors depending on the number of doses per day. One thousand individuals were simulated per schedule. Doses simulated were 600 mg OD, BID, TID and QID. Two pharmacokinetic descriptors were calculated (a): Cmax(0-24h) (ng/mL) (left) and AUC0-24h (ng·h/mL) (right). Two pharmacodynamic descriptors were calculated (b): Nadir0-24h (RLU) (left) and AUC0-24h (RLU·h) (right). Shaded areas correspond to the 90% prediction interval for the pharmacokinetics (grey) and the pharmacodynamics (blue) descriptors. Dashed lines represent the medians. Black squares indicate the median values for the reference dose −600mg OD. Red circles correspond to twice the reference dose −600mg BID; values in red are the corresponding increment/decrement (%) with respect to the reference dose. AUC0–24 area under the concentration time curve from 0 to 24 h, BID twice daily, Cmax(0–24h) maximum concentration from 0 to 24 hours, OD once daily, QID four times daily, RLU relative light units, TID three times daily
3.4 Dose regimen optimization
Population simulations of different dose and schedules were performed to maximize DPP4 inhibition (DPP4 AUC0-24h) while minimizing drug exposure (sitagliptin AUC0-24h), based on the assumption that sitagliptin Cmax0-24h serves as the main indirect biomarker for adverse effects and DPP4 inhibition AUC0-24h for desired effects. Fig. 7 shows the dose-effect evaluation based on population simulations; different doses from 100 mg to 1200mg in increments of 100 mg for OD, BID, TID and QID schedules. Sitagliptin Cmax(0-24h) versus sitagliptin AUC0-24h (Fig. 7A) and DPP4 AUC0-24h versus sitagliptin AUC0-24h (Fig. 7B) were compared for the OD, BID, TID and QID schedules with the different doses. Due to the linearity of the pharmacokinetics, the relationship between sitagliptin AUC0-24h and Cmax(0-24h) for different doses of sitagliptin (doses from 100mg to 1200mg in increments of 100 mg OD, BID, TID and QID) is described by straight lines. Depending on the number of doses per day (OD, BID, TID and QID) their slopes change. That is, as the number of doses per day increases, the lines have higher slopes (Fig. 7A). There is a significant difference between the OD slope and the rest of the dosage frequencies. In other words, similar drug exposures - sitagliptin AUC0-24h - are achieved with significantly lower maximum plasma concentrations - Cmax(0-24h) - when the same amount of drug is administered as divided doses 2, 3 or 4 times per day. Comparing OD, BID, TID and QID regimes with same daily dose, the 1200mg daily doses for BID, TID and QID regimes produce the same Cmax(0-24h) as the OD 600mg daily dose, but the sitagliptin AUC0-24h (Fig. 7A) is doubled compared to OD dosing. Interestingly daily doses of 600mg using BID, TID and QID regimes produce similar sitagliptin AUC0-24h to the OD 600mg dose but the DPP4 AUC0-24h decreases by approximately by 33% using BID, TID or QID (Fig. 7B).
Fig. 7.
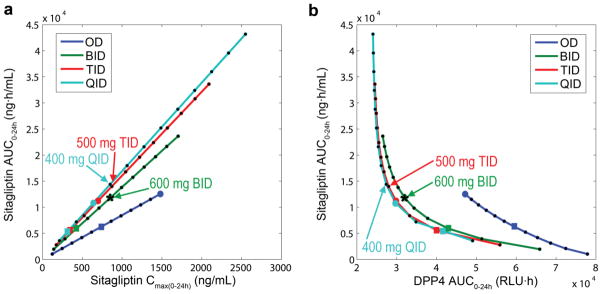
Evaluation of dose effect. Population simulations were performed for different doses from 100 mg to 1200mg, in increments of 100 mg, administered one (OD, blue), two (BID, green), three (TID, red) and four (QID, light blue) times daily. The non-simulated intermediate doses were calculated by means of a linear interpolation process. Squares represent daily doses of 600mg; big circles correspond to daily doses of 1200mg. (a) Sitagliptin Cmax(0-24h) (ng/mL) concentration versus sitagliptin AUC0-24h (ng·h/mL). (b) DPP4 AUC0-24h (RLU·h). versus sitagliptin AUC0-24h (ng·h/mL). Optimal dosages are (i) 500mg TID −1500mg daily dose, and (ii) 400mg QID −1600mg daily dose (indicated by arrows). The selected dose for the multicenter phase II trial, 600 mg BID, is marked with an asterisk. AUC0–24 area under the concentration time curve from 0 to 24 h, BID twice daily, Cmax(0–24h) maximum concentration from 0 to 24 hours, DPP4 dipeptidylpetidase-4, OD once daily, QID four times daily, RLU relative light units, TID three times daily
Mathematically, the optimal dosages (as defined by the Euclidean distances, please see methods) were 500mg TID −1500mg daily dose, and 400mg QID −1600mg daily dose. If we assume the number of doses per day as a third variable to be minimized, then the optimal dosage is 500mg TID −1500mg daily dose. It can be observed that the resulting DPP4 AUC is close to the mathematically optimal dosages.
4 Discussion
DPP4 cleaves a variety of endogenous proteins, regulating their activity [8, 21, 22]. Relevant to HCT, SDF-1α and several colony stimulating factors (eg. GM-CSF, G-CSF, IL-3, EPO) are regulated through DPP4 [2, 5, 23]. All play key roles in the production and engraftment of hematopoietic cells in the bone marrow. Therefore, inhibition of DPP4 activity is an appealing strategy to increase engraftment efficiency in patients undergoing HCT. This is particularly relevant when stem cell dose is limited, as is the case with UCB, where low cell dose has been shown to increase transplant related mortality and survival [24–26] and reviewed in [8, 27]. Based on preclinical data showing treatment of mice with sitagliptin enhanced hematopoietic stem cell and hematopoietic progenitor cell recovery in a comparable manner to DPP4-null mice [5], a clinical trial was initiated using oral sitagliptin in adult subjects undergoing single unit UCB HCT [9]. Clinical trial participants whose data informed this pharmacokinetic/pharmacodynamic model had a median time to engraftment of 21 days, shorter than the majority of single unit UCB HCT reported in the literature [9]. The results showed that sitagliptin can be successfully repurposed for a new clinical indication, e.g. that DPP4 inhibition may be a viable strategy to increase engraftment efficiency.
Sitagliptin is an FDA-approved selective DPP4 inhibitor with minimal toxicity [28]. The trial dose was based on data from healthy volunteers showing greater than 90% DPP4 activity inhibition at 24 hours following a single 600 mg dose [10]. However, in the HCT trial the observed DPP4 inhibition was less than anticipated with DPP4 activity returning to 80% or more of baseline activity by 16 hours. This emphasizes that in a different clinical context, clinical pharmacology of therapeutics can change. Therefore, we developed a population pharmacokinetic/pharmacodynamic model that described the relationship between sitagliptin plasma concentrations and DPP4 activity in patients with hematological malignancies after single unit UCB HCT in adult patients with leukemia and lymphoma.
The kinetics of sitagliptin have been studied extensively – a summary of pharmacokinetic parameters are presented in Table 1. Exposure, described by AUC0-24, and Cmax, in the non-HCT populations are approximately twice those observed in the HCT population. Similarly, clearance (dose/AUC0-∞) of sitagliptin in non-HCT populations is 50% lower than those found by Farag et al. [9]. Unlike prior populations, HCT patients are exposed to total body irradiation, high doses of chemotherapy, and a variety of other therapeutics to condition the patients for HCT, manage symptoms, mitigate risks, and prevent adverse consequences related to the transplant process, all of which may alter the way drugs behave in vivo [29–32]. This may be particularly important in relation to sitagliptin activity, given that large scale cell death following conditioning regimen cytotoxic therapy is associated with large increases in DPP4 release from dying cells. Similarly, it is likely that the physiologic and pathophysiologic processes and exposure to a number of concomitant medications can impact the absorption, distribution, metabolism, and elimination of sitagliptin. In healthy volunteers, sitagliptin has high bioavailability (87%), with absorption through both passive diffusion and active transport [17, 33, 34]. It has been previously shown that other oral drugs have significant changes in pharmacokinetics as a result of changes such as mucositis, alterations in albumin and other proteins, or alternation in drug metabolism or transport [35]. Once absorbed, there may be differences in protein binding. Sitagliptin has been previously shown to be 34–46% protein-bound[36], and in HCT, albumin frequently declines over the course of transplant – the total serum albumin levels in our study population were below normal (median=2.7 g/dL, normal range=3.2–5 g/dL). However, the effect of albumin (as a covariate) on the sitagliptin pharmacokinetics was not studied due to the design of the clinical trial. While metabolism plays a minor role in healthy volunteers and patients with type 2 diabetes mellitus sitagliptin disposition, with only 16% of administered dose being metabolized via CYP3A and 2C8 [35], it cannot be assumed that this remains the same in the HCT context. Elimination of sitagliptin is largely renal (87%), via both glomerular filtration and active secretion, both p-glycoprotein (MDR1/Pgp) and hOAT3 have been shown to transport sitagliptin [12, 33, 34]. Beyond the potential for more rapid filtration due to a higher free drug fraction, there are also large fluid shifts in HCT, as well as extensive use of diuretics, which may impact sitagliptin clearance.
This latter point touches on another set of salient differences between non-HCT and HCT populations in regards to sitagliptin disposition – the potential for drug-drug interactions. Clinically significant drug-drug interactions are a known concern in HCT. In addition to the chemotherapeutics of the preparative conditioning regimens, HCT patients are on a cocktail of antibiotics, antifungals, immunosuppressants, and other supportive care medications. In the pilot study by Farag et al. trial [9], such medications included cyclophosphamide, tacrolimus, sirolimus, fluconazole, acyclovir, and dexamethasone. Several of these drugs are known to have the potential for pharmacokinetic interactions at the level of metabolic enzymes and transporters. While it remains unclear if there are clinically significant interactions between these drugs and sitagliptin, there are studies showing some potential for drug interactions [33, 34]. Our pharmacokinetic/pharmacodynamic model does not mechanistically describe all these potential interactions, but accurately describe the profiles allowing for refinement and optimization of dose and schedule of sitagliptin in HCT. Fludarabine replaced ATG following the first 11 patients to reduce the risk of infection. As the data available were limited and the identity of those patients in the dataset not available to us, it was not possible to evaluate the effect of the replacement. In principle this should not impact the pharmacokinetics of sitagliptin, nor are any pharmacodynamic interactions between DPP4 and either fludarabine or ATG are reported in the literature.
Simulation based on this model was then used to explore optimal dosing strategies for sitagliptin in HCT to maximize both the extent and longevity of DPP4 inhibition. In mathematics, optimization is the selection of a best element with regard to some criterion from some set of available alternatives. Since sitagliptin is a DPP4 inhibitor, larger doses as well as more frequent administration of the drug during the day will produce higher DPP4 inhibition. Increments in the dose and the number of administrations also produce higher drug exposure which may increase the probability of an adverse drug reaction. In this study, we defined just one criterion for optimizing this trade-off. We developed a scatter plot comparing sitagliptin AUC and DPP4 AUC with different dosing schemes and identified the dosage regimen that resulted in responses closest to the origin [0,0]. Among the alternatives simulated with regard to latest criterion, we found two optimal dosages: (i) 500mg TID −1500mg daily dose, and (ii) 400mg QID −1600mg daily dose. It is notable that the selected dose for the multicenter phase II trial (600 mg BID), based on additional, unpublished, dosing cohorts defining maximal tolerated dose (MTD) clinically, is very close to the optimal solutions (Fig. 7). The trial dose going forward defined by the MTD is only 15% less than the mathematically predicted optimal predicted dose in terms of DPP4 inhibition.
Interestingly, beyond the intended clinical application of this model, some questions of basic biology were raised. While DPP4 is known to be expressed on the surface of hematopoietic cells as CD26, and as an active soluble form in plasma, the regulation of DPP4 expression is not fully characterized [21, 22, 37]. In order to capture the observed DPP4 activity in this trial, a feedback loop had to be incorporated to capture a rebound in DPP4 activity above baseline activity in the inter-dose intervals. While not previously reported in the literature, this feedback might represent a biological process in response to the rapid decline in DPP4 activity.
There are some limitations to the study conclusions that are secondary to the data characteristics used to build the models. There were a small number of patients and therefore BSV may not be as well defined, given the possibility that these individuals did not represent the full random distribution of disposition or response across individuals. Another limitation was the use of a single dosing cohort. The use of different doses provides very informative data for the model development, usually reducing the level of uncertainty and improving the precision of the parameter. Finally, a wide variety of disease subtypes were incorporated and given the small total number of individuals, it was impossible to adequately assess if there was a potential interaction between the disease kind/state, the pharmacokinetics of sitagliptin and the DPP4 response. Despite these limitations, sample size and limited dosing cohorts are not uncommon in dense pharmacokinetic trials, and we do not expect a systematic disease-pharmacokinetics or disease-pharmacodynamics interaction. In addition to these data and experiment driven limitations, there are some limitations arising from the modeling approach. The modeling approach is potentially limited by being only semi-mechanistic. For instance, while we have observed a feedback loop in DPP4 activity, to-date a mechanistic explanation of this loop has not been described, therefore this component of the model remains an empirical finding discovered during the model building process.
5 Conclusions
Sitagliptin pharmacokinetics in the HCT population are significantly lower (~50%) with respect to profiles already published in the literature. This difference, probably due to the clinical context, highlights the need for such quantitative analysis, a valuable tool for the exploration of more optimal doses. Therefore, the data of Farag et al. [9] and the reported model based analysis fills in critical clinical pharmacology information relevant to the repurposing of DPP4 inhibitors for this new indication. Further, based on model simulations, we explored dose regimes including OD, BID, TID and QID with 100 up to 1200mg, looking for an optimal dose and schedule to minimize DPP4 activity with minimal drug exposure (AUC). Our results indicate that the starting dose in the safety and tolerability clinical trial [9], i.e. 600mg OD, was an inefficient dose regimes. Indeed, any amount of dose administered once per day is inferior in terms of maximizing DPP4 inhibition at the same total daily number of milligrams. This highlights the necessity of increment the frequency of the administration at least to a BID schedule.
Supplementary Material
Acknowledgments
We thank the Disease and Therapeutic Response Modeling Program for the Clinical and Translational Sciences Institute (CTSI) at Indiana University and David R. Jones for useful comments on the bioanalytical assays. Analytical work was performed by the Clinical Pharmacology Analytical Core laboratory, a core laboratory of the Indiana University Melvin and Bren Simon Cancer Center supported by the National Cancer Institute grant P30 CA082709.
Footnotes
Conflicts of interest
N.V.M., S.D.C. and R.R.B. were supported through Eli Lilly and Company through the Indiana Clinical and Translational Sciences Institute (CTSI). S.M.-G. was supported as a predoctoral student on an underrepresented minority grant GM079657 and subsequently on T32 (H.E.B.) from the NIH. R.M.S. has no conflict of interest to declare. H.E.B. is a founder of Cord: Use Family Cord Blood Bank and serves on the medical scientific advisory board of the bank. Parts of these studies were supported by grants from the V Foundation for Cancer Research (S.S.F.), and Public Service multi-PI R01HL112669 from the National Institutes of Health (NIH) of the United States (H.E.B. and S.S.F.). RRB is the director of the Disease and Therapeutic Response Modeling Program funded through a gift from Eli Lilly & Co. to the Indiana CTSI.
References
- 1.Neumiller JJ. Clinical pharmacology of incretin therapies for type 2 diabetes mellitus: implications for treatment. Clin Ther. 2011 May;33(5):528–76. doi: 10.1016/j.clinthera.2011.04.024. [DOI] [PubMed] [Google Scholar]
- 2.Christopherson KW, 2nd, Hangoc G, Broxmeyer HE. Cell surface peptidase CD26/dipeptidylpeptidase IV regulates CXCL12/stromal cell-derived factor-1 alpha-mediated chemotaxis of human cord blood CD34+ progenitor cells. J Immunol. 2002 Dec 15;169(12):7000–8. doi: 10.4049/jimmunol.169.12.7000. [DOI] [PubMed] [Google Scholar]
- 3.Broxmeyer HE, Cooper S, Kohli L, Hangoc G, Lee Y, Mantel C, et al. Transgenic expression of stromal cell-derived factor-1/CXC chemokine ligand 12 enhances myeloid progenitor cell survival/antiapoptosis in vitro in response to growth factor withdrawal and enhances myelopoiesis in vivo. J Immunol. 2003 Jan 1;170(1):421–9. doi: 10.4049/jimmunol.170.1.421. [DOI] [PubMed] [Google Scholar]
- 4.Peled A, Petit I, Kollet O, Magid M, Ponomaryov T, Byk T, et al. Dependence of human stem cell engraftment and repopulation of NOD/SCID mice on CXCR4. Science. 1999 Feb 5;283(5403):845–8. doi: 10.1126/science.283.5403.845. [DOI] [PubMed] [Google Scholar]
- 5.Broxmeyer HE, Hoggatt J, O’Leary HA, Mantel C, Chitteti BR, Cooper S, et al. Dipeptidylpeptidase 4 negatively regulates colony-stimulating factor activity and stress hematopoiesis. Nat Med. 2012 Dec;18(12):1786–96. doi: 10.1038/nm.2991. [DOI] [PMC free article] [PubMed] [Google Scholar]
- 6.Brunstein CG, Setubal DC, Wagner JE. Expanding the role of umbilical cord blood transplantation. Br J Haematol. 2007 Apr;137(1):20–35. doi: 10.1111/j.1365-2141.2007.06521.x. [DOI] [PubMed] [Google Scholar]
- 7.Rocha V, Broxmeyer HE. New approaches for improving engraftment after cord blood transplantation. Biol Blood Marrow Transplant. 2010 Jan;16(1 Suppl):S126–32. doi: 10.1016/j.bbmt.2009.11.001. [DOI] [PubMed] [Google Scholar]
- 8.Broxmeyer HE, Farag SS, Rocha V. Thomas’ Hematopoietic Cell Transplantation. Wiley-Blackwell; 2013. Cord Blood Hematopoietic Cell Transplantation. In Press ed. [Google Scholar]
- 9.Farag SS, Srivastava S, Messina-Graham S, Schwartz J, Robertson MJ, Abonour R, et al. In Vivo DPP-4 Inhibition to Enhance Engraftment of Single-Unit Cord Blood Transplants in Adults with Hematological Malignancies. Stem Cells Dev. 2013 Apr 1;22(7):1007–15. doi: 10.1089/scd.2012.0636. [DOI] [PMC free article] [PubMed] [Google Scholar]
- 10.Bergman AJ, Stevens C, Zhou Y, Yi B, Laethem M, De Smet M, et al. Pharmacokinetic and pharmacodynamic properties of multiple oral doses of sitagliptin, a dipeptidyl peptidase-IV inhibitor: a double-blind, randomized, placebo-controlled study in healthy male volunteers. Clin Ther. 2006 Jan;28(1):55–72. doi: 10.1016/j.clinthera.2006.01.015. [DOI] [PubMed] [Google Scholar]
- 11.Herman GA, Stevens C, Van Dyck K, Bergman A, Yi B, De Smet M, et al. Pharmacokinetics and pharmacodynamics of sitagliptin, an inhibitor of dipeptidyl peptidase IV, in healthy subjects: results from two randomized, double-blind, placebo-controlled studies with single oral doses. Clin Pharmacol Ther. 2005 Dec;78(6):675–88. doi: 10.1016/j.clpt.2005.09.002. [DOI] [PubMed] [Google Scholar]
- 12.Vincent SH, Reed JR, Bergman AJ, Elmore CS, Zhu B, Xu S, et al. Metabolism and excretion of the dipeptidyl peptidase 4 inhibitor [14C]sitagliptin in humans. Drug Metab Dispos. 2007 Apr;35(4):533–8. doi: 10.1124/dmd.106.013136. [DOI] [PubMed] [Google Scholar]
- 13.Kim BH, Kim SE, Kang D, Lim KS, Kim JR, Jang IJ, et al. Pharmacokinetic-Pharmacodynamic Modeling of Biomarker Response to Sitagliptin in Healthy Volunteers. Basic Clin Pharmacol Toxicol. 2013 Mar 19; doi: 10.1111/bcpt.12068. [DOI] [PubMed] [Google Scholar]
- 14.Herman GA, Mistry GC, Yi B, Bergman AJ, Wang AQ, Zeng W, et al. Evaluation of pharmacokinetic parameters and dipeptidyl peptidase-4 inhibition following single doses of sitagliptin in healthy, young Japanese males. Br J Clin Pharmacol. 2011 Mar;71(3):429–36. doi: 10.1111/j.1365-2125.2010.03852.x. [DOI] [PMC free article] [PubMed] [Google Scholar]
- 15.Bergman A, Mistry GC, Luo WL, Liu Q, Stone J, Wang A, et al. Dose-proportionality of a final market image sitagliptin formulation, an oral dipeptidyl peptidase-4 inhibitor, in healthy volunteers. Biopharm Drug Dispos. 2007 Sep;28(6):307–13. doi: 10.1002/bdd.559. [DOI] [PubMed] [Google Scholar]
- 16.Herman GA, Bergman A, Liu F, Stevens C, Wang AQ, Zeng W, et al. Pharmacokinetics and pharmacodynamic effects of the oral DPP-4 inhibitor sitagliptin in middle-aged obese subjects. J Clin Pharmacol. 2006 Aug;46(8):876–86. doi: 10.1177/0091270006289850. [DOI] [PubMed] [Google Scholar]
- 17.Bergman A, Ebel D, Liu F, Stone J, Wang A, Zeng W, et al. Absolute bioavailability of sitagliptin, an oral dipeptidyl peptidase-4 inhibitor, in healthy volunteers. Biopharm Drug Dispos. 2007 Sep;28(6):315–22. doi: 10.1002/bdd.560. [DOI] [PubMed] [Google Scholar]
- 18.Hooker AC, Staatz CE, Karlsson MO. Conditional weighted residuals (CWRES): a model diagnostic for the FOCE method. Pharm Res. 2007 Dec;24(12):2187–97. doi: 10.1007/s11095-007-9361-x. [DOI] [PubMed] [Google Scholar]
- 19.Ludden TM, Beal SL, Sheiner LB. Comparison of the Akaike Information Criterion, the Schwarz criterion and the F test as guides to model selection. J Pharmacokinet Biopharm. 1994 Oct;22(5):431–45. doi: 10.1007/BF02353864. [DOI] [PubMed] [Google Scholar]
- 20.Lindbom L, Ribbing J, Jonsson EN. Perl-speaks-NONMEM (PsN)--a Perl module for NONMEM related programming. Comput Methods Programs Biomed. 2004 Aug;75(2):85–94. doi: 10.1016/j.cmpb.2003.11.003. [DOI] [PubMed] [Google Scholar]
- 21.Ou X, O’Leary H, Broxmeyer HE. Implications of DPP4 modification of proteins that regulate stem/progenitor and more mature cell types. Blood. 2013 May 1; doi: 10.1182/blood-2013-02-487470. [DOI] [PMC free article] [PubMed] [Google Scholar]
- 22.O’Leary H, Ou X, Broxmeyer HE. The role of dipeptidyl peptidase 4 in hematopoiesis and transplantation. Current opinion in hematology. 2013 Jul;20(4):314–9. doi: 10.1097/MOH.0b013e32836125ac. [DOI] [PMC free article] [PubMed] [Google Scholar]
- 23.Christopherson KW, 2nd, Hangoc G, Mantel CR, Broxmeyer HE. Modulation of hematopoietic stem cell homing and engraftment by CD26. Science. 2004 Aug 13;305(5686):1000–3. doi: 10.1126/science.1097071. [DOI] [PubMed] [Google Scholar]
- 24.Gluckman E, Rocha V, Boyer-Chammard A, Locatelli F, Arcese W, Pasquini R, et al. Outcome of cord-blood transplantation from related and unrelated donors. Eurocord Transplant Group and the European Blood and Marrow Transplantation Group. N Engl J Med. 1997 Aug 7;337(6):373–81. doi: 10.1056/NEJM199708073370602. [DOI] [PubMed] [Google Scholar]
- 25.Rubinstein P, Carrier C, Scaradavou A, Kurtzberg J, Adamson J, Migliaccio AR, et al. Outcomes among 562 recipients of placental-blood transplants from unrelated donors. N Engl J Med. 1998 Nov 26;339(22):1565–77. doi: 10.1056/NEJM199811263392201. [DOI] [PubMed] [Google Scholar]
- 26.Wagner JE, Barker JN, DeFor TE, Baker KS, Blazar BR, Eide C, et al. Transplantation of unrelated donor umbilical cord blood in 102 patients with malignant and nonmalignant diseases: influence of CD34 cell dose and HLA disparity on treatment-related mortality and survival. Blood. 2002 Sep 1;100(5):1611–8. doi: 10.1182/blood-2002-01-0294. [DOI] [PubMed] [Google Scholar]
- 27.Ballen KK, Gluckman E, Broxmeyer HE. Umbilical cord blood transplantation: the first 25 years and beyond. Blood. 2013 May 14; doi: 10.1182/blood-2013-02-453175. [DOI] [PMC free article] [PubMed] [Google Scholar]
- 28.Rosenstock J, Zinman B. Dipeptidyl peptidase-4 inhibitors and the management of type 2 diabetes mellitus. Curr Opin Endocrinol Diabetes Obes. 2007 Apr;14(2):98–107. doi: 10.1097/MED.0b013e3280a02f65. [DOI] [PubMed] [Google Scholar]
- 29.Jacobson P, Uberti J, Davis W, Ratanatharathorn V. Tacrolimus: a new agent for the prevention of graft-versus-host disease in hematopoietic stem cell transplantation. Bone Marrow Transplant. 1998 Aug;22(3):217–25. doi: 10.1038/sj.bmt.1701331. [DOI] [PubMed] [Google Scholar]
- 30.Jones RJ, Grochow LB. Pharmacology of bone marrow transplantation conditioning regimens. Ann N Y Acad Sci. 1995 Dec 29;770:237–41. doi: 10.1111/j.1749-6632.1995.tb31059.x. [DOI] [PubMed] [Google Scholar]
- 31.Nieto Y, Vaughan WP. Pharmacokinetics of high-dose chemotherapy. Bone Marrow Transplant. 2004 Feb;33(3):259–69. doi: 10.1038/sj.bmt.1704353. [DOI] [PubMed] [Google Scholar]
- 32.Przepiorka D, Devine S, Fay J, Uberti J, Wingard J. Practical considerations in the use of tacrolimus for allogeneic marrow transplantation. Bone Marrow Transplant. 1999 Nov;24(10):1053–6. doi: 10.1038/sj.bmt.1702032. [DOI] [PubMed] [Google Scholar]
- 33.Chu XY, Bleasby K, Yabut J, Cai X, Chan GH, Hafey MJ, et al. Transport of the dipeptidyl peptidase-4 inhibitor sitagliptin by human organic anion transporter 3, organic anion transporting polypeptide 4C1, and multidrug resistance P-glycoprotein. J Pharmacol Exp Ther. 2007 May;321(2):673–83. doi: 10.1124/jpet.106.116517. [DOI] [PubMed] [Google Scholar]
- 34.Krishna R, Bergman A, Larson P, Cote J, Lasseter K, Dilzer S, et al. Effect of a single cyclosporine dose on the single-dose pharmacokinetics of sitagliptin (MK-0431), a dipeptidyl peptidase-4 inhibitor, in healthy male subjects. J Clin Pharmacol. 2007 Feb;47(2):165–74. doi: 10.1177/0091270006296523. [DOI] [PubMed] [Google Scholar]
- 35.Duncan N, Craddock C. Optimizing the use of cyclosporin in allogeneic stem cell transplantation. Bone Marrow Transplant. 2006 Aug;38(3):169–74. doi: 10.1038/sj.bmt.1705404. [DOI] [PubMed] [Google Scholar]
- 36.Beconi MG, Reed JR, Teffera Y, Xia YQ, Kochansky CJ, Liu DQ, et al. Disposition of the dipeptidyl peptidase 4 inhibitor sitagliptin in rats and dogs. Drug Metab Dispos. 2007 Apr;35(4):525–32. doi: 10.1124/dmd.106.013110. [DOI] [PubMed] [Google Scholar]
- 37.Durinx C, Lambeir AM, Bosmans E, Falmagne JB, Berghmans R, Haemers A, et al. Molecular characterization of dipeptidyl peptidase activity in serum: soluble CD26/dipeptidyl peptidase IV is responsible for the release of X-Pro dipeptides. Eur J Biochem. 2000 Sep;267(17):5608–13. doi: 10.1046/j.1432-1327.2000.01634.x. [DOI] [PubMed] [Google Scholar]
Associated Data
This section collects any data citations, data availability statements, or supplementary materials included in this article.