Abstract
NuThrax™ (Anthrax Vaccine Adsorbed with CPG 7909 Adjuvant) (AV7909) is in development. Samples obtained in a Phase Ib clinical trial were tested to confirm biomarkers of innate immunity and evaluate effects of CPG 7909 (PF-03512676) on adaptive immunity. Subjects received two intramuscular doses of commercial BioThrax® (Anthrax Vaccine Adsorbed, AVA), or two intramuscular doses of one of four formulations of AV7909. IP-10, IL-6, and C-reactive protein (CRP) levels were elevated 24 to 48 hours after administration of AV7909 formulations, returning to baseline by Day 7. AVA (no CPG 7909) resulted in elevated IL-6 and CRP, but not IP-10. Another marker of CpG, transiently decreased absolute lymphocyte counts (ALC), correlated with transiently increased IP-10. Cellular recall responses to anthrax Protective Antigen (PA) or PA peptides were assessed by IFN-gamma ELISpot assay performed on cryopreserved PBMCs obtained from subjects prior to immunization and 7 days following the second immunization (study day 21). One-half of subjects that received AV7909 with low-dose (0.25 mg/dose) CPG 7909 possessed positive Day 21 T cell responses to PA. In contrast, positive T cell responses occurred at an 11% average rate (1/9) for AVA-treated subjects. Differences in cellular responses due to dose level of CPG 7909 were not associated with differences in humoral anti-PA IgG responses, which were elevated for recipients of AV7909 compared to recipients of AVA. Serum markers at 24 or 48 hours (i.e. % ALC decrease, or increase in IL-6, IP-10, or CRP) correlated with the humoral (antibody) responses 1 month later, but did not correlate with cellular ELISpot responses. In summary, biomarkers of early responses to CPG 7909 were confirmed, and adding a CpG adjuvant to a vaccine administered twice resulted in increased T cell effects relative to vaccine alone. Changes in early biomarkers correlated with subsequent adaptive humoral immunity but not cellular immunity.
Keywords: Max of 6, for indexing purposes, BioThrax®, Anthrax, vaccine, CPG 7909, T cell, cytokine
INTRODUCTION
NuThrax™ (Anthrax Vaccine Adsorbed with CPG 7909 Adjuvant) (AV7909) is a post-exposure prophylaxis (PEP) anthrax vaccine candidate being developed to accelerate the immune response and minimize the number of injections needed to confer protective immunity. AV7909 contains AVA bulk drug substance as a source of Protective Antigen (PA) immunogen, aluminum hydroxide, and the Toll-like Receptor 9 (TLR9) agonist CPG 7909 (PF-03512676). Administration of AV7909 stimulates the immune system to produce toxin-neutralizing antibodies directed to PA, a component of anthrax toxins [1]. Human CpG biomarkers can become the basis for in vitro assays that are useful during vaccine development.
Human serum biomarkers affected by CpG adjuvants include increased IP-10 and IL-6 [2], IL-12, MCP-1 and IFN-α [3] as well as enhanced antibody responses [1;4;5]. Also reported were transiently decreased absolute lymphocyte counts (ALC) and C-reactive Protein (CRP) after subcutaneous (SC) administration [3;6;19], in vitro interferon-gamma (IFN-γ) production by peripheral blood mononuclear cells (PBMC) obtained after in vivo CpG treatment [4], increased T cell expansion [7], increased circulating T cells and NK cells after intra-venous (IV) administration [6] and increased CD8+ T cells. In vitro responses to CpG2006 or CPG 7909 included enhanced IL-10, IL-6, IFN-γ [8], IL-8 [9] by human plasmacytoid dendritic cells, as well as increased PBMC production of IL-6, IL-10, IFN-α, IFN-γ, and IP-10 [9;10] and enhanced CD8+ T cells developed from PBMC [9;11].
The contributions of cell-mediated immune responses to the production of anthrax toxin-neutralizing antibodies remain to be defined. Although human T cell epitopes within the PA molecule, restricted by 2 different HLA allotypes were identified using tetramer guided epitope mapping [12;13], neither these epitopes nor other peptides have been tested previously for capacity to induce T cell recall responses in PBMC from recipients of anthrax vaccines.
As exploratory endpoints in the clinical trial designed to investigate the safety and immunogenicity of intramuscular (IM) administration of AVA formulated with CPG 7909 adjuvant [14], IP-10, IL-6, C-reactive protein (CRP), and ALC were evaluated in blood samples obtained from human AV7909 recipients and compared to AVA recipients. To investigate T cell responses to PA protein, PBMC samples from immunized subjects were re-stimulated in vitro with a mixture of predicted HLA class II restricted PA peptide epitopes or with recombinant PA (rPA) and were visualized as IFN-γ-producing cells using an enzyme-linked immunospot (ELISpot) technique. The potential correlations of these markers with subsequent serum IgG anti-PA responses (present manuscript), and toxin neutralizing antibody responses [14] were evaluated.
MATERIALS AND METHODS
Study Design
A randomized double-blinded clinical study (“EBS.AVA.201/DMID 10-0013”; Trial #NCT01263691) [14] was conducted in compliance with the Declaration of Helsinki and ICH guidelines, under an Investigational New Drug (IND) application. After the nature and possible consequences of the study were fully explained to subjects, informed consent was obtained. Four formulations of AV7909 contained either 0.5 mL or 0.25 mL of AVA with either 0.25 or 0.5 mg of CPG 7909. A full dose of AVA (0.5 mL) was administered as a comparator vaccine. Saline served as placebo vaccine. Table 1 lists vaccine formulations, doses, and sample sizes for each of 6 treatment groups, and an explanation if the sample size differed from the number of subjects who completed the study [14]. An equivalent number of male and female subjects were included across the arms of the study; demographic information is available in the Hopkins et al. paper [14].
Table 1.
Vaccine Formulations, Study Design and Number of Donor Samples
| Study Arm | AV7909 Formulation | Active Ingredients and Vaccine Amounts | Subjects per Arm (N) a | ELISpot Subjects per Arm b (N) | ELISA Subject Samples per Arm (N) |
|---|---|---|---|---|---|
| 1 | None | AVA 0.5 mL (BioThrax®) | 17 | 15 | 14–15 c |
| 2 | 1, or F1 | AVA 0.5 mL + CPG 7909 0.5 | 18 | 15 | 17 |
| 3 | 2, or F2 | AVA 0.5 mL + CPG 7909 0.25 | 17 | 15 | 16 |
| 4 | 3, or F3 | AVA 0.25 mL + CPG 7909 0.5 | 19 | 18 | 17–18 d |
| 5 | 4, or F4 | AVA 0.25 mL + CPG 7909 0.25 | 18 | 16 | 18 |
| 6 | None | None | 15 | 14 | 14–15 e |
The group sizes (n = 15 to 19) for samples used for determinations of early biomarkers were the same as number of enrolled subjects reported in [14], with the exception that a subject in Arm 1 was included for early biomarker determinations that did not continue in the study beyond Day 7.
ELISpot testing was performed using PBMC from blood collected on Days 0 and 21 if meeting criteria that Subject’s Day 0 and D21 samples passed Trypan blue viability.
One Subject’s ELISA samples were not available on Day 70.
One Subject’s ELISA samples were not available on Day 28.
One Subject’s ELISA samples were not available on Day 42.
Samples (101) were collected during subject visits at 0, 1, 2, and 7 days after the first dose of vaccine to evaluate CRP, IP-10, and IL-6 levels, as well as changes in ALC. Both CRP, measured with high-sensitivity nephelometry assay (Roche Diagnostics, Indianapolis, IN) and ALC (derived from the CBC) were performed commercially (ACM Global Laboratory, Rochester, NY). IP-10 and IL-6 ELISAs are described below. Cellular responses were evaluated 7 days after the second administration of vaccine. Antibody responses were evaluated to determine anti-PA IgG levels in serum samples collected on Day 0, 14, 28, 42, and 70 (this paper) and toxin-neutralizing antibody (TNA) levels [14].
IFN-γ enzyme-linked Immunospot assay (ELISpot)
Prior to the first vaccine dose, and 7 days after the second vaccine dose (study day 21), PBMC were isolated from venous blood samples, and stored in liquid nitrogen vapors at SeraCare Life Sciences (Gaithersburg, MD). For ELISpot controls: stimulants were Phytohaemmaglutinin (PHA; mitogen, control for viability, Sigma, St Louis, MO) and CEF I peptide pool (Cellular Technology Ltd; Shaker Heights, OH) representing HLA Class I-restricted peptides from cytomegalovirus, Epstein Bar virus and influenza virus (CEF). Recall antigens were rPA (Emergent BioSolutions, Gaithersburg, MD) or a pool of 10 PA-derived peptides (PAps) (ProImmune, Oxford, U.K.). Sequences for PAps were selected on the basis of 1) high binding scores calculated by SYFPEITHI [15] and PROPRED [16] in silico programs, 2) predicted binding by multiple HLA Class II types, 3) low hydrophobicity and 4) absence of cytotoxicity to naïve PBMC. Stimulation by PAp mixture was performed with a final concentration of 10 μg/mL of each peptide. PAp amino acid sequences and restricting HLA haplotypes are listed in Table 2.
Table 2.
Amino Acid Sequences of Predicted HLA Class II-restricted PA-derived Peptide Epitopes and the Restricting HLA Haplotypes
| Peptide Number | Amino Acid Sequence | Predicted HLA Class II preferences |
|---|---|---|
| 1 a | LGYYFSDLNFQAPMVVTSS | DRB1*01, DRB1*04, DRB1*11, DRB1*15 |
| 2 | TVDVKNKRTFLSPWI | DRB1*04, DRB1*08, DRB1*11, DRB1*13 |
| 3 a | SSTVAIDHSLSLAGE | DRB1*03, DRB1*15 |
| 4 a | NANIRYVNTGTAPIYNV | DRB1*01, DRB1*03, DRB1*04, DRB1*07, DRB1*08, DRB1*11, DRB1*13 |
| 5 | LDKIKLNAKMNILIR | DRB1*03, DRB1*11, DRB1*13 |
| 6 a | KMNILIRDKRFHYDR | DRB1*08, DRB1*11, DRB1*13 |
| 7 | RYDMLNISSLRQDGK | DRB1*04, DRB1*11, DRB1*13 |
| 8 | DKDIRKILSGYIVEI | DRB1*04, DRB1*07, DRB1*15 |
| 9 a | KLPLYISNPNYKVNV | DRB1*01, DRB1*03, DRB1*07, DRB1*11, DRB1*13 |
| 10 | ISSLRQDGKTFIDFK | DRB1*03, DRB1*11 |
This sequence, predicted independently with the in silico programs, is identical to or has significant sequence homology with published class-II restricted PA peptides [13], detected using tetramer staining.
PBMC were thawed in serum-free medium, re-suspended to a density of 1 to 2 x10⁶ viable cells/mL, rested overnight at 37°C, 5% CO2, recounted and adjusted to target viable cell densities. For IFN-γ ELISpot, stimulants and antigens (50 μL) were delivered to 96-well plates (SeraCare LifeSciences), followed by PBMC (50 μL per well, 300,000 cells; or 100,000 cells for PHA wells). Final volume per well was 100 μL. PHA was tested in duplicate wells and all others in triplicate. PBMC from a single-donor (SeraCare Cat. # 1074) which responded to CEF I stimulation with IFN-γ production, were included in every plate to assess experimental variability. After 40 to 48 hours of incubation, IFN-γ spot forming cells (SFC) were enumerated using an ELISpot plate reader (Cellular Technology Ltd). A specificity rate of 100% and a sensitivity rate of 79% were achieved using SFC counts at cut-off levels of ≥200 for PHA- and ≥15 for CEF I- stimulated cells. Specificity and sensitivity rates were lower if fewer SFC for PHA and CEF I were analyzed.
Cytokine ELISA
Serum samples obtained at study sites were stored at −70°C until assayed. Quantikine™ ELISA kits (R&D Systems, Minneapolis, MN) for IL-6 (HS600B) and IP-10 (DIP100) were obtained from single production lots. Positive controls were purchased and quantified and included on each plate. Log-transformed values of test samples were analyzed using linear regression and compared to a standard curve. Samples for a single subject obtained at several time-points were tested on the same ELISA plate.
Anti-PA IgG ELISA
ELISA plates (Nunc Maxisorp) were coated using rPA (1 μg/mL) for 2 to 5 days at 4°C. Test samples diluted into phosphate buffered saline (PBS) that contained 5% milk powder (DIFCO Laboratories, Detroit, MI) and 0.05% Tween 20 (PBSMT) were added and incubated for 1 hour at 37°C. Plates were washed using PBS with 0.5% Tween-20 (PBST), HRP anti-Human IgG (Kirkegaard and Perry Laboratories (KPL); Gaithersburg, MD) added, and incubated for 1 hour at 37°C, washed using PBST and developed using ABTS colorigenic substrate (KPL). Data were analyzed using a 4-parameter logistic fit, compared to Emergent’s reference antiserum that was qualified at Battelle Eastern Science and Technology (lot # BEST RS.EBS.001).
Statistical Analyses
For ELISpot analysis, PBMC samples were available for 94 subjects. ELISpot subjects were excluded that failed positive control stimulant cut-offs defined as a minimum of 15 CEF I SFC or 200 PHA SFC. Empirical definition of an antigen-specific positive response (for subjects not excluded per above criteria) was set at a minimum of 9 SFC in wells with rPA (or PAp) and at least two-fold higher than background (SFC counts in wells with medium alone). Scharp analysis [17] calculated the positive responder rates to PAp and rPA, using triplicate SFC counts entered online http://www.scharp.org/zoe/runDFR/. Scharp analyses are based on distribution-free random sampling (DFR) to increase the strength of the analysis. Those samples having ELISpot data for medium alone (negative control), PAp and rPA were included in the analysis for the Scharp analysis requirement of at least three treatments, tested in three or more replicates. The Suissa-Shuster Exact test [18] was performed to compare the response rate due to different dose levels of AVA and AV7909.
IP-10 and IL-6 results were analyzed by a General Linear model with post-hoc analysis using MANOVA. The Spearman’s rank correlation coefficient method was used to measure associations between biomarkers.
RESULTS
IP-10, IL-6, ALC and CRP levels
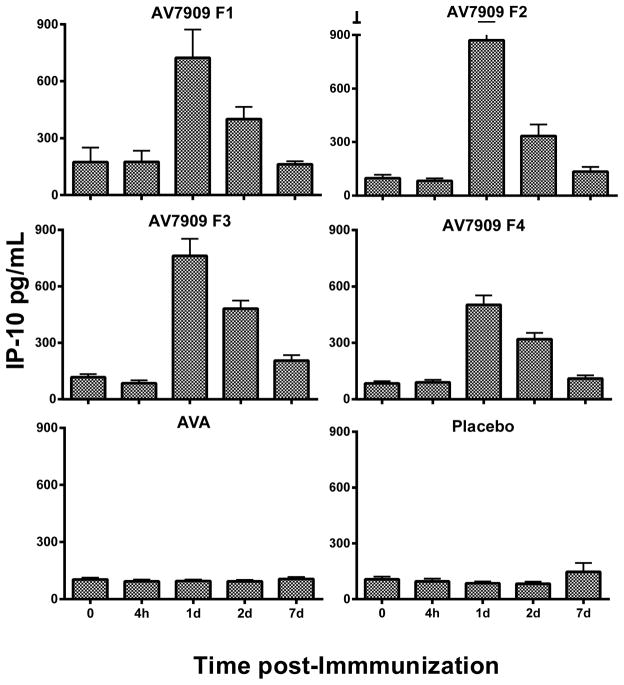
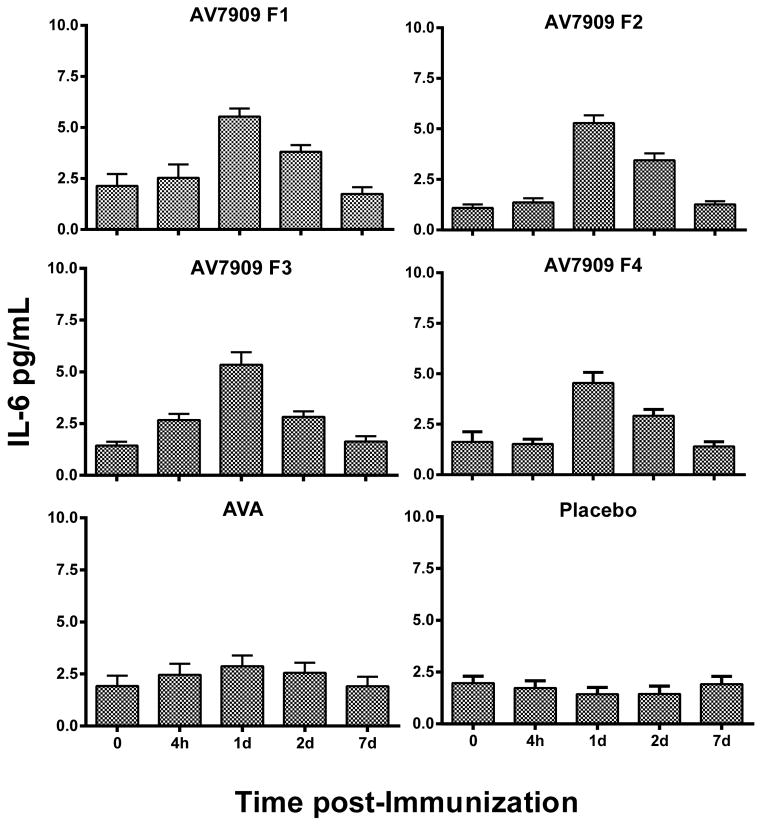
The time course of IP-10 and IL-6 serum levels in AV7909 recipients increased over 24 to 48 hours in a manner consistent with that previously reported [19] with peak serum levels observed at 24 hours, as shown in Figures 1 and 2. Post-hoc analysis (by group) for IP-10, revealed that all AV7909 groups were statistically different from AVA and saline (placebo) groups. Post-hoc analysis for IL-6 (by group) revealed a trend towards higher IL-6 for AV7909 than AVA that was not statistically different, yet both were statistically different from the saline group (Figure 2). Like IP-10, IL-6 serum levels returned to pre-immunization levels by day 7.
Fig. 1.
Average of the subject’s individual IP-10 Cytokine responses (pg/mL) among all groups of the EBS.AVA.201 Study. Vaccines: AV7909 F1 (AVA 0.5 ml + CpG 0.5 ml); AV7909 F2 (AVA 0.5 ml + CpG 0.25 ml); AV7909 F3 (AVA 0.25 ml + CpG 0.5 ml); AV7909 F4 (AVA 0.25 ml + CpG 0.25 ml); AVA= BioThrax (0.5 mL); placebo (0.5 ml saline). Statistical differences (p < 0.05 following post-hoc analysis using MANOVA) of IP-10 in serum were identified between AV7909 (Formulations 1 – 4) relative to AVA or placebo.
Fig. 2.
Average of the subject’s individual IL-6 Cytokine responses (pg/mL) among all groups of the EBS.AVA.201 Study. Vaccines: AV7909 F1 (AVA 0.5 ml + CpG 0.5 ml); AV7909 F2 (AVA 0.5 ml + CpG 0.25 ml); AV7909 F3 (AVA 0.25 ml + CpG 0.5 ml); AV7909 F4 (AVA 0.25 ml + CpG 0.25 ml); AVA= BioThrax (0.5 mL); placebo (0.5 ml saline). Statistically, IL-6 in serum differed between AV7909 (Formulations 1 – 4) or AVA relative to placebo p < 0.05 following post-hoc analysis using MANOVA. But AVA IL-6 was not different from that in AV7909 Formulations 1–4 (p > 0.05).
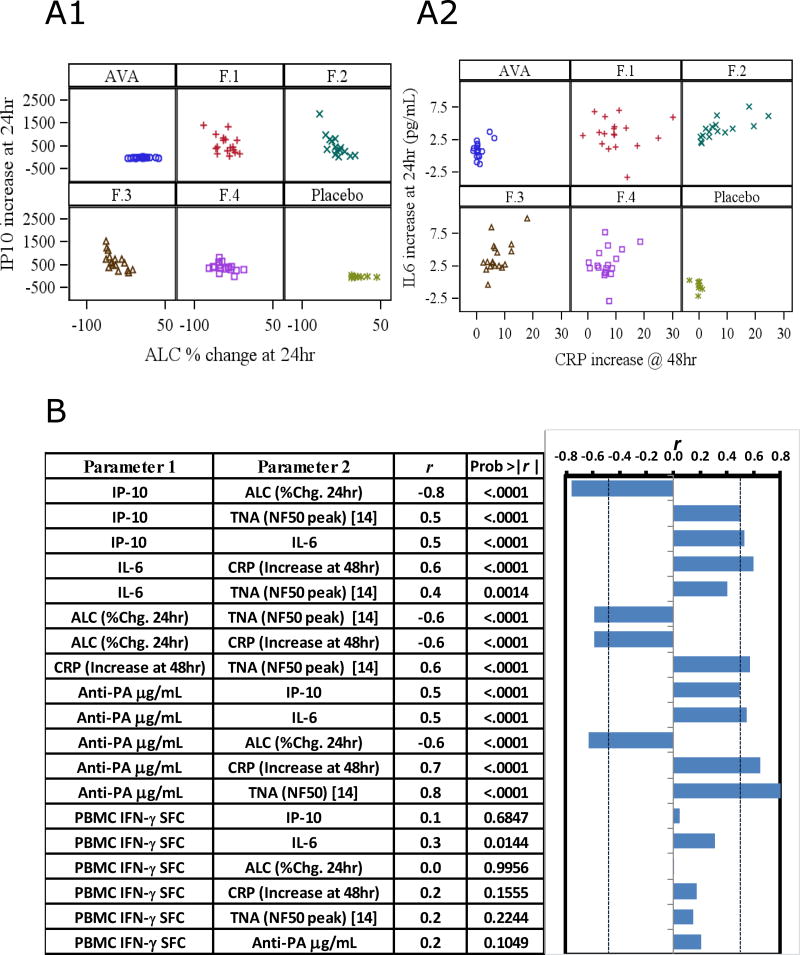
All formulations of AV7909 induced greater changes in ALC and blood CRP levels than either AVA or saline. The X-axes of Figure 3A1 and A2 illustrate the overall changes in these markers, with the responses separated for each treatment group. Also shown in Figure 3A are IP-10 and IL-6 data at 24 h, the time point of peak elevation, and relationship to ALC or CRP. As expected, there was a correlation between the observed decrease in ALC and the increase in IP-10 levels 24 h after immunization (r = −0.76) (Fig. 3A). Increased CRP at 48 h was associated with increased IL-6 at 24 h (r = 0.59) (Fig. 3A). Additionally, there was a significant association of Day 28 TNA NF50 values reported by Hopkins et al. [14] with IP-10, IL-6, ALC, and CRP. In addition, Day 28 IgG antibody levels directed against PA (reported below) correlated significantly with these early innate biomarkers (Figure 3B).
Fig. 3.
Associations between immune activities of CpG. A1) Increased IP-10 (pg/mL, baseline-subtracted) at 24 hr by Arm was correlated with decreases in the percentage of circulating lymphocytes (Spearman correlation, r = 0.76, p< 0.0001). A2) IL-6 levels (pg/mL, baseline-subtracted) at 24 hr by Arm versus reactogenicity marker, CRP (mg/L) at 48hr (Spearman correlation, r = 0.6, p< 0.0001). AVA = BioThrax. B) Spearman Rank correlations (r) of pairwise comparisons for the different biomarker combinations. “IFN-γ SFC” is the PBMC response to rPA antigen on Day 21 measured in ELISpot. “TNA (NF50)” was determined in the companion study [14] with sera samples obtained from the same Subjects. For purpose of correlation, NF50 was the peak ascertained for each subject which occurred at Day 28 or 35. Graph depicts the correlation statistics adjacent to the respective pair, and probability is the chance of difference from the null hypothesis of r = 0; for statistical significance alpha is set to p < 0.0010. Dotted vertical lines on graph relate the r threshold equivalent to this alpha level.
IFN-γ T cell Recall Responses to PAp and rPA
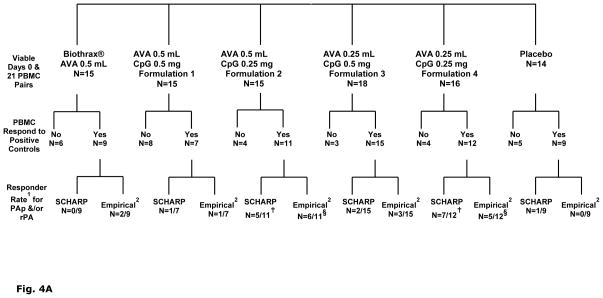
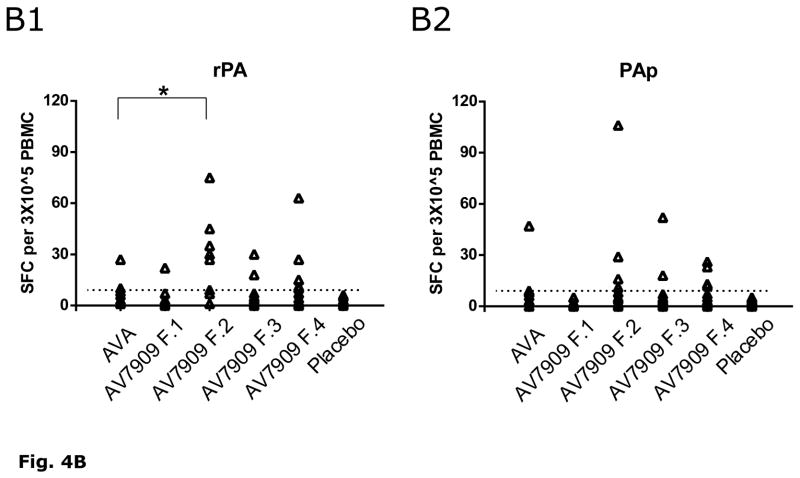
Figure 4A presents the sequence of steps by which PBMC ELISpot data in each of 6 treatment groups were analyzed for responder rates. Using criteria to include only those PBMC pairs (day 0 and day 21) having adequate positive responses to PHA or CEF-I, the IFN-γ ELISpot responder rate to PAp and/or rPA averaged 11% (1/9) in recipients of two full (0.5 mL) doses of AVA. In contrast, a significantly higher IFN-γ response rate was observed for the subjects in treatment groups that received the lower amount of CPG 7909 (0.25 mg), resulting in 5/11 and 7/12 positive responders for Formulations 2 and 4, respectively compared to those that received a higher amount of CPG 7909 (Suissa-Shuster, p= 0.03). There were no responders in the placebo group.
Fig. 4.
A). Break down of viable PBMC samples included in human IFN- γ ELISpot analyses and further paring according to functionally responsive to positive controls PHA or CEF I. Samples that failed to meet the CEF I or PHA cut-off definition (i.e. “No”) were excluded from subsequent statistical analyses. Group IFN-γ response rates to PA peptide pool and/or rPA: 1 For each Scharp or Empirical fraction, the numerator denotes number of subjects with positive IFN-γ responses to PAp and/or rPA; denominator denotes number of subjects with complete days 0 and 21 PBMC samples that met the CEF I (≥15 SFC) and PHA (≥200 SFC) cut-off criteria. 2 Empirical definition of positive response set at a minimum of 9 SFC in wells with PAp or rPA and at least two-fold higher than background (SFC counts in wells with medium alone). Scharp analyses to define positive responses was carried out at link http://www.scharp.org/zoe/runDFR/. Three subjects were excluded from final analyses due to insufficient cells for testing of either day 0 or day 21 samples. § p = 0.06 (responder rate from empirical analyses) and † p= 0.04 (responder rate from Scharp analyses) for AV7909 (with 0.25 mg CPG 7909; groups 3 and 5) compared to AVA alone, by Suissa-Shuster Exact test.
B). Individual subjects’ Day 21 (7 days after second immunization) IFN-γ ELISpot SFC counts following stimulation with rPA (B1) or PAp (B2). IFN-γ SFC counts per 3×10⁵ PBMC are shown in each Arm for those samples that met the cut-off criteria (i.e., those subjects included in the last row of Figure 4A as Responders (empirical) that had greater than 9 SFC (dotted line)). * A statistical difference (p < 0.05 following post-hoc analysis using ANOVA) for rPA SFC (but not PAp SFC) was identified for AV7909 (Formulation 2) relative to AVA.
Using the Suissa-Shuster unconditional test [18], the IFN-γ responder rates of subjects immunized with AV7909 formulations containing half (Formulation 3 and Formulation 4) compared to full (Formulation 1 and Formulation 2) dose AVA were not statistically different (p=0.57). Figure 4B summarizes the IFN-γ T cell SFC cell count responses to PAp and/or rPA for each treatment group. ANOVA Statistics performed on the SFC counts in response to rPA (i.e. not on responder rate) demonstrated AV7909 F2 to be significantly different from AVA; this was not observed for the PAp mixture, however (Figure 4B). The T cell IFN-γ response (reported as SFC) at Day 21 did not correlate with any of the other endpoints (Figure 3B).
Anti-PA ELISA at Day 28
Of the investigated time points of Days 28, 42, and 70, IgG anti-PA content was highest in recipients of AV7909 compared to AVA, peaking at Day 28 (Figure 5). IgG anti-PA content of 99 human serum samples obtained 14 days following the second immunization (study day 28) ranged from 21 to 160 μg/mL; this was a 5-fold or higher mean response for recipients of AV7909 compared to AVA. As expected, there was also an increase in mean serum content within AVA recipients (average 21 μg/mL on Day 28), compared to the saline (placebo) group. Significant correlations occurred between this parameter and the changes in both ALC and CRP (Figure 3B). There was no clear relationship between humoral anti-PA IgG responses (or TNA peak NF50) and cellular (ELISpot) SFC responses (both at r = 0.2, Figure 3B).
Fig. 5.
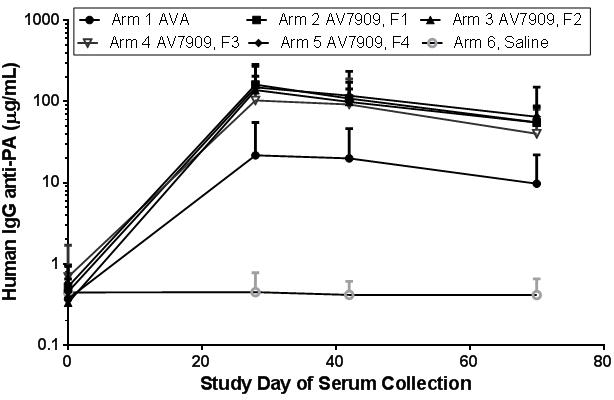
Serum content (μg/mL) of IgG anti-PA from samples (n=96 - 99) of vaccinated humans evaluated at Study Days 0, 28, 42 and 70. Each symbol represents mean (and 1 Standard Deviation) anti-PA content for each Arm, and measurement was after each sample within the Arm was serially diluted and evaluated on at least 3 occasions in order to reach internally consistent precision (<30% CV for multiple tests of the individual samples).
DISCUSSION
The main objective of this study was to evaluate effects of CPG 7909 as a vaccine component upon acute phase cytokines/chemokines, changes in lymphocytic trafficking (ALC), CRP, as well as later cellular immune responses; and their correlation with subsequent humoral immunity. In agreement with previous reports of SC administration of CPG 7909 [2;18;19] we found comparable response kinetics and magnitudes of IP-10 and IL-6 serum content after the vaccines were administered IM. These responses were transient and returned to baseline by day 7, indicating the potential to monitor repeated doses of CpG-adjuvanted vaccines for potentially unregulated activation of innate immunity by evaluating cytokine/chemokines or readily available CRP or ALC. These biomarkers were predictive of later adaptive immune responses, when measured at 24 - 48 hours after vaccine administration, in that they correlated with both later anti-PA levels (Day 28) and peak TNA NF50 titers.
Anthrax vaccines are designed to provide protection by stimulating the immune system to produce neutralizing antibodies that possess specificity for anthrax toxins. Anthrax toxins consist of the 83 kDa PA in combination with the 90 kDa lethal factor (LF) and/or the 89 kDa edema factor (EF). PA is the principal target for vaccine development. The result of PA- induced IFN-γ production in PBMC obtained from AVA - and AV7909-vaccinated individuals indicates Th1 cellular immunity directed to PA after immunization. In addition to protection mediated by neutralizing antibodies, cellular immunity to PA may provide rapid development of protective antibodies upon subsequent exposure. The increased cellular immunity after administration of formulations using 0.25 mg of CPG 7909 observed in this pilot study is of unverified clinical significance at present.
In addition to the elicited T cell recall responses in some subjects 7 days after the second administration of vaccine, AV7909 formulations elicited anti-PA antibody levels (Figure 5) as well as neutralizing antibodies [14] that peaked by 14 or 21 days after the second vaccination (Day 28 or 35). On a subject by subject basis, however, T cell recall IFN-γ responses did not correlate with peak antibody responses to PA. In this respect, T cell responder rates on study day 21 were not different between AV7909 recipients that received full and half dose AVA (regardless of the amount of CPG 7909) but peak TNA responses were lower for AV7909 groups receiving the lower dose of AVA (regardless of the amount of CPG 7909) [14]. Furthermore, and surprisingly, the T cell responder rates on study day 21 were statistically higher for the groups that received lower amounts of CPG 7909. Peak TNA responses were not statistically different between those groups [14], however. This T cell response was identified by quantitation of IFN-γ-producing cells rather than a marker of a Th2-type T cell response, such as Interleukin-4. Killing of B. anthracis by murine macrophages [20] and human NK cells [21] involve IFN-γ; although IFN-γ production by NK cells may be down-regulated somewhat by anthrax lethal toxin [21]. In mice, IFN-γ-inducible chemokines CXCL9, -10 and -11, contributed directly to in vitro anti-microbial effects against B. anthracis Sterne strain spores [22], and IFN-γ was produced by NK cells in response to B. anthracis spores [23].
Human peak TNA response occurs at different time points for different individuals [1], but typically between 28 and 35 days after the first dose in the series. The timeframe of peak circulation of T cells is not known. It is clear that sampling only at one time point (7 days after the second dose) provides an indication of the potential of two doses of AV7909 to induce T cell responses, but does not fully capture the differential kinetics of in vivo T cell activation, migration to lymphoid organs and recirculation in peripheral blood. Hence, because sampling the blood compartment only detects T cells in transit, these data are biased by sampling one time point. However, studies of T cell responses with Melan-A peptide vaccine adjuvanted with 0.5 mg of CpG demonstrated circulating levels of Melan-A specific T cells peaked at 7 days (4/7 subjects) and 10 days (3/7 subjects) after second immunization, and decline to near baseline by day 14 [24], suggesting that our PBMC samples were obtained within an appropriate window for sampling. Nonetheless, the use of a single post-immunization sampling point may explain some inter-group variability in this small study population.
Of note is the observation that of subjects that had positive ELISpot responses, half responded to both rPA and PAp, revealing an overlap in processed epitopes and predicted peptides (PAp). This overlap in responses of rPA compared to the pool of PAp suggests predicted peptides to be a suitable strategy for ELISpot testing in unknown HLA populations with limited PBMC samples.
In summary; 1) immunization with two doses (14 days apart) of an anthrax vaccine candidate consisting of AVA plus CPG 7909 was sufficient to induce IFN-γ-positive T cell recall responses in ex vivo-stimulated PBMC collected 21 days following the first immunization; 2) in this pilot study, a dose (0.25 mg) of CPG 7909, lower than used in other developing vaccines, was adequate to increase innate and adaptive immune responses beyond that elicited by AVA (BioThrax) alone; 3) rPA and predicted peptides of PA may be adequate as recall antigens in assessing anthrax vaccine-induced T cell recall responses of frozen PBMC; finally, 4) the innate responses to CpG, such as decreased ALC and increased CRP, explain a contribution of roughly 60% to the later peak anti-PA antibody titer (Figure 3B); the remaining variability is attributed to Subject differences in response to PA antigen, perhaps HLA-related.
Supplementary Material
Highlights.
BioThrax® plus CPG 7909 (0.25mg) in 2 vaccinations was sufficient to induce IFNγ + cells.
IP-10 is a successful serum marker of CPG 7909 in vaccines delivered intramuscularly.
Absolute Lymphocyte Count was confirmed as a marker of CPG 7909 in this vaccine.
A pool of HLA Class II PA-derived peptides were suitable T cell recall antigens.
CPG 7909 was confirmed to increase antigen-specific humoral immunity.
Acknowledgments
This work was supported by BARDA/NIAID contract number HHSN272200800051C.
We wish to thank Paul Hinds and Dr. Patrice Ruiz-Olvera for technical assistance, as well as Drs. Laurence Lemiale, Sukjoon Park and Sarah Guilmain for their expert review of an earlier version of the manuscript.
All authors are either current or former employees of Emergent BioSolutions, the developer of AV7909, and currently or previously were Emergent BioSolutions shareholders.
Footnotes
Publisher's Disclaimer: This is a PDF file of an unedited manuscript that has been accepted for publication. As a service to our customers we are providing this early version of the manuscript. The manuscript will undergo copyediting, typesetting, and review of the resulting proof before it is published in its final citable form. Please note that during the production process errors may be discovered which could affect the content, and all legal disclaimers that apply to the journal pertain.
References
- 1.Rynkiewicz D, Rathkopf M, Sim I, et al. Marked enhancement of the immune response to BioThrax® (Anthrax Vaccine Adsorbed) by the TLR9 agonist CPG 7909 in healthy volunteers. Vaccine. 2011 Aug 26;29(37):6313–20. doi: 10.1016/j.vaccine.2011.05.047. [DOI] [PubMed] [Google Scholar]
- 2.Stewart VA, McGrath S, Krieg AM, et al. Activation of innate immunity in healthy Macaca mulatta macaques by a single subcutaneous dose of GMP CpG 7909: safety data and interferon-inducible protein-10 kinetics for humans and macaques. Clin Vaccine Immunol. 2008 Feb;15(2):221–6. doi: 10.1128/CVI.00420-07. [DOI] [PMC free article] [PubMed] [Google Scholar]
- 3.Krieg AM, Efler SM, Wittpoth M, Al Adhami MJ, Davis HL. Induction of systemic TH1-like innate immunity in normal volunteers following subcutaneous but not intravenous administration of CPG 7909, a synthetic B-class CpG oligodeoxynucleotide TLR9 agonist. J Immunother (1997) 2004 Nov;27(6):460–71. doi: 10.1097/00002371-200411000-00006. [DOI] [PubMed] [Google Scholar]
- 4.Cooper CL, Davis HL, Morris ML, et al. Safety and immunogenicity of CPG 7909 injection as an adjuvant to Fluarix influenza vaccine. Vaccine. 2004 Aug 13;22(23–24):3136–43. doi: 10.1016/j.vaccine.2004.01.058. [DOI] [PubMed] [Google Scholar]
- 5.Segura E, Villadangos JA. Antigen presentation by dendritic cells in vivo. Curr Opin Immunol. 2009 Feb;21(1):105–10. doi: 10.1016/j.coi.2009.03.011. [DOI] [PubMed] [Google Scholar]
- 6.Zent CS, Smith BJ, Ballas ZK, et al. Phase I clinical trial of CpG oligonucleotide 7909 (PF-03512676) in patients with previously treated chronic lymphocytic leukemia. Leuk Lymphoma. 2012 Feb;53(2):211–7. doi: 10.3109/10428194.2011.608451. [DOI] [PMC free article] [PubMed] [Google Scholar]
- 7.La RC, Longmate J, Lacey SF, et al. Clinical evaluation of safety and immunogenicity of PADRE-cytomegalovirus (CMV) and tetanus-CMV fusion peptide vaccines with or without PF03512676 adjuvant. J Infect Dis. 2012 Apr 15;205(8):1294–304. doi: 10.1093/infdis/jis107. [DOI] [PMC free article] [PubMed] [Google Scholar]
- 8.Moseman EA, Liang X, Dawson AJ, et al. Human plasmacytoid dendritic cells activated by CpG oligodeoxynucleotides induce the generation of CD4+CD25+ regulatory T cells. J Immunol. 2004 Oct 1;173(7):4433–42. doi: 10.4049/jimmunol.173.7.4433. [DOI] [PubMed] [Google Scholar]
- 9.Kerkmann M, Rothenfusser S, Hornung V, et al. Activation with CpG-A and CpG-B oligonucleotides reveals two distinct regulatory pathways of type I IFN synthesis in human plasmacytoid dendritic cells. J Immunol. 2003 May 1;170(9):4465–74. doi: 10.4049/jimmunol.170.9.4465. [DOI] [PubMed] [Google Scholar]
- 10.Vollmer J, Weeratna R, Payette P, et al. Characterization of three CpG oligodeoxynucleotide classes with distinct immunostimulatory activities. Eur J Immunol. 2004 Jan;34(1):251–62. doi: 10.1002/eji.200324032. [DOI] [PubMed] [Google Scholar]
- 11.Rothenfusser S, Hornung V, Ayyoub M, et al. CpG-A and CpG-B oligonucleotides differentially enhance human peptide-specific primary and memory CD8+ T-cell responses in vitro. Blood. 2004 Mar 15;103(6):2162–9. doi: 10.1182/blood-2003-04-1091. [DOI] [PubMed] [Google Scholar]
- 12.Heijink IH, Vellenga E, Borger P, Postma DS, de Monchy JG, Kauffman HF. Interleukin-6 promotes the production of interleukin-4 and interleukin-5 by interleukin-2-dependent and -independent mechanisms in freshly isolated human T cells. Immunology. 2002 Nov;107(3):316–24. doi: 10.1046/j.1365-2567.2002.01501.x. [DOI] [PMC free article] [PubMed] [Google Scholar]
- 13.Kwok WW, Yang J, James E, et al. The anthrax vaccine adsorbed vaccine generates protective antigen (PA)-Specific CD4+ T cells with a phenotype distinct from that of naive PA T cells. Infect Immun. 2008 Oct;76(10):4538–45. doi: 10.1128/IAI.00324-08. [DOI] [PMC free article] [PubMed] [Google Scholar]
- 14.Hopkins RJ, Daczkowski NF, Kaptur PE, et al. Randomized, double-blind, placebo-controlled, safety and immunogenicity study of 4 formulations of Anthrax Vaccine Adsorbed plus CPG 7909 (AV7909) in healthy adult volunteers. Vaccine. 2013 Jun 26;31(30):3051–8. doi: 10.1016/j.vaccine.2013.04.063. [DOI] [PMC free article] [PubMed] [Google Scholar]
- 15.Rammensee H, Bachmann J, Emmerich NP, Bachor OA, Stevanovic S. SYFPEITHI: database for MHC ligands and peptide motifs. Immunogenetics. 1999 Nov;50(3–4):213–9. doi: 10.1007/s002510050595. [DOI] [PubMed] [Google Scholar]
- 16.Singh H, Raghava GP. ProPred: prediction of HLA-DR binding sites. Bioinformatics. 2001 Dec;17(12):1236–7. doi: 10.1093/bioinformatics/17.12.1236. [DOI] [PubMed] [Google Scholar]
- 17.Moodie Z, Price L, Gouttefangeas C, et al. Response definition criteria for ELISPOT assays revisited. Cancer Immunol Immunother. 2010 Oct;59(10):1489–501. doi: 10.1007/s00262-010-0875-4. [DOI] [PMC free article] [PubMed] [Google Scholar]
- 18.Garcia-de-Lorenzo A, Denia R, Atlan P, et al. Parenteral nutrition providing a restricted amount of linoleic acid in severely burned patients: a randomised double-blind study of an olive oil-based lipid emulsion v. medium/long-chain triacylglycerols. Br J Nutr. 2005 Aug;94(2):221–30. doi: 10.1079/bjn20051467. [DOI] [PubMed] [Google Scholar]
- 19.Krieg AM, Efler SM, Wittpoth M, Al Adhami MJ, Davis HL. Induction of systemic TH1-like innate immunity in normal volunteers following subcutaneous but not intravenous administration of CPG 7909, a synthetic B-class CpG oligodeoxynucleotide TLR9 agonist. J Immunother. 2004 Nov;27(6):460–71. doi: 10.1097/00002371-200411000-00006. [DOI] [PubMed] [Google Scholar]
- 20.Kang TJ, Fenton MJ, Weiner MA, et al. Murine macrophages kill the vegetative form of Bacillus anthracis. Infect Immun. 2005 Nov 1;73(11):7495–501. doi: 10.1128/IAI.73.11.7495-7501.2005. [DOI] [PMC free article] [PubMed] [Google Scholar]
- 21.Gonzales CM, Williams CB, Calderon VE, et al. Antibacterial role for natural killer cells in host defense to Bacillus anthracis. Infect Immun. 2012 Jan;80(1):234–42. doi: 10.1128/IAI.05439-11. [DOI] [PMC free article] [PubMed] [Google Scholar]
- 22.Crawford MA, Burdick MD, Glomski IJ, et al. Interferon-inducible CXC chemokines directly contribute to host defense against inhalational anthrax in a murine model of infection. PLoS Pathog. 2010;6(11):e1001199. doi: 10.1371/journal.ppat.1001199. [DOI] [PMC free article] [PubMed] [Google Scholar]
- 23.Klezovich-Benard M, Corre JP, Jusforgues-Saklani H, et al. Mechanisms of NK cell-macrophage Bacillus anthracis crosstalk: A balance between stimulation by spores and differential disruption by toxins. PLoS Pathog. 2012 Jan;8(1):e1002481. doi: 10.1371/journal.ppat.1002481. [DOI] [PMC free article] [PubMed] [Google Scholar]
- 24.Speiser DE, Lienard D, Rufer N, et al. Rapid and strong human CD8+ T cell responses to vaccination with peptide, IFA, and CpG oligodeoxynucleotide 7909. J Clin Invest. 2005 Mar;115(3):739–46. doi: 10.1172/JCI23373. [DOI] [PMC free article] [PubMed] [Google Scholar]
Associated Data
This section collects any data citations, data availability statements, or supplementary materials included in this article.


