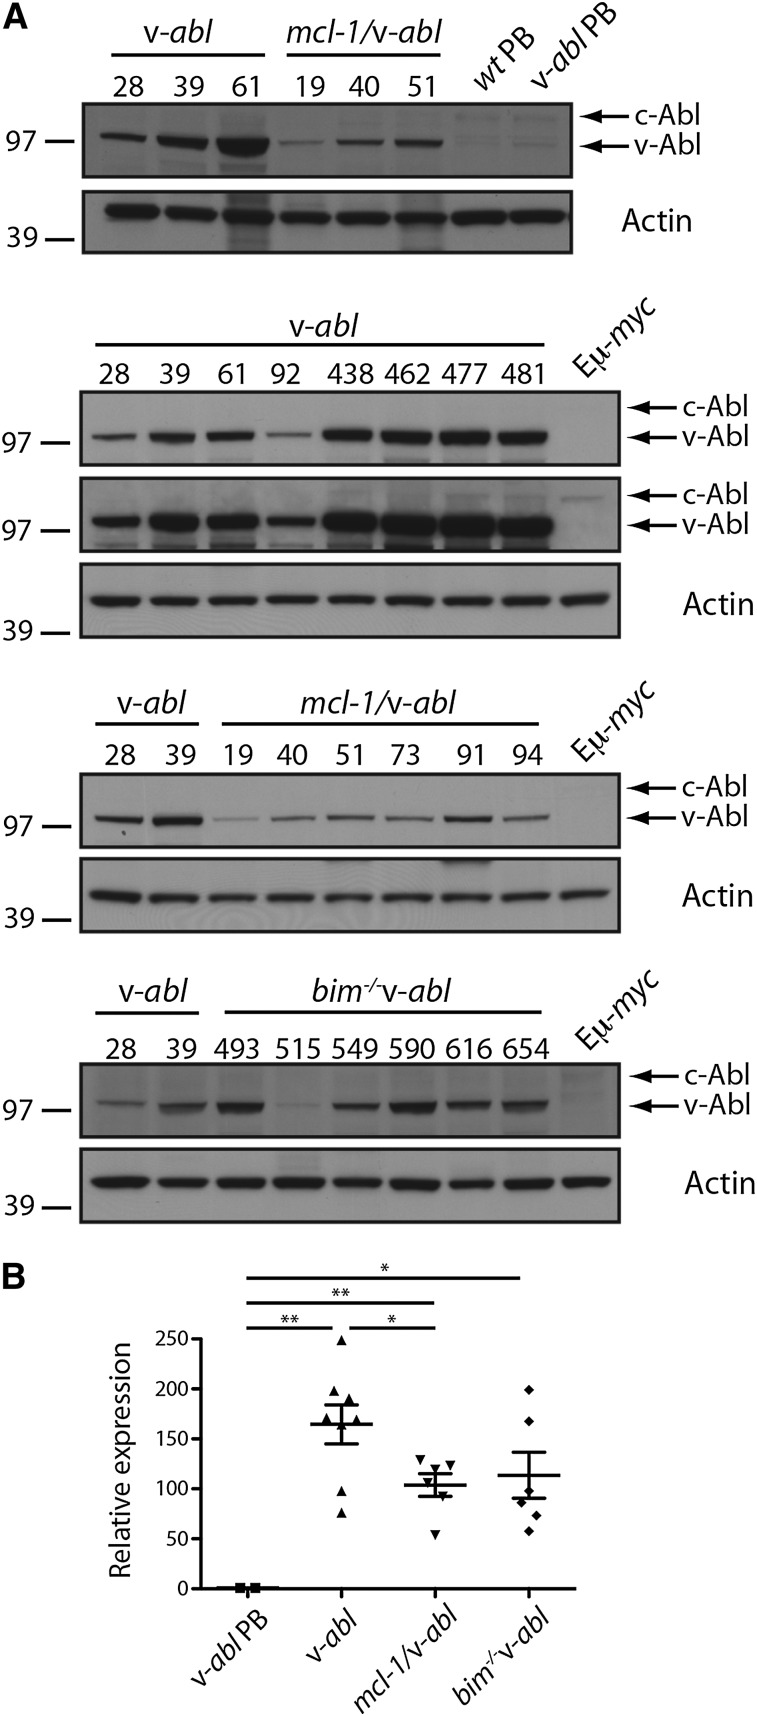
Figure 3.
v-abl transgene is highly expressed in plasmacytomas. (A) Western blot analysis of v-abl protein expression in plasmacytomas (whole tissue) from v-abl, mcl-1/v-abl, and bim−/− v-abl mice and PBs generated in vitro by LPS stimulation of B cells from WT and v-abl mice (Materials and methods) (note: the in vitro generated PB from v-abl mice contained very few v-abl expressing cells; data not shown). Two exposures are shown for the v-abl plasmacytomas to demonstrate that c-Abl can only be seen when v-Abl is overexposed. This is in contrast to Figure 1B, where levels of v-Abl and c-Abl were comparable and suggests that v-Abl expression is high in the plasmacytomas due to expression in all cells and upregulation. MW markers are indicated (kDa). (B) Real-time PCR analysis of v-abl mRNA in plasmacytoma cells from individual v-abl, mcl-1/v-abl, and bim−/− v-abl mice and PB generated in vitro from v-abl mice (see above). Expression was normalized to HMBS, and the data are expressed relative to PBs. Mean ± SEM, n = 6 to 8 independent tumors. *P < .05, **P < .01, Student t test.

