Figure 4.
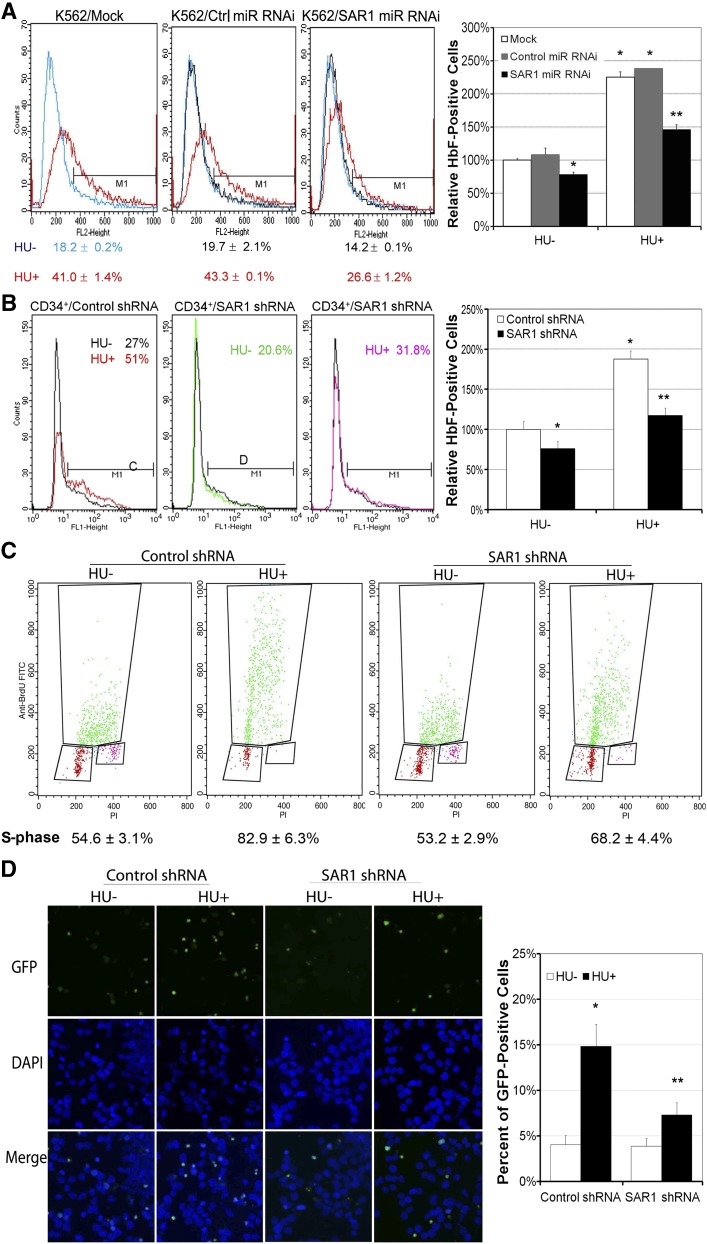
Silencing SAR1 expression reduces HbF protein expression in K562 and CD34+ cells and attenuates HU-mediated S-phase cell-cycle arrest and apoptosis. (A) K562 cells were transfected with SAR1 miR RNAi or control miR RNAi at day 0 and day 1, and incubated with or without 100 μM HU for 3 days after transfection at day 0. Cells were harvested, stained with PE-conjugated anti-HbF antibody, and subjected to flow cytometry to detect HbF-positive cells. (B) CD34+ bone marrow cells were infected by SAR1 shRNA or control shRNA lentivirus at day 4 of expansion. On day 6, transduced CD34+ cells were reseeded and grown in differentiation medium with 2 µg/mL puromycin for 7 days. Cells were harvested, stained with PE-conjugated anti-HbF antibody, and subjected to flow cytometry to detect HbF-positive cells. Left panels, representative flow cytometry results. Right panels, graphical representation of flow cytometry data for HbF protein expression with or without HU treatment relative to that of mock-transfected (A) or control shRNA lentivirus-transduced (B) cells not treated with HU. (C-D) K562 cells were incubated with or without HU for 2 days after transfection with SAR1 shRNA or control shRNA, then subjected to cell-cycle analysis using a BrdU incorporation assay or TUNEL assays. (C) Panels display representative BrdU incorporation assay results; the mean (±SD) percentage of cells in S-phase is shown below. (D) Apoptotic cells were stained green (GFP) in TUNEL assay; the nuclei of cells were stained blue with DAPI. Left panel, representative TUNEL assay results. Images were acquired with a fluorescence microscope system (Axioplan 2; Carl Zeiss MicroImaging) with a 20×/0.75 NA objective and a Zeiss Axiocam HRc real-color CCD camera and AxioVision 4 (Zeiss) acquisition software. Right panel, graphical representation of TUNEL assay results showing percent of GFP-positive cells. *P < .05 vs control-transfected cells not treated with HU. **P < .05 vs control-transfected cells with HU treatment. Error bars represent SD of the mean of 3 independent experiments. DAPI, 4′,6-diamidino-2-phenylindole; GFP, green fluorescent protein.

