

Abstract
Background
Tumor microenvironment of metastasis (TMEM), consisting of direct contact between a macrophage, an endothelial cell, and a tumor cell, has been associated with metastasis in both rodent mammary tumors and human breast cancer. We prospectively examined the association between TMEM score and risk of distant metastasis and compared risk associated with TMEM score with that associated with IHC4.
Methods
We conducted a case–control study nested within a cohort of 3760 patients with invasive ductal breast carcinoma diagnosed between 1980 and 2000 and followed through 2010. Case patients were women who developed a subsequent distant metastasis; control subjects were matched (1:1) on age at and calendar year of primary diagnosis. TMEM was assessed by triple immunostain and IHC4 by standard methods; slides were read by pathologists blinded to outcome. Odds ratios (ORs) and 95% confidence intervals (CIs) were estimated using logistic regression, adjusted for clinical variables. A Receiver Operating Characteristic analysis was performed, and the area under the curve was estimated. All statistical tests were two-sided.
Results
TMEM score was associated with increased risk of distant metastasis in estrogen receptor (ER)+/human epidermal growth factor receptor (HER2)− tumors (multivariable OR high vs low tertile = 2.70; 95% CI = 1.39 to 5.26; P trend = .004), whereas IHC4 score had a borderline positive association (OR10 unit increase = 1.06; 95% CI = 1.00 to 1.13); the association for TMEM score persisted after adjustment for IHC4 score. The area under the curve for TMEM, adjusted for clinical variables, was 0.78. Neither TMEM score nor IHC4 score was independently associated with metastatic risk overall or in the triple negative or HER2+ subgroups.
Conclusions
TMEM score predicted risk of distant metastasis in ER+/HER2− breast cancer independently of IHC4 score and classical clinicopathologic features.
Distant metastasis is the primary cause from death in breast cancer, a heterogeneous disease with variable natural history and propensity to metastasize (1,2). Several gene expression assays (eg, Oncotype DX, MammaPrint) provide more accurate prognostic and predictive information than classical clinicopathologic features (3). Although these signatures differ with respect to the genes that they include, they provide similar prognostic information that is driven largely by proliferation- and estrogen-regulated genes and not the intrinsic propensity of a tumor to metastasize or interact with its microenvironment (4,5).
A major mechanism for carcinoma cell dissemination from the primary tumor to distant organs is hematogenous spread (6). Multiphoton-based intravital imaging has demonstrated that invasive carcinoma cells in mouse and rat mammary tumors comigrate and intravasate when associated with perivascular macrophages (7–11). Specifically, intravasation occurs at sites where a macrophage, a tumor cell, and an endothelial cell are in direct contact (10,12). The tumor cell that comigrates and interacts with macrophages at intravasation sites is characterized by the high expression of multiple proinvasion isoforms of Mena, in particular Menaclassic, MenaINV, and Mena+ (7,8,11,13).We have identified this intravasation microenvironment in human breast cancer samples using a triple immunostain for paraffin-embedded tissue that simultaneously labels macrophages, endothelial cells, and invasive macrophage-associated carcinoma cells. The macrophage-associated carcinoma cells are recognized by high expression of proinvasion isoforms of Mena using a pan-Mena antibody that stains all isoforms of Mena (13–16). Because all isoforms of Mena are obligate tetramers comprised of the different Mena isoforms expressed in the cell and these tetramers function together (17), the pan-Mena antibody is currently the best marker to identify macrophage-associated invasive tumor cells.
We call the structure composed of these three cell types (perivascular macrophages, endothelial cells, invasive Mena-overexpressing tumor cells) in direct contact with each other “TMEM,” which stands for tumor microenvironment of metastasis. In a previous proof-of-principle case–control study, we observed a positive association between TMEM score (the total number of TMEMs in 10 high-power fields) and risk of distant metastasis (18). However, that study was very small (n = 30 case–control pairs), and therefore the estimates of risk were imprecise. Furthermore, inclusion in the study was restricted to subjects with moderately or poorly differentiated tumors with a minimum of 5 years of follow-up time, thereby limiting the generalizability of the findings.
We now report the results of a comprehensive evaluation of the association between TMEM score in primary breast cancer tissue and risk of distant metastasis, conducted in a study population that included the full spectrum of breast cancer case patients with respect to both tumor grade and follow-up time. This included comparison of the risk associated with TMEM score with that associated with IHC4, a previously validated composite immunohistochemical score based on the estrogen receptor (ER), progesterone receptor (PR), human epidermal growth factor receptor 2 (HER2), and Ki67 expression that has been shown to provide prognostic information comparable with that provided by the Oncotype DX Recurrence Score gene expression assay (19,20).
Methods
Patients and Follow-up
The study was undertaken within the cohort of 3983 women in the Kaiser Permanente Northwest (KPNW) health-care system who received a first diagnosis of invasive ductal carcinoma of the breast between January 1, 1980, and December 31, 2000, were aged 21 years or older at initial diagnosis, were treated surgically, and did not have evidence of metastasis at initial diagnosis. Breast cancer case patients were ascertained through the KPNW Tumor Registry, which has operated continuously since 1960 and is approved by the Commission on Cancer of the American College of Surgeons (21). The KPNW Tumor Registry has maintained a follow-up rate of 98% for patients enrolled since 1960, even those who are no longer health-plan members.
The breast cancer subjects were followed from the date of initial diagnosis until the date of distant metastasis; termination of plan membership; death; or termination of follow-up of the cohort (December 31, 2010), whichever came first. Of the 3983 case patients in the cohort, 3760 were ultimately included, of whom 530 developed a distant metastasis during follow-up (Figure 1).
Figure 1.
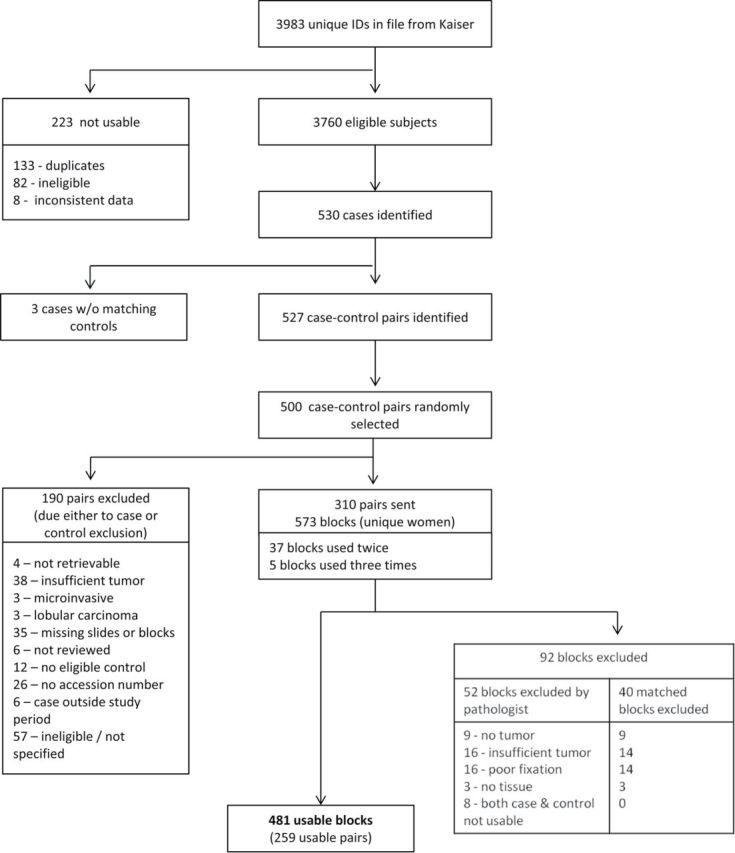
Flow chart showing included and excluded study subjects and tissue blocks.
The study described here was approved under a waiver of written informed consent by the institutional review boards of all participating institutions.
Study Design
We conducted a case–control study nested within the breast cancer cohort. Case patients were women who developed a distant metastasis, whereas control subjects were women who were alive and had not developed a distant metastasis by the date of metastasis of the corresponding case. Control subjects were individually matched to case patients (1:1) on age at and calendar year of the diagnosis of invasive breast cancer (matching on both variables was generally within ± 1 year) and were selected randomly from risk sets, with replacement. Potential control subjects considered to be unsuitable (eg, inadequate tumor tissue) were replaced by another control randomly selected from the same risk set.
Our predetermined target sample size was 250 case–control pairs, sufficient for detection of an odds ratio (OR) of 1.5 per 50-unit increase in TMEM score in the entire cohort with 80% power and a two-sided type I error rate of 5%.
Clinical Data
Information on tumor characteristics, treatment, and outcome was obtained from the KPNW tumor registry.
Tissue Acquisition
Hematoxylin and eosin (H&E) stained sections from case patients selected for the study were reviewed to identify an appropriate formalin-fixed paraffin-embedded tissue block. Blocks were required to contain viable invasive tumor that was representative of the tumor’s growth pattern, nuclear grade, and mitotic activity. If a prior biopsy had been performed, the chosen block was required to be distant from the biopsy site so that biopsy site changes did not obscure the native perivascular macrophage population. Blocks received from the KPNW cohort had an H&E slide prepared at Weill Cornell for confirmation of their appropriateness for inclusion. The tumors were reviewed histologically and graded using the modified Bloom–Richardson criteria (22,23). All tumors were handled in the TMEM laboratory without knowledge of patient data, treatment, or outcome.
Tissue Staining and Assessment
The TMEM stain was a triple immunostain in which three antibodies were applied sequentially and developed separately with different chromogens on a Bond Max Autostainer. The sequence was anti-CD31 (clone JC70A; 1:800 dilution; DAKO, Carpinteria, CA) with Bond Epitope Retrieval Solution 2 and Vector Blue chromogen (for endothelial cells); anti CD-68 (clone PG-M1; 1:300 dilution; DAKO) with antigen retrieval using Bond Epitope Retrieval Solution 1 and DAB chromogen (for macrophages); and anti-pan-Mena (1:200 dilution; Gertler laboratory, Cambridge, MA) with Fast Red chromogen (for carcinoma cells). The counterstain was Light Green. The anti-Mena mouse monoclonal (A351F7D9) antibody reacts with an epitope unique to Mena that is contained in all known Mena isoforms, including MenaINV and Mena11a, and is 100% conserved between mouse and human (24).
Staining for ER, PR, and HER2/neu was performed and interpreted as per standard surgical pathology practice in accordance with American Society of Clinical Oncology/College of American Pathologists (ASCO-CAP) guidelines (25,26); Ki67 staining was performed as described elsewhere (27). ER/PR positivity was defined as 1% of cells or more staining positive (25), and HER2 positivity was defined as a score of three or greater. Further details regarding tissue staining and scoring are provided in the Supplementary Methods (available online), and examples of fields showing TMEM are shown in Supplementary Figure 1 (available online). All readings (TMEM/receptors/Ki67) were performed blinded to case–control status (28).
TMEM Score
The analyses focused on the relationship between TMEM score and risk of distant metastasis. For the purpose of estimating the TMEM score, each occurrence of a structure consisting of the direct contact between an invasive pan-Mena-expressing carcinoma cell, an endothelial cell, and a perivascular macrophage, with no discernible stroma between the tumor cell and the perivascular macrophage, constituted one TMEM. Each additional TMEM identified added one to the TMEM score. The final TMEM score was the total number of TMEMs observed within the 10 high-power fields examined (see TMEM assessment in the Supplementary Methods, available online).
Statistical Analysis
Only the biostatistician at Mount Sinai Hospital (H.-M. Lin) had access to the complete dataset containing both laboratory and clinical data, including outcome status (ie, distant metastasis or not); she performed the analysis with input from the other investigators (who were blinded to outcome).
Both univariate and multivariable conditional logistic regression models were used to estimate odds ratios and 95% confidence intervals (CIs) for the association between TMEM score and risk of distant metastasis (treated as a binary outcome) for all subjects combined. Clinical/tumor characteristics (ie, tumor size, tumor grade, number of positive lymph nodes, and hormone treatment) were adjusted for in the multivariable model. TMEM score was treated both as a continuous variable and as a categorical variable, with categorization by tertiles (based on the distribution of TMEM score among the control subjects in the entire study population). To determine the appropriateness of modeling TMEM score as a linear term, a plot of the residuals against TMEM score was used to examine whether there was any evidence of departure from linearity. As prespecified, the analysis was repeated for each of the following breast cancer subgroups: ER+/HER2−, HER2+, and triple-negative (ER−, PR−, HER2−). For these latter analyses, the matching was broken, and odds ratios were obtained using unconditional logistic regression, with additional adjustment for the matching variables. As a sensitivity analysis, we also used conditional logistic regression on the entire dataset, with interaction terms between TMEM score and subgroup indicator to allow the association with TMEM score to differ by subgroups.
To compare risk associated with TMEM score with that associated with the IHC4 score, we conducted analyses according to the following steps: 1) using the coefficients reported by Cuzick et al. (19) for the components of IHC4 (Supplementary Methods, available online), a multivariable regression model was fitted for IHC4 score and the clinical risk factors. The IHC4 variable was treated both continuously and categorically (tertiles), as with the TMEM score; 2) a multivariable regression model that included both IHC4 score [based on the coefficients reported by Cuzick et al. (19)] and TMEM score plus the clinical risk factors was used to examine whether the prognostic value of the TMEM score/IHC4 score was affected by the other; 3) to further examine the prognostic value of the TMEM score in addition to the four markers used in the IHC4 score (ER, PR, HER2, Ki67) and the clinical risk factors, a multivariable regression model was used with TMEM score, the four markers (as individual variables), and the clinical risk factors—this allowed the four markers to have different weights from those derived for the IHC4 score by Cuzick et al. (19) because our study population differed from that of Cuzick et al. (19) and this difference may have affected the performance of their IHC4 score in our population.
To further examine the prognostic value of TMEM score, we performed a receiver operating characteristic (ROC) analysis and computed the area under the curve (AUC) (29). Separate ROC analyses were conducted based on TMEM score alone and on TMEM score in combination with clinical variables (tumor size, number of positive lymph nodes, tumor grade, and hormone therapy) through the use of a TMEM composite score, defined as a linear equation of all the variables in the model with the estimated coefficients from the logistic regression model as their coefficients. The AUCs for these two nested models—namely, the model with the TMEM composite score and the model with TMEM score only—were compared using a likelihood ratio test, as recommended by Seshan et al. (30). To examine the possibility of overoptimism in our best estimate of the AUC, we performed an n − 1 cross-validation. Specifically, the cross-validated predicted probability for an observation was calculated by fitting the model ignoring that observation and then using the resulting model to compute the predicted probability for the ignored observation (31,32). An ROC curve was then generated based on the cross-validated predicted probabilities. This ROC curve and its AUC were compared with the ROC/AUC generated using all of the data. A ROC analysis was also performed for IHC4 score, which allowed us to compare the prognostic value of TMEM score with that of IHC4 score.
All analyses were conducted using SAS (SAS 9.3; SAS Institute, Cary, NC). All P values are two-sided, and P values less than .05 were considered to be statistically significant. The study was conducted and the results reported in accordance with the REMARK guidelines (Supplementary Table 1, available online) (33).
Results
Patient Population
Figure 1 shows the number of subjects excluded for various reasons. Of the 573 breast cancer tissue blocks received (which, because of the sampling with replacement, represented 310 case–control pairs), 481 (83.9%), representing 259 case–control pairs, were usable and were included in the study. Comparison of the corresponding tumor characteristics of the 481 included blocks and the 92 excluded blocks showed no differences between them with respect to their distributions by tumor size, number of positive lymph nodes, and treatment by chemotherapy, hormone therapy, and radiation therapy. However, a greater proportion of the excluded blocks were from the earlier part (before 1990) of the ascertainment period (excluded vs included: 59.8% vs 42.6%). For the included case patients, the median time to distant metastasis was 3 years and 1 month (5th percentile: 8 months; 95th percentile: 11 years and 2 months).
Baseline characteristics of the study subjects are presented in Table 1. Case patients and control subjects had very similar distributions with respect to age and calendar year of diagnosis, reflecting the case–control matching on these variables (mean case–control difference in age [years] = −0.02, standard deviation [SD] = 0.78; mean case–control difference in diagnosis year = −0.01, SD = 0.85). Tumor size, tumor grade, lymphovascular invasion, number of positive lymph nodes, Ki67, and hormone therapy showed positive associations with risk of distant metastasis on univariate analysis, whereas those who were positive for ER or PR or who received chemotherapy had reduced risk of distant metastasis. On multivariable modeling of these variables with TMEM score in the model, only tumor size (P < .05), nodal status (P < .05), tumor grade (P < .05), and treatment with hormone therapy (.05 < P < .10) were associated with risk of metastasis at P less than .10, and these variables were retained in subsequent multivariable models.
Table 1.
Baseline characteristics of the study population
| Variable | No. of case subjects (%) | No. of control subjects (%) | Odds ratio (95% confidence interval)* |
|---|---|---|---|
| Age, y, at diagnosis | |||
| 21–39 | 29 (11.2) | 27 (10.4) | — |
| 40–59 | 107 (41.3) | 108 (41.7) | — |
| 60–79 | 109 (42.1) | 107 (41.3) | — |
| 80–99 | 14 (5.4) | 17 (6.6) | — |
| Calendar year of diagnosis | |||
| 1980–1984 | 66 (25.5) | 66 (25.5) | — |
| 1985–1989 | 85 (32.8) | 88 (34.0) | — |
| 1990–1994 | 56 (21.6) | 50 (19.3) | — |
| 1995–2000 | 52 (20.1) | 55 (21.2) | — |
| Tumor size, cm | |||
| 0–<2 | 103 (39.8) | 166 (64.1) | 1.00 (referent) |
| 2–3 | 75(29.0) | 43 (16.6) | 3.02 (1.85 to 4.94) |
| >3 | 54 (20.9) | 24 (9.3) | 4.25 (2.30 to 7.84) |
| Missing | 27 (10.4) | 26 (10.0) | 2.08 (1.07 to 4.02) |
| Bloom–Richardson grade | |||
| Well differentiated | 17 (6.6) | 49 (18.9) | 1.00 (referent) |
| Moderately differentiated | 102 (39.4) | 116 (44.8) | 4.00 (1.85 to 8.68) |
| Poorly differentiated | 140 (54.1) | 94 (36.3) | 7.07 (3.17 to 15.77) |
| Lymphovascular invasion | |||
| Absent | 212 (81.9) | 231 (89.2) | 1.00 (referent) |
| Present | 47 (18.2) | 28 (10.8) | 1.79 (1.09 to 2.95) |
| No. of positive lymph nodes | |||
| 0 | 96 (37.1) | 159 (61.4) | 1.00 (referent) |
| 1–3 | 67 (25.9) | 65 (25.1) | 1.83 (1.14 to 2.92) |
| ≥4 | 75 (29.0) | 20 (7.7) | 5.90 (3.28 to 10.59) |
| Missing | 21 (8.1) | 15 (5.8) | 2.55 (1.19 to 5.43) |
| Estrogen receptor | |||
| Negative | 92 (35.5) | 69 (26.6) | 1.00 (referent) |
| Positive | 166 (64.1) | 189 (73.0) | 0.63 (0.43 to 0.93) |
| Unknown | 1 (0.4) | 1 (0.4) | |
| Progesterone receptor | |||
| Negative | 110 (42.4) | 79 (30.5) | 1.00 (referent) |
| Positive | 149 (57.5) | 180 (69.5) | 0.59 (0.40 to 0.85) |
| HER2/neu receptor | |||
| Negative | 212 (81.9) | 228 (88.0) | 1.00 (referent) |
| Positive, ≥3 | 47 (18.1) | 31 (12.0) | 1.62 (0.99 to 2.63) |
| Ki-67, % cells positive | |||
| ≤5 | 56 (21.6) | 92 (35.5) | 1.00 (referent) |
| 6–15 | 83 (32.1) | 86 (33.2) | 1.85 (1.10 to 3.12) |
| ≥16 | 120 (46.3) | 81 (31.3) | 2.89 (1.75 to 4.77) |
| Chemotherapy | |||
| No | 133 (51.4) | 162 (62.6) | 1.00 (referent) |
| Yes | 126 (48.7) | 97 (37.5) | 0.63 (0.45 to 0.90) |
| Hormonal therapy | |||
| No | 170 (65.6) | 141 (54.4) | 1.00 (referent) |
| Yes | 89 (34.4) | 118 (45.6) | 1.60 (1.12 to 2.28) |
| Radiation | |||
| No | 152 (58.7) | 151 (58.3) | 1.00 (referent) |
| Yes | 107 (41.3) | 108 (41.7) | 1.02 (0.72 to 1.44) |
* Univariate odds ratios obtained using conditional logistic regression models.
Relationship Between TMEM Score and Clinicopathologic Features
As indicated in Figure 2, there was no association between TMEM score and tumor size or number of positive lymph nodes, but TMEM score was higher in poorly differentiated tumors than in well-differentiated ones.
Figure 2.
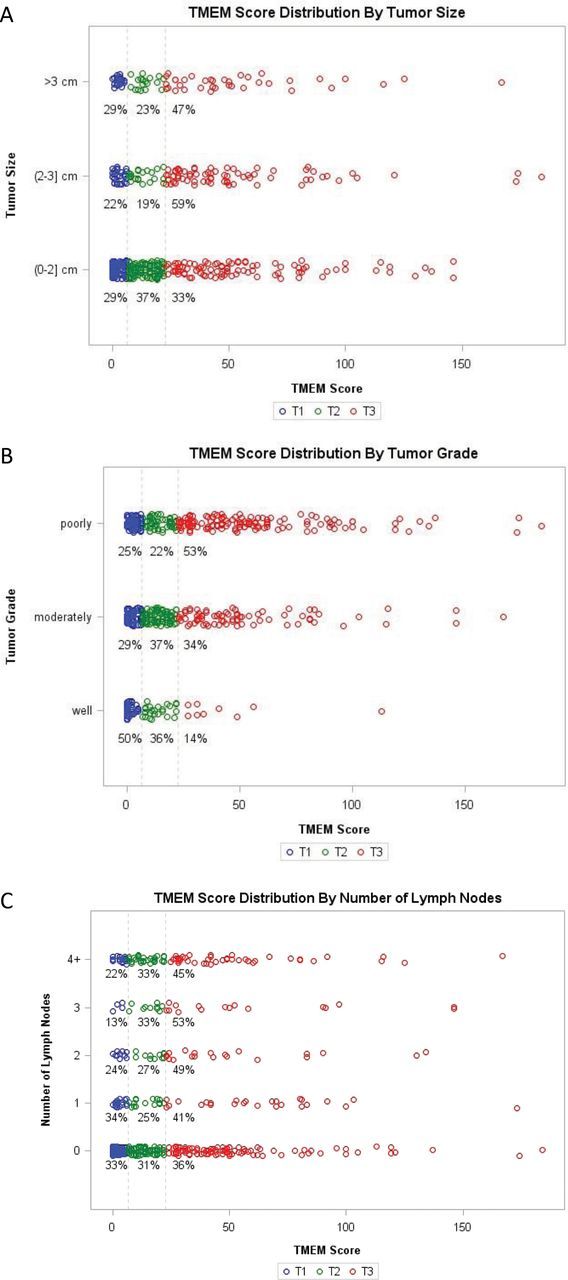
Association between tumor microenvironment of metastasis (TMEM) score and clinical variables. A) Tumor size. B) Tumor grade. C) Number of positive lymph nodes. T1 = TMEM score ≤ 6; T2 = 7 ≤ TMEM score ≤ 22; T3 = TMEM score ≥ 23.
TMEM Score and Risk of Metastasis
The median TMEM score in the case patients was higher than that in the control subjects: 19 (interquartile range [IQR] = 6–45) vs 14 (IQR = 3–32) (Supplementary Table 2, available online). Table 2 shows the association between TMEM score and risk of distant metastasis. For the total study population, risk of metastasis increased with increasing TMEM score but was not statistically significant after adjustment for clinical variables. No violation of the linearity assumption for TMEM score was evident in the residual plot. When examined within predefined subgroups, TMEM score was not associated with metastatic risk in triple-negative and HER2+ disease but was statistically significantly associated with increased risk of metastasis in ER+/HER2− disease (OR high vs low tertile = 2.70, 95% CI = 1.39 to 5.26, P trend = .004; OR per 10-unit increase in TMEM = 1.16, 95% CI = 1.03 to 1.30) (Table 2). Conditional logistic regression models with interaction terms yielded similar results (data not shown).
Table 2.
Association between tumor microenvironment of metastasis (TMEM) score and risk of distant metastasis, overall and by tumor subtype
| Tumor type | TMEM category | Case subjects, No.* | Control subjects, No. | Odds ratio (95% confidence interval)† | |
|---|---|---|---|---|---|
| Univariate | Multivariable | ||||
| All subjects | ≤6 | 66 | 89 | 1.00 (referent) | 1.00 (referent) |
| 7–22 | 71 | 85 | 1.14 (0.74 to 1.76) | 1.13 (0.67 to 1.90) | |
| ≥23 | 122 | 85 | 1.93 (1.26 to 2.97) | 1.49 (0.86 to 2.56) | |
| P trend | .002 | .14 | |||
| Continuous, per 10 units | 1.07 (1.01 to 1.13) | 1.02 (0.95 to 1.10) | |||
| Triple-negative‡ | ≤6 | 20 | 16 | 1.00 (referent) | 1.00 (referent) |
| 7–22 | 14 | 8 | 1.40 (0.46 to 4.25) | 1.61 (0.46 to 5.59) | |
| ≥23 | 22 | 18 | 0.98 (0.38 to 2.51) | 0.73 (0.24 to 2.22) | |
| P trend | .95 | .58 | |||
| Continuous, per 10 units | 0.93 (0.80 to 1.07) | 0.88 (0.75 to 1.03) | |||
| ER+/HER2− | ≤6 | 30 | 55 | 1.00 (referent) | 1.00 (referent) |
| 7–22 | 41 | 53 | 1.42 (0.78 to 2.59) | 1.32 (0.70 to 2.52) | |
| ≥23 | 76 | 40 | 3.48 (1.95 to 6.22) | 2.70 (1.39 to 5.26) | |
| P trend | <.001 | .004 | |||
| Continuous, per 10 units | 1.19 (1.07 to 1.32) | 1.16 (1.03 to 1.30) | |||
| HER2+ | ≤6 | 14 | 5 | 1.00 (referent) | 1.00 (referent) |
| 7–22 | 13 | 10 | 0.46 (0.13 to 1.69) | 0.68 (0.16 to 2.99) | |
| ≥23 | 20 | 13 | 0.55 (0.16 to 1.94) | 0.76 (0.17 to 3.34) | |
| P trend | .41 | .75 | |||
| Continuous, per 10 units | 0.90 (0.76 to 1.05) | 0.88 (0.73 to 1.06) | |||
* The numbers of case subjects and control subjects shown in the triple-negative, estrogen receptor (ER)+/human epidermal growth factor receptor (HER2)−, and HER2+ subgroups are the number of unique individuals in the various categories, reflecting the fact that analyses in these subgroups were conducted using unconditional logistic regression. The 518 records in the study derive from 481 unique study subjects (because of matching with replacement), including 222 unique control subjects; of the 259 control subjects, 189 of them served as control subjects once, 29 served as control subjects twice, and 4 served as control subjects three times (189 + 58 + 12 = 259). Two subjects had no ER data and therefore cannot be classified with respect to triple-negative or ER+/HER2− status, and 11 subjects did not fall into one of these three subgroups. The 104 observations in the dataset that were classified as triple-negative derived from 98 unique subjects; the 321 ER+/HER2− observations in the dataset derived from 295 unique subjects; and the 78 HER2+ observations in the dataset derived from 75 unique subjects.
† Results for all subjects combined were obtained using conditional logistic regression models, and results for breast cancer subtypes were obtained using unconditional logistic regression models. All multivariable analyses were adjusted for lymph node status, tumor size, tumor grade, and hormone therapy, categorized as shown in Table 1; subgroup analyses were additionally adjusted for age at diagnosis of breast cancer and duration of follow-up, with both fitted as continuous variables. For the analyses using the entire dataset, missing indicators were created for variables with missing values; for subset analyses, because the missing categories were not statistically different from the original reference groups, the missing categories were combined with the original reference group to form a new reference group. All statistical tests were two-sided.
‡ Triple-negative breast cancer is breast cancer that is ER−, progesterone receptor (PR)−, and HER2−.
IHC4 and Risk of Metastasis
In the ER+/HER2− subgroup, the median IHC4 score in the case subjects was higher than that in the control subjects (72.8, IQR = 9.4–125.5 vs 22.9, IQR = −18.7 to 114.0 (Supplementary Table 3, available online). Within this subgroup, the upper two tertile levels of the IHC4 score were both associated with statistically non- significant 60% increases in risk (Table 3). However, when IHC4 score was examined as a continuous variable, there was a 6% increase in risk per 10-unit increase in the score, which was of borderline statistical significance (OR = 1.06; 95% CI = 1.00 to 1.13). When evaluated overall and in the triple-negative and HER2+ subgroups, the change in risk per 10-unit increase in the IHC4 score did not differ statistically significantly from unity (in the triple-negative and HER2+ subgroups, risk was not estimable by tertiles given the distribution of subjects by IHC4 score).
Table 3.
Association between IHC4 score and risk of distant metastasis, overall, and by tumor subtype
| Tumor type | IHC4 category | Case subjects, No.* | Control subjects, No. | Odds ratio (95% confidence interval)† | |
|---|---|---|---|---|---|
| Univariate | Multivariable | ||||
| All subjects | ≤−7.81 | 49 | 86 | 1.00 (referent) | 1.00 (referent) |
| >−7.81 to 88.32 | 96 | 87 | 2.05 (1.27 to 3.32) | 1.50 (0.84 to 2.67) | |
| >88.32 | 113 | 85 | 2.53 (1.55 to 4.11) | 1.05 (0.55 to 2.01) | |
| P trend | <.001 | .93 | |||
| Continuous, per 10 units | 1.06 (1.03 to 1.09) | 1.01 (0.97 to 1.05) | |||
| Triple-negative‡ | Continuous, per 10 units | 0.91 (0.74 to 1.12) | 0.90 (0.66 to 1.22) | ||
| ER+/HER2− | ≤−7.81 | 49 | 71 | 1.00 (referent) | 1.00 (referent) |
| >−7.81 to 88.32 | 84 | 69 | 1.76 (1.10 to 2.84) | 1.62 (0.94 to 2.81) | |
| >88.32 | 14 | 8 | 2.54 (0.97 to 6.62) | 1.61 (0.48 to 5.47) | |
| P trend | .01 | .12 | |||
| Continuous, per 10 units | 1.09 (1.03 to 1.15) | 1.06 (1.00 to 1.13) | |||
| HER2+ | Continuous, per 10 units | 1.06 (0.94 to 1.20) | 1.07 (0.92 to 1.24) | ||
* The numbers of case subjects and control subjects shown in the triple-negative, estrogen receptor (ER)+/human epidermal growth factor receptor (HER2)−, and HER2+ subgroups are the number of unique individuals in the various categories, reflecting the fact that analyses in these subgroups were conducted using unconditional logistic regression. The 518 records in the study derive from 481 unique study subjects (because of matching with replacement), including 222 unique control subjects; of the 259 control subjects, 189 of them served as control subjects once, 29 served as control subjects twice, and 4 served as control subjects three times (189 + 58 + 12 = 259). Two subjects had no ER data and therefore cannot be classified with respect to triple-negative or ER+/HER2− status, and 11 subjects did not fall into one of these three subgroups. The 104 observations in the dataset that were classified as triple-negative derived from 98 unique subjects; the 321 ER+/HER2− observations in the dataset derived from 295 unique subjects; and the 78 HER2+ observations in the dataset derived from 75 unique subjects.
† Results for all subjects combined were obtained using conditional logistic regression models and results for breast cancer subtypes were obtained using unconditional logistic regression models. All multivariable analyses were adjusted for lymph node status, tumor size, tumor grade, and hormone therapy categorized as shown in Table 1; subgroup analyses additionally adjusted for age at diagnosis and duration of follow-up. All statistical tests were two-sided.
‡ Triple-negative breast cancer is breast cancer that is ER−, progesterone receptor (PR)−, and HER2−.
TMEM, IHC4, and Risk of Metastasis
TMEM score was only weakly correlated with IHC4 score (Spearman correlations = 0.09 in the entire study population, 0.12 in the ER+/HER2− subgroup). For ER+/HER2− disease, when TMEM score and IHC4 score were modeled simultaneously, together with clinical variables, the positive association of TMEM score with risk of distant metastasis persisted, whereas for IHC4 score there was a weak, positive association of borderline statistical significance, but only when IHC4 was analyzed as a continuous variable (6% increase in risk per 10-unit increase in IHC4 score) (Table 4). The positive association of TMEM score with risk was also evident and of similar magnitude when we fitted a multivariable regression model with TMEM score, the four markers included in the IHC4 score, and the clinical risk factors: the odds ratio for the highest vs the lowest tertile level of TMEM score was 2.67 (95% CI = 1.36 to 5.26) and the odds ratio per 10-unit increase in TMEM score was 1.16 (95% CI = 1.03 to 1.30).
Table 4.
Risk of distant metastasis in association with tumor microenvironment of metastasis (TMEM) score and IHC4 score (mutually adjusted) in the ER+/HER2− subgroup
| Variable | Category | Odds ratio (95% confidence interval)* |
|---|---|---|
| TMEM | ≤6 | 1.00 (referent) |
| 7–22 | 1.32 (0.69 to 2.51) | |
| ≥23 | 2.67 (1.36 to 5.26) | |
| P trend | .004 | |
| Continuous, per 10 units | 1.16 (1.03 to 1.30) | |
| IHC4 | ≤−7.81 | 1.00 (referent) |
| >−7.81 to 88.32 | 1.59 (0.91 to 2.77) | |
| >88.32 | 1.70 (0.46 to 6.30) | |
| P trend | .14 | |
| Continuous, per 10 units | 1.06 (1.00 to 1.13) |
* Results were obtained using an unconditional logistic regression
model with adjustment for lymph node status, tumor size, tumor
grade, hormone therapy, categorized as shown in Table 1, as well as age at
diagnosis, and duration of follow-up.
TMEM Composite Score
A TMEM composite score was derived for the ER+/HER2− breast cancer subgroup by fitting a multivariable logistic regression model with TMEM score and the clinical variables. This yielded a linear equation with the estimated coefficients from the multivariable logistic regression as weights. Specifically,
where “I” is an indicator variable for each binary category.
ROC Curves
Figure 3 shows the ROC curves and the associated AUCs in the ER+/HER2− breast cancer subgroup for TMEM score alone, for the TMEM composite score, and for the IHC4 score. The AUCs for TMEM score and IHC4 score were similar, whereas that for the TMEM composite score was higher than those for the other two (for the two nested models, TMEM composite score vs TMEM alone: P < .001). The cross-validated ROC/AUC for the TMEM composite score showed little difference from the ROC/AUC estimated using all of the data (AUC = 0.74 for the former and 0.78 for the latter) (Supplementary Figure 2, available online), indicating minimal overoptimism. As reflected in the respective AUCs for TMEM score and the TMEM composite score, for comparable sensitivities (or specificities), the corresponding specificity (sensitivity) was higher with the TMEM composite score (Table 5). Defining a low-risk group as those with TMEM composite scores less than or equal to −0.94 (90% sensitivity) and a high-risk group as those with TMEM composite scores greater than or equal to 0.70 (90% specificity), we estimated that the absolute risks of distant metastasis in the low-, medium-, and high-risk groups were 5.9% (95% CI = 5.1% to 6.9%), 14.1% (95% CI = 13.0% to 15.2%), and 30.3% (95% CI = 26.1% to 35.4%), respectively (Supplementary Methods, available online).
Figure 3.
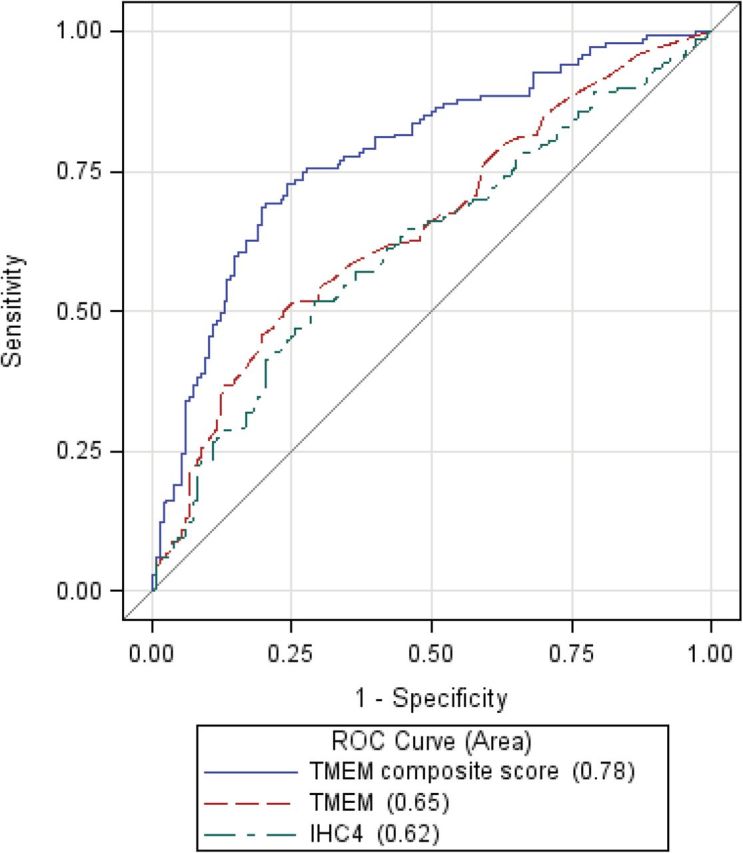
Receiver operating characteristic (ROC) curves for tumor microenviroment of metastasis (TMEM) score, TMEM composite score, and IHC4 score in the estrogen receptor (ER)+/human epidermal growth factor receptor (HER2)− subgroup.
Table 5.
Sensitivity and specificity of tumor microenvironment of metastasis (TMEM) score and the TMEM composite score for various cutpoints in the estrogen receptor–positive/human epidermal growth factor receptor–negative subgroup.
| Variable | Risk group | Cutpoint for risk group | Sensitivity (95% confidence interval) | Specificity (95% confidence interval) |
|---|---|---|---|---|
| TMEM score | Low risk | ≤2 | 0.90 (0.87 to 0.93) | 0.18 (0.14 to 0.22) |
| ≤4 | 0.85 (0.81 to 0.89) | 0.30 (0.25 to 0.35) | ||
| ≤7 | 0.80 (0.75 to 0.85) | 0.37 (0.31 to 0.43) | ||
| High risk | ≥29 | 0.46 (0.40 to 0.52) | 0.80 (0.75 to 0.85) | |
| ≥37 | 0.37 (0.31 to 0.43) | 0.85 (0.81 to 0.89) | ||
| ≥50 | 0.26 (0.21 to 0.31) | 0.91 (0.88 to 0.94) | ||
| Composite score | Low risk | ≤−0.94 | 0.90 (0.85 to 0.95) | 0.32 (0.24 to 0.39) |
| ≤−0.68 | 0.85 (0.79 to 0.91) | 0.51 (0.43 to 0.59) | ||
| ≤−0.40 | 0.80 (0.74 to 0.87) | 0.60 (0.52 to 0.68) | ||
| High risk | ≥0.00 | 0.69 (0.61 to 0.76) | 0.80 (0.73 to 0.86) | |
| ≥0.19 | 0.60 (0.52 to 0.68) | 0.85 (0.79 to 0.91) | ||
| ≥0.70 | 0.43 (0.35 to 0.51) | 0.90 (0.85 to 0.95) |
Discussion
TMEM is a microanatomic structure that is indicative of tumor cell intravasation and is identifiable and quantifiable in formalin-fixed paraffin-embedded tissue. The results of this population-based cohort study indicate that there is a positive association between TMEM score and risk of distant metastasis in women with ER+/HER2− breast cancer, a subgroup encompassing approximately 60% of all breast cancers. Specifically, risk of distant metastasis was increased 2.7-fold for women with tumors in the highest TMEM score tertile category compared with the lowest, independently of key clinical variables. In contrast, the association of IHC4 score with risk of distant metastasis for the ER+/HER2− group was much smaller in magnitude and weaker in statistical significance. Further, inclusion of IHC4 score in the same model with TMEM score did not diminish either the magnitude or the statistical significance of TMEM score, which suggests that TMEM score is more strongly associated with risk of distant breast cancer metastasis than IHC4 score and, by extension, Oncotype DX.
Our further examination of the prognostic value of TMEM showed that the TMEM composite score had moderate to good discriminatory power in the ER+/HER2− breast cancer subgroup (AUC = 0.78). Of interest, MammaPrint was shown to have an AUC of 0.681 for prediction of distant metastasis at 5 years in patients with node-negative breast tumors of 5cm or less who had not received adjuvant systemic therapy (34), and Oncotype DX was shown to have an AUC of 0.69 for prediction of distant metastasis at 5 years in patients with ER+/HER2− disease and zero to three positive axillary nodes treated with adjuvant chemotherapy and endocrine therapy (35).
Our findings raise the possibility that, subject to further validation, TMEM score might be used to guide treatment decisions. In this regard, we used two cutpoints of the TMEM composite score to create three risk groups. Given that we conducted our investigation as a case–control study, we were not able to directly calculate the absolute risk of metastasis by level of the TMEM composite score. Nevertheless, with appropriate assumptions, we estimated that the absolute risk of distant metastasis for the low-, medium-, and high-risk groups was 5.9%, 14.1%, and 30.3%, respectively. The ultimate goal with respect to treatment decisions would be to offer aggressive treatment to the high-risk group while allowing the low-risk group to avoid unnecessary aggressive treatment. The question of what treatment to offer those in the intermediate-risk category might be resolved by conducting a randomized trial to compare aggressive (eg, chemotherapy and hormonal therapy) vs less-aggressive therapy (eg, hormonal therapy alone), as is currently being done in the TAILORx trial with the Oncotype DX assay (36).
The TMEM assay is mechanism-based. It derives from high-resolution studies of rat, mouse, and human mammary tumors designed to understand the interaction between tumor cells and their microenvironment. Specifically, intravital multiphoton imaging in these mammary tumors has demonstrated that the increased expression of proinvasion isoforms of Mena (detected by the pan-Mena antibody) is observed in macrophage-associated tumor cells involved in streaming migration and intravasation at TMEM (7,10,11,13,37,38). Mena (39–41) is an Ena/VASP protein family member that is a key actin polymerization regulatory protein (13,42–44). Knockout of the Mena gene delays tumor progression and dramatically decreases metastasis in highly aggressive polyoma middle-T transgenic mouse mammary tumors due to decreased intravasation (8). This phenotype results from the requirement of the proinvasion isoforms of Mena for efficient paracrine signaling between macrophages and tumor cells (7,11,16,45). Perivascular macrophages, a key component of TMEM, attract Mena overexpressing tumor cells to blood vessels by paracrine signaling and facilitate tumor cell intravasation by stimulating RhoA activation and invadopodium initiation in tumor cells upon direct contact (7,10–12,45,46).
This study had several strengths and some limitations. Strengths include evaluation of a mechanism-based marker and the prospective, population-based design with prespecified breast cancer subtype analyses, long follow-up, central grading and ER/PR/Ki67 and HER2/neu testing, and the large sample size; in fact, this study included more case patients with distant metastasis than studies that have evaluated other predictors of distant metastasis (34,47–50). Furthermore, we were able to provide estimates of test sensitivity and specificity. Limitations include the fact that tumor tissue was not obtained for all potentially eligible subjects and the relatively small sample size of the triple-negative and HER2+ subgroups.
In conclusion, our findings indicate that TMEM score is positively associated with risk of distant metastasis in women with ER+/HER2− breast cancer and provides prognostic information that is independent of IHC4 score and other clinicopathologic risk factors. According to the schema of Simon et al. (51), this study provides level 2, category C evidence supporting the prognostic information provided by the TMEM score. Additional validation studies are required to provide confirmatory information supporting the clinical validity and utility of the TMEM assay.
Funding
This work was supported by Metastat, Inc. M. Oktay is supported by RO1 CA170507. J. Condeelis is supported by PO1 CA100324. J. Jones is supported by the Integrated Imaging Program of the Albert Einstein College of Medicine.
Supplementary Material
T. E. Rohan, X. Xue, J. Sparano, J. Condeelis, and J. G. Jones were responsible for conception and design of the study. T. E. Rohan, T. M. D’Alfonso, P. S. Ginter, M. H. Oktay, B. D. Robinson, F. Gertler, M. Ginsberg, A. G. Glass, J. Condeelis, and J. G. Jones were responsible for collection and assembly of data. T. E. Rohan, X. Xue, H.-M. Lin, and J. Sparano were responsible for data analysis and interpretation. All authors were responsible for manuscript writing and final approval of the manuscript.
The funders had no role in the design of the study; the collection, analysis, and interpretation of the data; the decision to publish; or the writing of the manuscript.
References
- 1. Cancer Genome Atlas Network. Comprehensive molecular portraits of human breast tumours. Nature. 2012;490(7418):61–70. [DOI] [PMC free article] [PubMed] [Google Scholar]
- 2. Weigelt B, Peterse JL, van ‘t Veer LJ. Breast cancer metastasis: markers and models. Nat Rev Cancer. 2005;5(8):591–602. [DOI] [PubMed] [Google Scholar]
- 3. Sparano JA, Fazzari M, Kenny PA. Clinical application of gene expression profiling in breast cancer. Surg Oncol Clin N Am. 2010;19(3):581–606. [DOI] [PubMed] [Google Scholar]
- 4. Fan C, Oh DS, Wessels L, et al. Concordance among gene-expression-based predictors for breast cancer. N Engl J Med. 2006;355(6):560–569. [DOI] [PubMed] [Google Scholar]
- 5. Wirapati P, Sotiriou C, Kunkel S, et al. Meta-analysis of gene expression profiles in breast cancer: toward a unified understanding of breast cancer subtyping and prognosis signatures. Breast Cancer Res. 2008;10(4):R65. [DOI] [PMC free article] [PubMed] [Google Scholar]
- 6. Valastyan S, Weinberg RA. Tumor metastasis: molecular insights and evolving paradigms. Cell. 2011;147(2):275–292. [DOI] [PMC free article] [PubMed] [Google Scholar]
- 7. Roussos ET, Balsamo M, Alford SK, et al. Mena invasive (MenaINV) promotes multicellular streaming motility and transendothelial migration in a mouse model of breast cancer. J Cell Sci. 2011;124(Pt 13):2120–2131. [DOI] [PMC free article] [PubMed] [Google Scholar]
- 8. Roussos ET, Wang Y, Wyckoff JB, et al. Mena deficiency delays tumor progression and decreases metastasis in polyoma middle-T transgenic mouse mammary tumors. Breast Cancer Res. 2010;12(6):R101. [DOI] [PMC free article] [PubMed] [Google Scholar]
- 9. Wyckoff J, Wang W, Lin EY, et al. A paracrine loop between tumor cells and macrophages is required for tumor cell migration in mammary tumors. Cancer Res. 2004;64(19):7022–7029. [DOI] [PubMed] [Google Scholar]
- 10. Wyckoff JB, Wang Y, Lin EY, et al. Direct visualization of macrophage-assisted tumor cell intravasation in mammary tumors. Cancer Res. 2007;67(6):2649–2656. [DOI] [PubMed] [Google Scholar]
- 11. Patsialou A, Bravo-Cordero JJ, Wang Y, et al. Intravital multiphoton imaging reveals multicellular streaming as a crucial component of in vivo cell migration in human breast tumors. IntraVital. 2013;2(2):e25294. [DOI] [PMC free article] [PubMed] [Google Scholar]
- 12. Roh-Johnson M, Bravo-Cordero JJ, Patsialou A, et al. Macrophage contact induces RhoA GTPase signaling to trigger tumor cell intravasation [published online ahead of print September 23, 2013]. Oncogene. 10.1038/onc.2013.377. [DOI] [PMC free article] [PubMed] [Google Scholar]
- 13. Goswami S, Philippar U, Sun D, et al. Identification of invasion specific splice variants of the cytoskeletal protein Mena present in mammary tumor cells during invasion in vivo. Clin Exp Metastasis. 2009;26(2):153–159. [DOI] [PMC free article] [PubMed] [Google Scholar]
- 14. Di Midugno F, Bronzi G, Scanlan MJ, et al. Human Mena protein, a serex-defined antigen overexpressed in breast cancer eliciting both humoral and CD8+ T-cell immune response. Int J Cancer. 2004;109(6):909–918. [DOI] [PubMed] [Google Scholar]
- 15. Di Modugno F, Mottolese M, Di Benedetto A, et al. The cytoskeleton regulatory protein hMena (ENAH) is overexpressed in human benign breast lesions with high risk of transformation and human epidermal growth factor receptor-2-positive/hormonal receptor-negative tumors. Clin Cancer Res. 2006;12(5):1470–1478. [DOI] [PubMed] [Google Scholar]
- 16. Philippar U, Roussos ET, Oser M, et al. A Mena invasion isoform potentiates EGF-induced carcinoma cell invasion and metastasis. Dev Cell. 2008;15(6):813–828. [DOI] [PMC free article] [PubMed] [Google Scholar]
- 17. Bear JE, Gertler FB. Ena/VASP: towards resolving a pointed controversy at the barbed end. J Cell Sci. 2009;122(12):1947–1953. [DOI] [PMC free article] [PubMed] [Google Scholar]
- 18. Robinson BD, Sica GL, Liu YF, et al. Tumor microenvironment of metastasis in human breast carcinoma: a potential prognostic marker linked to hematogenous dissemination. Clin Cancer Res. 2009;15(7):2433–2441. [DOI] [PMC free article] [PubMed] [Google Scholar]
- 19. Cuzick J, Dowsett M, Pineda S, et al. Prognostic value of a combined estrogen receptor, progesterone receptor, Ki-67, and human epidermal growth factor receptor 2 immunohistochemical score and comparison with the Genomic Health recurrence score in early breast cancer. J Clin Oncol. 2011;29(32):4273–4278. [DOI] [PubMed] [Google Scholar]
- 20. Kim C, Paik S. Gene-expression-based prognostic assays for breast cancer. Nat Rev Clin Oncol. 2010;7(6):340–347. [DOI] [PubMed] [Google Scholar]
- 21. Glass AG, Lacey JV, Jr, Carreon JD, et al. Breast cancer incidence, 1980–2006: combined roles of menopausal hormone therapy, screening mammography, and estrogen receptor status. J Natl Cancer Inst. 2007;99(15):1152–1161. [DOI] [PubMed] [Google Scholar]
- 22. Elston CW, Ellis IO. Pathological prognostic factors in breast cancer. I. The value of histological grade in breast cancer: experience from a large study with long-term follow-up. Histopathology. 1991;19(5):403–410. [DOI] [PubMed] [Google Scholar]
- 23. Genestie C, Zafrani B, Asselain B, et al. Comparison of the prognostic value of Scarff-Bloom-Richardson and Nottingham histological grades in a series of 825 cases of breast cancer: major importance of the mitotic count as a component of both grading systems. Anticancer Res. 1998;18(1B):571–576. [PubMed] [Google Scholar]
- 24. Lebrand C, Dent EW, Strasser GA, et al. Critical role of Ena/VASP proteins for filopodia formation in neurons and in function downstream of netrin-1. Neuron. 2004;42(1):37–49. [DOI] [PubMed] [Google Scholar]
- 25. Hammond ME, Hayes DF, Dowsett M, et al. American Society of Clinical Oncology/College Of American Pathologists guideline recommendations for immunohistochemical testing of estrogen and progesterone receptors in breast cancer. J Clin Oncol. 2010;28(16):2784–2795. [DOI] [PMC free article] [PubMed] [Google Scholar]
- 26. Wolff AC, Hammond ME, Schwartz JN, et al. American Society of Clinical Oncology/College of American Pathologists guideline recommendations for human epidermal growth factor receptor 2 testing in breast cancer. J Clin Oncol. 2007;25(1):118–145. [DOI] [PubMed] [Google Scholar]
- 27. Vielh P, Chevillard S, Mosseri V, et al. Ki67 index and S-phase fraction in human breast carcinomas. Comparison and correlations with prognostic factors. Am J Clin Pathol. 1990;94(6):681–686. [DOI] [PubMed] [Google Scholar]
- 28. Dowsett M, Nielsen TO, A’Hern R, et al. Assessment of Ki67 in breast cancer: recommendations from the International Ki67 in Breast Cancer working group. J Natl Cancer Inst. 2011;103(22):1656–1664. [DOI] [PMC free article] [PubMed] [Google Scholar]
- 29. Pepe MS. The receiver operating characteristic curve. In: The Statistical Evaluation of Medical Tests for Classification and Prediction. New York: Oxford University Press; 2006:66–95. [Google Scholar]
- 30. Seshan VE, Gönen M, Begg CB. Comparing ROC curves derived from regression models. Statist Med. 2013;32(9):1483–1493. [DOI] [PMC free article] [PubMed] [Google Scholar]
- 31. Stone M. Cross-validatory choice and assessment of statistical predictions. J Royal Stat Soc. 1974;36(2):111–147. [Google Scholar]
- 32. Efron B. Estimating the error rate of a prediction rule: improvement on cross-validation. J Am Stat Assoc. 1983;78(382):316–331. [Google Scholar]
- 33. McShane LM, Altman DG, Sauerbrei W, et al. Reporting recommendations for tumor marker prognostic studies. J Clin Oncol. 2005;23(36):9067–9072. [DOI] [PubMed] [Google Scholar]
- 34. Buyse M, Loi S, van’t Veer L, et al. Validation and clinical utility of a 70-gene prognostic signature for women with node-negative breast cancer. J Natl Cancer Inst. 2006;98(17):1183–1192. [DOI] [PubMed] [Google Scholar]
- 35. Goldstein LJ, Gray R, Badve S, et al. Prognostic utility of the 21-gene assay in hormone receptor-positive operable breast cancer compared with classical clinicopathologic features. J Clin Oncol. 2008;26(25):4063–4071. Erratum in: J Clin Oncol. 2009;27(21):3566. [DOI] [PMC free article] [PubMed] [Google Scholar]
- 36. Zujewski JA, Kamin L. Trial assessing individualized options for treatment for breast cancer: the TAILORx trial. Future Med. 2008;4(5):603–610. [DOI] [PubMed] [Google Scholar]
- 37. Entenberg D, Wyckoff J, Gligorijevic B, et al. Setup and use of a two-laser multiphoton microscope for multichannel intravital fluorescence imaging. Nat Protoc. 2011;6(10):1500–1520. [DOI] [PMC free article] [PubMed] [Google Scholar]
- 38. Kedrin D, Gligorijevic B, Wyckoff J, et al. Intravital imaging of metastatic behavior through a mammary imaging window. Nat Methods. 2008;5(12):1019–1021. [DOI] [PMC free article] [PubMed] [Google Scholar]
- 39. Gertler F, Condeelis J. Metastasis: tumor cells becoming MENAcing. Trends Cell Biol. 2011;21(2):81–90. [DOI] [PMC free article] [PubMed] [Google Scholar]
- 40. Gertler FB, Niebuhr K, Reinhard M, et al. Mena, a relative of VASP and Drosophila Enabled, is implicated in the control of microfilament dynamics. Cell. 1996;87(2):227–239. [DOI] [PubMed] [Google Scholar]
- 41. Krause M, Dent EW, Bear JE, et al. Ena/VASP proteins: regulators of the actin cytoskeleton and cell migration. Annu Rev Cell Dev Biol. 2003;19:541–564. [DOI] [PubMed] [Google Scholar]
- 42. Patsialou A, Wang Y, Lin J, et al. Selective gene-expression profiling of migratory tumor cells in vivo predicts clinical outcome in breast cancer patients. Breast Cancer Res. 2012;14(5):R139. [DOI] [PMC free article] [PubMed] [Google Scholar]
- 43. Wang W, Goswami S, Lapidus K, et al. Identification and testing of a gene expression signature of invasive carcinoma cells within primary mammary tumors. Cancer Res. 2004;64(23):8585–8594. [DOI] [PubMed] [Google Scholar]
- 44. Wang W, Wyckoff JB, Goswami S, et al. Coordinated regulation of pathways for enhanced cell motility and chemotaxis is conserved in rat and mouse mammary tumors. Cancer Res. 2007;67(8):3505–3511. [DOI] [PubMed] [Google Scholar]
- 45. Roussos ET, Goswami S, Balsamo M, et al. Mena invasive (Mena(INV)) and Mena11a isoforms play distinct roles in breast cancer cell cohesion and association with TMEM. Clin Exp Metastasis. 2011;28(6):515–527. [DOI] [PMC free article] [PubMed] [Google Scholar]
- 46. Condeelis J, Pollard JW. Macrophages: obligate partners for tumor cell migration, invasion, and metastasis. Cell. 2006;124(2):263–266. [DOI] [PubMed] [Google Scholar]
- 47. Habel LA, Shak S, Jacobs MK, et al. A population-based study of tumor gene expression and risk of breast cancer death among lymph node-negative patients. Breast Cancer Res. 2006;8(3):R25. [DOI] [PMC free article] [PubMed] [Google Scholar]
- 48. Paik S, Shak S, Tang G, et al. A multigene assay to predict recurrence of tamoxifen-treated, node-negative breast cancer. N Engl J Med. 2004;351(27):2817–2826. [DOI] [PubMed] [Google Scholar]
- 49. Paik S, Tang G, Shak S, et al. Gene expression and benefit of chemotherapy in women with node-negative, estrogen receptor-positive breast cancer. J Clin Oncol. 2006;24(23):3726–3734. [DOI] [PubMed] [Google Scholar]
- 50. van de Vijver MJ, He YD, van’t Veer LJ, et al. A gene-expression signature as a predictor of survival in breast cancer. N Engl J Med. 2002;347(25):1999–2009. [DOI] [PubMed] [Google Scholar]
- 51. Simon RM, Paik S, Hayes DF. Use of archived specimens in evaluation of prognostic and predictive biomarkers. J Natl Cancer Inst. 2009;101(21):1446–1452. [DOI] [PMC free article] [PubMed] [Google Scholar]
Associated Data
This section collects any data citations, data availability statements, or supplementary materials included in this article.