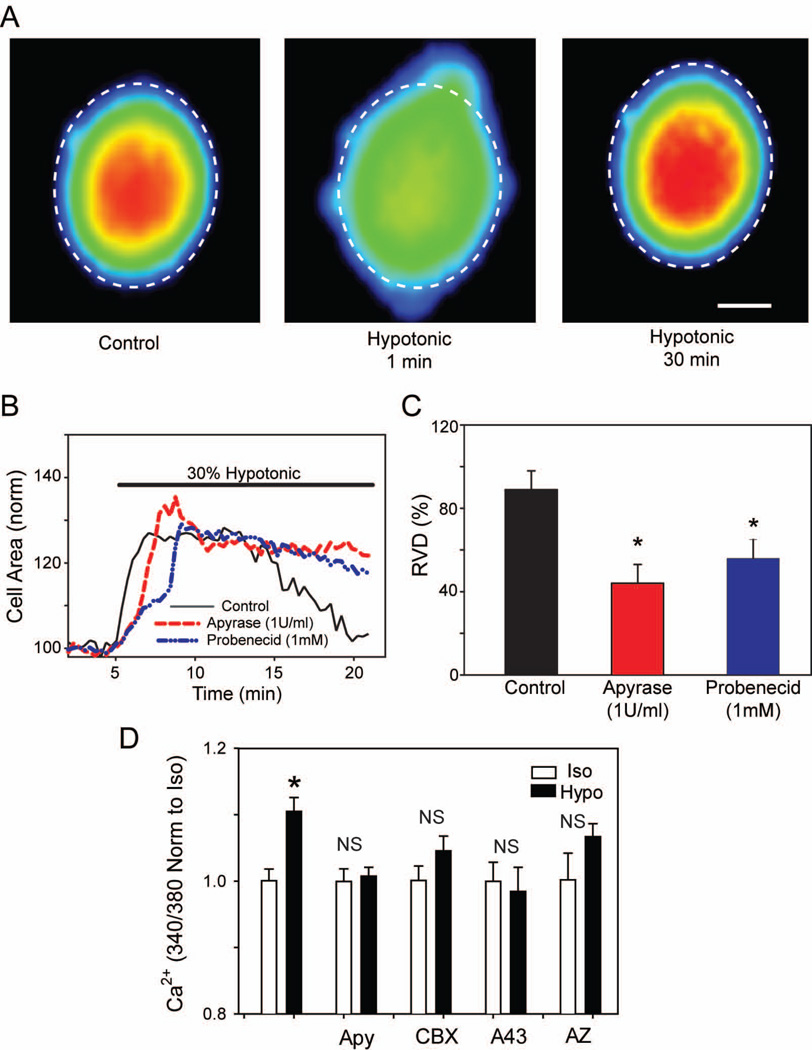
Figure 4.
Extracellular ATP plays a role in regulatory volume decrease and calcium signaling. (A): Example of increase in cell area with hypotonic solution and subsequent RVD. All three images are of the same control cell at different time points in the experiment. Dashed line indicates the circumference of the cell in isotonic conditions. Color indicates strength of calcein staining, with blue representing low intensity and red indicating high intensity, bar = 5µm. (B) Representative time courses depicting the changes in cell area of rat optic nerve head astrocytes following perfusion with a 30% hypotonic solution with or without treatment with compounds that decrease extracellular ATP concentrations. Control cells are represented as a solid black line; cells treated with apyrase (1U/ml) are represented as a dashed red line and cells treated with the pannexin antagonist probenecid (1mM) are represented as a dashed blue line. (C): Summary of the extent of the regulatory volume decrease 30 minutes after start of perfusion of hypotonic solution (defined in Methods); n=16, 11 & 14, respectively. *p<0.05. (D). The calcium rise induced by exposure of astrocytes to hypotonic solution is reduced by apyrase (Apy, 1U/ml), carbenoxelone (CBX, 10µM), A438079 (A43, 10 µM) and AZ10606120 (AZ, 10µM). The ratio of light excited at 340 and 380 nm in cells loaded with fura-2 is used as an index of Ca2+, with ratios normalized to the mean value in isotonic solution for each drug. *=p<0.05, NS = no significant difference, n=7–23.

