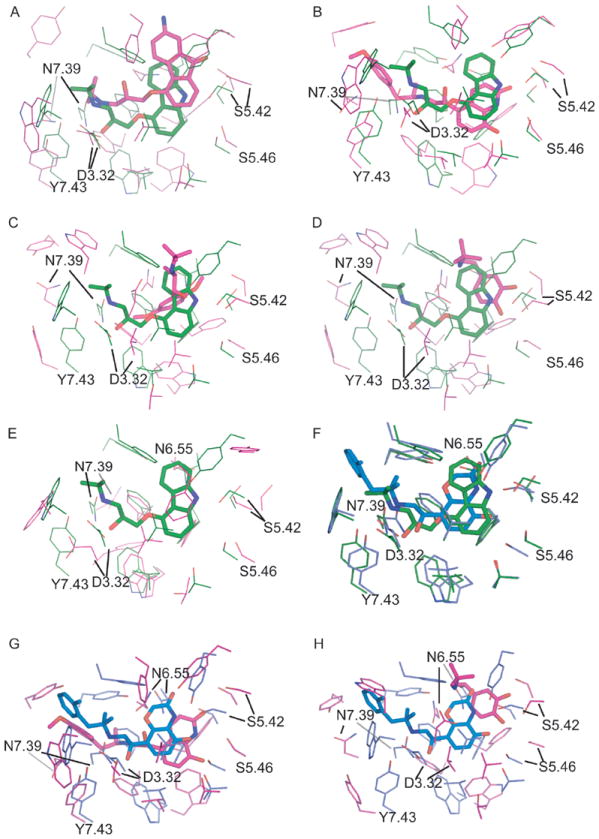
Figure 5.

The comparison of the binding pockets of theoretical models versus the β2AR crystal structures of inactive state (2RH1; A:CM1, B:CM2, C:CM3, D:CM4, E:AM1) and active state (3P0G; F:2RH1, G:CM2, H:CM4). The active sites were superimposed by Ca atoms of key binding site residues of 2RH1 (W3.28, D3.32, V3.33, V3.36, T3.38, F5.32, Y5.38, S5.42, S5.43, S5.46, W6.48, F6.51, F6.52, N6.55, Y7.35, N7.39, Y7.43). The crystal structures 2RH1 and 3P0G are colored in green and blue respectively, while the model structures are colored in pink.
