Abstract
Proton beam radiotherapy is an effective and non-invasive treatment for uveal melanoma. Recent research efforts have focused on improving the dosimetric accuracy of treatment planning and overcoming the present limitation of relative analytical dose calculations. Monte Carlo algorithms have been shown to accurately predict dose per monitor unit (D/MU) values, but this has yet to be shown for analytical algorithms dedicated to ocular proton therapy, which are typically less computationally expensive than Monte Carlo algorithms. The objective of this study was to determine if an analytical method could predict absolute dose distributions and D/MU values for a variety of treatment fields like those used in ocular proton therapy. To accomplish this objective, we used a previously validated Monte Carlo model of an ocular nozzle to develop an analytical algorithm to predict three-dimensional distributions of D/MU values from pristine Bragg peaks and therapeutically useful spread-out Bragg peaks (SOBPs). Results demonstrated generally good agreement between the analytical and Monte Carlo absolute dose calculations. While agreement in the proximal region decreased for beams with less penetrating Bragg peaks compared with the open-beam condition, the difference was shown to be largely attributable to edge-scattered protons. A method for including this effect in any future analytical algorithm was proposed. Comparisons of D/MU values showed typical agreement to within 0.5%. We conclude that analytical algorithms can be employed to accurately predict absolute proton dose distributions delivered by an ocular nozzle.
1. Introduction
Proton beam radiotherapy provides an effective, non-invasive treatment of uveal melanoma. The local control is 94.8% at 10 years following treatment (Egger et al 2001). In many cases, the therapy affords preservation of the organ and useful vision (Gragoudas and Marie Lane 2005, Munzenrider 2001). Recent research efforts have focused on improving the dosimetric accuracy of treatment planning and delivery (Herault et al 2005, Koch and Newhauser 2005, Newhauser et al 2002a). While pencil-beam algorithms have been developed for dose calculations of large-field proton beams for the treatment of a variety of sites (cf Hong et al 1996), treatment planning systems and algorithms for ocular proton therapy are highly specialized (Goitein and Miller 1983, Koch 2006, Koch et al 2006, Pfeiffer and Bendl 2001, Rethfeldt et al 2006, Sheen 2003). The pioneering work performed at the Harvard Cyclotron Laboratory yielded the first such system, EYEPLAN, which remains in widespread use today (Goitein and Miller 1983). However, Koch and Newhauser (2005) highlighted the need for dose calculations of increased accuracy. They reported on differences between EYEPLAN’s predicted relative dose distributions that differed from Monte Carlo (MC) calculations by up to 12% of the maximum dose or up to 30% of the local dose at shallow depths. Differences in the lateral beam penumbra were also presented. Rethfeldt et al (2006) incorporated several improvements to analytical ocular treatment planning including CT-based anatomical modeling, effects of tissue density variation and lateral widening of the beam due to wedges and tissue. Others have demonstrated the ability to overcome the limitation in accuracy associated with analytical dose algorithms by reporting on proof-of-principal studies that utilized the MC method (Herault et al 2007, Koch et al 2008, Newhauser et al 2005). A recent MC study revealed that the role of low-energy protons, e.g. protons scattered into the treatment field at the edges of collimator system, may be important (Titt et al 2008) in accurately predicting dose distributions in patient anatomy but may be difficult to model analytically. For these reasons, it was unclear whether an analytical dose algorithm would be able to predict dose distributions for ocular proton therapy with accuracy comparable to that of MC simulations, i.e. to within 3% (dose difference) or 0.05 cm distance-to-agreement (Koch et al 2008).
Similarly, another limitation of previously described analytical algorithms is that they do not predict the dose per monitor unit (D/MU) values, a common feature of algorithms for photons and electron beams. Recently, several promising approaches for predicting D/MU values were reported. D/MU predictions accurate to within 3% were reported by Kooy et al (2003) using an analytical algorithm developed for proton fields with a large cross-sectional area and deep penetration range. Herault et al (2007) reported a MC technique to predict D/MU values to within 2% for spread-out Bragg peaks (SOBPs) for collimator diameters between 0.75 and 3.4 cm. Koch et al (2008) demonstrated a MC approach to predict absolute absorbed dose distributions in the eye and in periocular structures. However, in clinical practice, it would be desirable to have two separate approaches to predict D/MU values, i.e. a primary method of D/MU calculation provided by the treatment planning system, and a secondary independent method such as measurement (Newhauser et al 2002b) or Monte Carlo calculations. As described here, MC algorithms have been shown to accurately predict D/MU values, but this has yet to be shown for analytical algorithms used in treatment planning systems dedicated to ocular proton therapy. MC calculations may also consume considerably more computational resources than analytical algorithms (Koch et al 2008), demonstrating the need for an accurate analytical algorithm.
The objective of this study was to determine if analytical methods could predict D/MU values at the center of an SOBP to within 0.5% of measured values for a variety of treatment fields relevant to ocular proton therapy. To accomplish this objective, we used a MC model of the ocular nozzle designed at Harvard Cyclotron Laboratory to develop an algorithm to predict three-dimensional (3D) distributions of D/MU from pristine Bragg peaks and therapeutically useful SOBPs. The accuracy of the MC model was previously verified with measured data and is used extensively here to provide data for the beam modeling as well as for comparison (Koch et al 2008). The MC model, the analytical algorithm presented here and their results are described further by Koch (2006).
2. Methods
2.1. Analytical algorithm to predict absorbed dose
In this section we describe an analytical dose algorithm, we refer to as EYEDOSE, that aims to predict relative proton dose distributions within ±3% and ±0.05 cm and absolute D/MU values within ±0.5% of measured values. The notable features of EYEDOSE are explicit modeling of the influence of edge-scattered protons on the cross-field shape, the effect of energy straggling in the distal portion of poly-energetic beams and modeling of absolute D/MU values.
The absorbed dose per monitor unit at any point in the target, D(x, y, z)/MU, can be calculated as the combination of two main terms, the central-axis dose term, D(z)/MU, and a dimensionless off-axis modifier term, OAM(x, y, z), such that
| (1) |
The coordinates (x, y, z) describe the location of the point of interest relative to the effective source location. That is, the point of interest is expressed in the source coordinate system whose origin lies at the effective source location. The +z-axis is aligned to the central axis of the beam and is directed toward the patient. The +x- and +y-axes are directed to the patient’s right and superiorly, respectively, as the patient looks upstream from isocenter in the seated treatment position.
The basic approach of equation (1) has been used in the pencil-beam algorithms reported by Hogstrom et al (1984) for electrons and by Hong et al (1996) for protons; many of the unique parameters of the EYEDOSE broad-beam algorithm developed here were additions or modifications to the broad-beam algorithm described in the latter study.
Range modulation is important in modeling clinical proton beams and was accomplished by summing the dose contributions from individual Bragg peaks. Applying this principle to equation (1) we obtain
| (2) |
where N is the total number of range modulation steps, with each corresponding to the ith step of the range modulator wheel.
Each term in equation (2) is calculated as a combination of many other terms such that D(z) is calculated by
| (3) |
and OAM(x, y, z) is calculated by
| (4) |
The terms on the right-hand side of the central-axis dose equation and off-axis modifier in equations (3) and (4), respectively, attempt to model changes in the proton beam that occur for a variety of beam modifiers and depths in the target. More detailed descriptions of each term presented are defined later. Substituting equations (3) and (4) into equation (2) yields the general dose equation for a modulated proton beam as
| (5) |
within the target. Note that the D(z) and OAM(x, y, z) terms can be separated because of their nearly complete independence from one another. Therefore, they will be discussed separately beginning first with D(z) as it appears in equation (3), to be followed immediately by descriptions of the terms in equation (4).
2.1.1. Depth-dose profile, DD, and effective depth, deff
In the simplest case, the first term of equation (3), DD(d), is the absolute absorbed dose profile along the beam’s central axis, in units of cGy/MU, which varies along the water-equivalent depth, d, in the target. This depth-dose profile is unique because it is acquired when the nozzle is free of all beam-modifying devices except those that are always present in the beam, such as the monitor chambers and beam scattering system. This elementary state of the nozzle is referred to as the ‘open-beam condition’ and the pristine Bragg peak shape in this state is referred to as the ‘open-beam depth-dose profile’. By default, this is the most penetrating beam the nozzle is capable of delivering. The beam range, R90, is defined as the distal depth in water at which the central-axis dose value falls to 90% of its maximum. As considered here, the SSD was fixed. This treatment setup was in keeping with the practice when using the Harvard Cyclotron Laboratories ocular treatment nozzle, which was considered in this work. The treatment setup for other institutions may vary.
As beam-modifying material is inserted into the beam’s path, the profile described by DD(d) is shifted upstream within the target by the water-equivalent thickness of the additional upstream material. With this shift, the dose at any point along the profile is determined at an effective depth, deff, which includes the range loss due to any additional beam-modifying material upstream. Specifically, deff is equal to the accumulation of the range loss in water due to energy losses in the range modulator wheel, variable degrader, and patient or water phantom and is used to lookup the value along the DD profile:
| (6) |
Range loss in water due to the modulator step is given by
| (7) |
where T is the physical modulator step thickness; ρmod and ρw are the mass densities of the range modulator material (polymethyl methacrylate (PMMA)) and water, respectively; and the final term is the ratio of mean mass stopping powers of PMMA to water (Newhauser et al 2002c). Because the ratio of the mass stopping powers was only slightly dependent on energy, a constant value of 0.976 for PMMA was used, similar to the approach taken by Hong et al (1996). A theoretical basis for this approximation was recently derived by Zhang and Newhauser (2009).
In contrast, the range loss in water due to the variable degrader, rdeg, was conveniently determined from the difference between the deepest penetrating Bragg peak of interest and the penetration depth of the open-beam depth-dose profile, i.e. the range loss in the variable degrader is not calculated similar to rmod using equation (7). Because the phantom and eye model are water equivalent, the range loss that occurred in the patient, rpat, is equal to the product of the number of the voxels upstream from the point of interest to the surface and the voxel thickness. Thus, DD (deff) is an important contributor to the calculation of absorbed dose in EYEDOSE.
2.1.2. Range modulator wheel fluence weighting factor, ωRMW
To create a modulated beam, several pristine Bragg peaks of various ranges are superimposed. Therefore, the dose at any point is the sum of the dose to that point from shifted Bragg peaks created by the increasing step thicknesses of the range modulator wheel. The total opening angle of each step thickness per revolution of the range modulator wheel determines the fluence weighting factor ωRMW. That is, the fluence weighting factor reflects the fraction of the total fluence incident upon each modulation step. Thus, the summation of a modulated beam is described by equation (5) where ωRMW considers the fluence weight of the ith range modulator wheel step, the design of which is an input parameter for the algorithm. In addition, multiple Coulomb scattering within the range modulator wheel reduces the fluence of the beam, and this was parameterized separately, as described below.
2.1.3. Scatter and attenuation fluence weighting factor, ωSAF
As the initial proton beam is degraded by the range shifter and range modulator wheel, multiple Coulomb scattering and nuclear interactions within these components reduce the proton fluence and produce a shift in the effective source location. In order to take into account these effects, an empirically deduced proton fluence correction factor, ωSAF, was introduced. The fluence reductions strongly influenced the D/MU values for this nozzle design because the monitor chambers were located in close proximity to the effective source.
The central purpose of ωSAF is to parameterize the decrease in the D/MU value of the Bragg peak as a function of decreasing beam range. The beam range at the surface of the patient may be reduced by the range modulator wheel or variable degrader. For the nozzle design studied here, the initial beam energy at the nozzle entrance is 159 MeV, but a fixed degrader reduces the energy to a more clinically useful 70 MeV. This energy degradation is also the dominant source of beam spreading, making the lateral spread of the beam insensitive to the location of additional modulating material. Therefore, changes to the beam range were accomplished using the variable degrader. This fluence weighting factor was deduced by plotting MC simulation results of the peak D/MU value for beams of several arbitrary residual ranges, Darb, normalized to the peak D/MU value of the open beam, Dopen, as given by
| (8) |
Thus, by definition ωSAF is unity for the open-beam condition. Note that the aperture size was kept constant in the calculations of Darb and Dopen. Adding beam-modifying material upstream causes increased scattering and fluence losses, and therefore shallower beams have ωSAF values less than unity. Furthermore, adding material upstream results in a decreased beam range, so the depth of the Bragg curve peak, where Darb was determined, is shallower and closer to the source. However, by our definition, ωSAF specifically excludes changes in D/MU for a Bragg peak that has shifted upstream due to the inverse square law effect, which is taken into account separately. Therefore, the inverse square effect present in Darb needs to be removed for the proper parameterization of ωSAF. To that end, the value given above for Darb is actually the peak D/MU value after having removed the inverse square effect by multiplying the raw MC-calculated peak D/MU, D′arb value by the reciprocal of an inverse square term. That is,
| (9) |
where darb is the depth in water of the Bragg peak where the value of D′arb is calculated. Similarly, dopen is the depth in water where Dopen is calculated, and SSD is distance from the effective source position of the open beam to the phantom surface. Then ωSAF was parameterized using a third-order polynomial fit of its value as a function of R90 for six simulated pristine Bragg peaks with ranges from 0.7 cm to 4.0 cm.
The scatter and attenuation fluence weighting factor values were determined using a constant value of SSD, regardless of the change in effective source position as a function of energy degradation. Therefore, to a first order, ωSAF implicitly takes into account the effect of variations in the effective source position that occur for beam ranges other than those yielded by an open beam.
2.1.4. Inverse square correction
The last physical effect on the fluence along the z-axis that we shall consider is a correction for inverse square law reductions in the proton absorbed dose. This correction considers the increase in the peak D/MU of the Bragg curve as it is shifted upstream solely because it is closer to the effective source position and is given as
| (10) |
where SSD is the distance from the effective source position to the phantom surface calculated under the open-beam condition, deff is the effective depth as given by equation (6) and z is the distance from the effective source to the point of interest.
Now, all the terms listed in equation (3) have been described, and the focus will now shift to describing the terms in equation (4) that consider the dose at off-axis locations.
2.1.5. Collimation modifier, Γ
The proton beam undergoes multiple Coulomb scattering in the range modulator wheel, variable degrader, fixed degrader and patient. The scattering increases the Gaussian width, or lateral spread, of the beam, thus increasing the width of the lateral dose falloff region (Gottschalk et al 1993). In practice, the patient-specific collimating aperture provides a rapid lateral falloff of dose. In the present study, the collimator was modeled as an infinitely thin slab that stopped all particles incident upon it. The lateral dose falloff, or penumbra, was modeled by the convolution of the Gaussian beam profile over a Heaviside step function. Mathematically, this calculation reduces the off-axis term, Γ, to the evaluation of an error function,
| (11) |
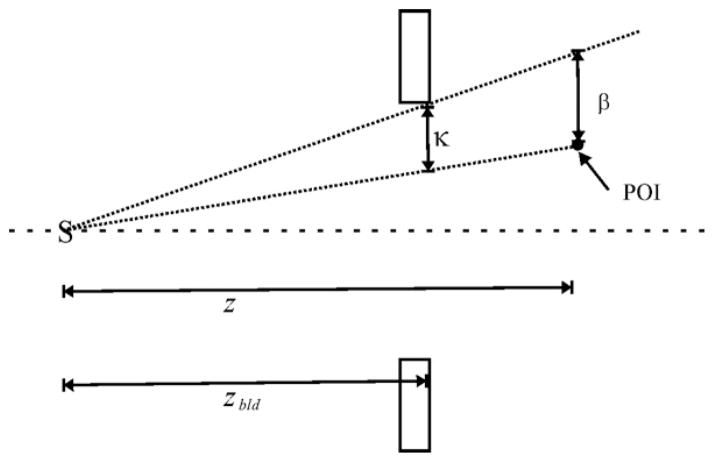
where σtot is the 1−σ width of the Gaussian beam profile at the point of interest, β is defined as the lateral distance between a ray cast from the effective source location to the point of interest and another ray through the collimator’s edge from the effective source location projected to the z-position of the point of interest. This is calculated using the following equation:
| (12) |
and is illustrated schematically in figure 1.
Figure 1.
Diagram of the calculation of β. The distances shown are z, the distance from the effective source (S) to the point of interest (POI); zbld, the distance from S to the aperture; and κ, the distance between the two rays cast from S to the aperture and from S to the POI, as determined at the location of the aperture. Adapted from Koch (2006).
The value of σtot is determined by adding σsrc and σpat in quadrature according to
| (13) |
where z is the distance from the effective source of the open beam to the point of interest in the patient, zbld is the distance from the effective source of the open beam to the beam-limiting device, i.e. the aperture. The value of σpat considers the lateral spreading of the beam due to scatter in the patient. The value of σsrc is the quadrature sum of the transverse beam widths in the inherent open-beam size, σopen, the scatter in the range modulator wheel, σmod, and variable degrader, σdeg,
| (14) |
Note that σopen inherently includes the scatter contribution from the fixed degrader and other nozzle components always present in the beam. Therefore, σtot ≥ σopen in all cases since the addition of more material into the beam acts only to add more transverse beam width to the open-beam condition. Further, because the multiple Coulomb scattering within the fixed degrader of the Harvard Cyclotron Laboratory ocular nozzle dominates the Gaussian profile of the open beam as observed at the nozzle exit, σopen is considered axially symmetric as it enters the nozzle (Koch et al 2008). The analytical calculations of the contributions to the Gaussian beam width contained in σmod and σdeg were described by Gottschalk et al (1993). The calculation of σpat was taken from Hong et al (1996) where after numerical integration the transverse beam size as a function of R90 is given as
| (15) |
Here, the value of σpat must be computed for the individual Bragg peaks that comprise the SOBP, so R90 depends on the range of the ith beam over the summation in equation (5).
More detailed descriptions of the calculations of σmod, σdeg and σpat have been described excellently by Gottschalk et al (1993) and Hong et al (1996). For this work, the calculations presented by Hong et al were adopted and tabulated for quick lookup during the calculations of this algorithm.
2.1.6. Off-axis ratio, OAR
The collimation modifier described above models changes in the lateral beam penumbra width, whereas the off-axis ratio, OAR, models change in the lateral beam profile within the high-dose region of the beam. This uncollimated lateral beam profile was modeled by a Gaussian function normalized to unity on the central axis. The width of this Gaussian increased with depth in the patient due to multiple Coulomb scattering (Gottschalk et al 1993) and geometric magnification of the accumulated transverse widths, e.g. σsrc. The OAR models these effects as a function of the residual range and off-axis distance. Previous analytical algorithms have ignored one or both of these dependences. Hong et al considered a similar factor at one depth and referred to it the cross-field intensity profile. In EYEPLAN (Sheen 2003), a widely used broad-beam algorithm, all off-axis dependences of the cross-field intensity are neglected and the high-dose region of the SOBP is approximated as being uniformly flat. These assumptions slightly limit the accuracy of those algorithms in predicting cross-field dose profiles. Therefore, a key distinction between EYEDOSE and this previous work is the parameterization of these dependences using a Gaussian function such as
| (16) |
where r is the radial distance to the central axis and σΨ characterizes the Gaussian width of the beam profile as a function of the reduced range, which is described below.
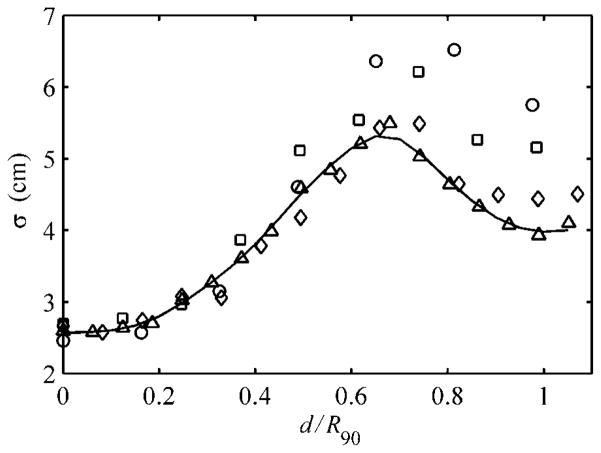
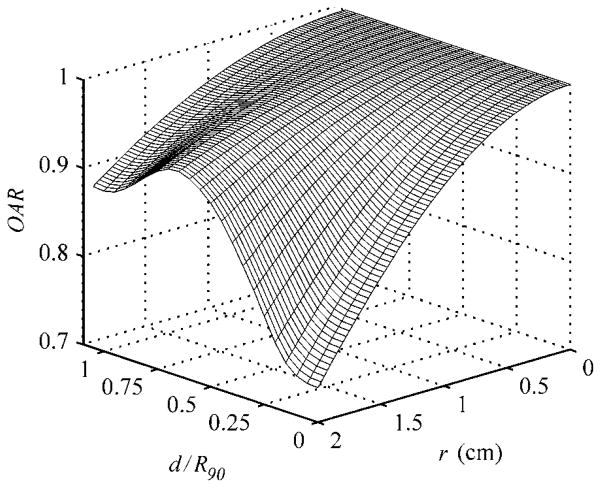
The OAR term requires the parameterization of σΨ as a function of depth, d, which implicitly takes into account the influence of edge-scattered protons and multiple Coulomb scattering in the patient relative to the central-axis dose given by equation (3). However, the reader should be cautioned that the OAR term does not model edge-scattered protons in depth, the importance of which will be shown in section 3.2 later. To determine σΨ at arbitrary depths, a Gaussian curve was fit to the normalized cross-field profiles of the four unmodulated beams considered in this work, beginning at the water phantom surface to a depth of 4.5 cm in 0.25 cm increments. A plot of the Gaussian widths, σ, as a function of the reduced range shown in figure 2 illustrates that the change in field flatness width depth was very similar among the four pristine beams. Recall that the reduced range is the water-equivalent depth in the target divided by the initial range of the proton beam at the phantom surface, i.e. d/R90. A fourth-order spline fit to the open beam was used in this work to demonstrate the accuracy achievable by EYEDOSE while relying on the most elementary beam condition as much as possible. The spline fit provided the means to calculate σΨ for arbitrary depths in the target. Though in practice, a two-dimensional (2D) lookup table of OAR as a function of r and reduced range, as shown graphically in figure 3, was compiled at the dose grid resolution used to facilitate quick lookup during calculations.
Figure 2.
The Gaussian widths, σ, of pristine beams versus the reduced range for the 1500 (circle), 2000 (square), 3000 (diamond) and 4000 (triangle) Bragg peaks. The fourth-order spline curve (solid line) was fit to the 4000 beam data and used in the analytical algorithm. Adapted from Koch (2006).
Figure 3.
A surface plot of the axially symmetric OAR parameter as a function of reduced range and radial distance (r) from the central axis of the beam. Adapted from Koch (2006).
Following the above description of the off-axis ratio in equation (16), the description for the analytical calculation of dose at any point in a modulated proton beam, as given by equation (5), is complete. For brevity, the simulation and analysis of additional data needed to configure EYEDOSE are found in the appendix.
2.2. Measurements and MC calculations
Measurements were performed to benchmark the MC model used to develop and validate the analytical dose algorithm. The measurements included dose profiles and absolute dose values under several combinations of beam penetration ranges and range-modulation widths using a plane-parallel ionization chamber. Cross-field profiles were taken at several water-equivalent depths on radiochromic film (Type Gafchromic EBT, ISP Corp.).
All measurements and calculations were performed with a final collimator aperture diameter of 2.4 cm. Table 1 lists the eight combinations of penetration ranges and modulation widths considered in this work. For quick reference, each combination was given a unique beam label. For example, the open beam spoken of above will be referred to as the 4000 beam, according to the labeling given in this table. Also listed in the table are the water-equivalent depths at which the D/MU measurements were taken (Newhauser et al 2002b). To obtain the D/MU value at the maximum of each pristine Bragg peak, we measured D/MU at a water-equivalent depth of 0.9 cm and divided by the respective local percent depth dose value. For details of this and the other measurements and MC calculations, the reader is referred to Koch et al (2008).
Table 1.
Features of the eight beams considered in this work. These beams and depths are similar to those used previously by Koch et al (2008). Each combination of penetration range and modulation width in water was given a label for ease of reference. Shown in the three far right columns are the D/MU values calculated in a previous work, the D/MU values calculated by the present analytical algorithm and their percent difference.
| Beam label | Nominal range (cm) | Nominal modulation width (cm) | Calibration depth (cm) | MCa (cGy/MU) | Analytical (A) (cGy/MU) | (A-MC)/MC (%) |
|---|---|---|---|---|---|---|
| 1500 | 1.5 | – | 0.9 | 14.6 | 14.6 | 0.2 |
| 2000 | 2.0 | – | 0.9 | 16.5 | 16.5 | 0.3 |
| 3000 | 3.0 | – | 0.9 | 19.8 | 19.8 | −0.4 |
| 4000 | 4.0 | – | 0.9 | 22.8 | 22.8 | 0.0 |
| 2011 | 2.0 | 1.1 | 1.5 | 11.6 | 11.7 | 0.5 |
| 2020 | 2.0 | 2.0 | 0.93 | 8.4 | 8.6 | 2.5 |
| 3015 | 3.0 | 1.5 | 2.3 | 13.0 | 13.0 | 0.0 |
| 3030 | 3.0 | 3.0 | 2.0 | 9.9 | 9.9 | 0.2 |
From Koch et al (2008).
3. Results
In this section, the results from MC simulations used to generate the needed data for the development and configuration of the algorithm are presented first. Those results are followed by a comparison of profiles from analytical calculations and previously published MC simulations, and when available ionization chamber and film measurements for corroboration. The accuracy of the MC model was described previously (Koch et al 2008).
3.1. Comparisons of dose calculations in a water phantom
3.1.1. Depth-dose profiles
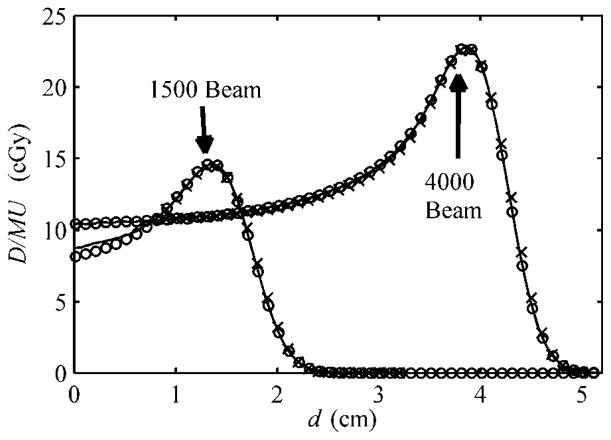
Figure 4 shows the measured and calculated profiles, by MC and EYEDOSE, for the 1500 and 4000 beams, in a flat-surfaced water phantom. The analytically calculated profile of the 4000 beam shown here agreed with its MC counterpart to within 0.1% of the MC-calculated peak D/MU value. Recall this depth-dose profile, under the open-beam condition, served as the central-axis profile for lookup during analytical calculations. Therefore, the analytically calculated profile of the 4000 beam shown here demonstrates the correct configuration of the central-axis data. Similarly, the analytically calculated profile of the 1500 beam agreed with its MC counterpart to within −4.1% of the MC-calculated peak D/MU value near the surface but was within 0.3% near the peak. The phenomenon of increasing differences at shallow depths with decreasing range is described more in section 3.2, and, as will be shown below, appears to some extent in the comparison of the SOBPs.
Figure 4.
The depth-dose profiles from calculations by MC (solid line), the analytical algorithm (open circle) and ionization chamber measurements (crosses) adapted from Koch et al (2008). Unmodulated beams with nominal ranges of 1.5 and 4 cm are indicated by the arrows according to the labeling described in table 1; they respectively represent the worst and best observed agreement among the unmodulated beams. The 4000 beam represents the open-beam condition described in the text and thus is more penetrating than modulated therapeutic beams. The Monte Carlo-calculated depth-dose profile of the 4000 beam is configuration data necessary for the analytical algorithm. The units shown are absolute dose per monitor unit (D/MU) and water-equivalent depth (d). The MC and measured data were adopted from Koch et al (2008).
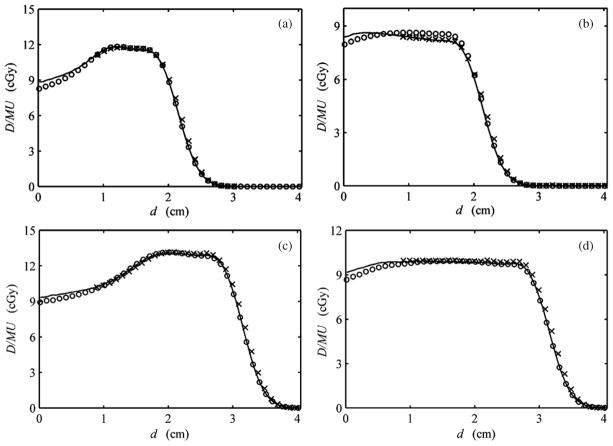
More clinically relevant comparisons are shown in figure 5 for all four SOBPs considered in this work. The MC and ionization measurements shown were adopted from Koch et al (2008). Overall, these analytically calculated profiles agreed with their corresponding MC profiles to within 5%. Except for the 2020 beam shown in figure 5(b), the largest discrepancy for each SOBP occurred near the phantom surface. Note that agreement beyond a depth of 0.7 cm was within 2% (figures 5(a), (c), (d)).
Figure 5.
Depth-dose profiles for SOBPs from MC (solid line), ionization chamber measurements (crosses) and analytical (open circles) calculations. The profiles here are for the (a) 2011, (b) 2020, (c) 3015 and (d) 3030 beams (see table 1). The units shown are absolute dose per monitor unit (D/MU) and water-equivalent depth (d). MC and measured data were adopted from Koch et al (2008).
It is worth noting that the 2020 beam shown in figure 5(b) represented a unique circumstance for the algorithm. As demonstrated by the ionization chamber measurement, and confirmed by the MC calculation, the plateau region of this fully modulated SOBP decreased distally with respect to the analytical calculation. The underestimated distal region of the plateau can be partially attributed to the range modulator wheel design, which was actually designed for a beam with greater range, i.e. 2.1 cm of range and modulation instead of 2.0 cm presented here.
Table 2 shows additional characteristics of all depth-dose profiles in this work from the MC and analytical calculations. All differences in the comparison are within 0.05 cm except for the fully modulated 2020 and 3030 beams.
Table 2.
Characteristics of the relative depth-dose profiles from simulations (MC), and broad-beam calculations (BB). Shown are the depths in water to the distal 90% dose level, R90; the difference in depth between the distal 90% and the proximal 90% dose levels, R90 – P90 (i.e. the modulation width); and the difference in depth between the distal 20% to the distal 80% dose levels, R80 – R20. The values originating from the analytical algorithm that did not meet our difference criterion of 0.5 mm are highlighted in bold.
| Beam |
R90
|
R90 – P90
|
R80 – R20
|
|||
|---|---|---|---|---|---|---|
| MC (mm) | BB (mm) | MC (mm) | BB (mm) | MC (mm) | BB (mm) | |
| 1500 | 15.5 | 15.5 | 4.4 | 4.4 | 3.8 | 3.8 |
| 2000 | 20.4 | 20.4 | 4.4 | 4.4 | 3.8 | 3.8 |
| 3000 | 30.5 | 30.5 | 4.4 | 4.4 | 3.8 | 3.8 |
| 4000 | 40.5 | 40.5 | 4.4 | 4.4 | 3.8 | 3.8 |
| 2011 | 18.7 | 18.7 | 11.0 | 10.8 | 4.1 | 4.1 |
| 2020 | 18.0 | 18.6 | 18.0 | 18.6 | 4.3 | 4.1 |
| 3015 | 28.6 | 28.5 | 14.4 | 14.3 | 4.2 | 4.2 |
| 3030 | 28.6 | 28.6 | 28.6 | 26.9 | 4.2 | 4.2 |
Adopted from Koch (2006).
3.1.2. Cross-field comparisons
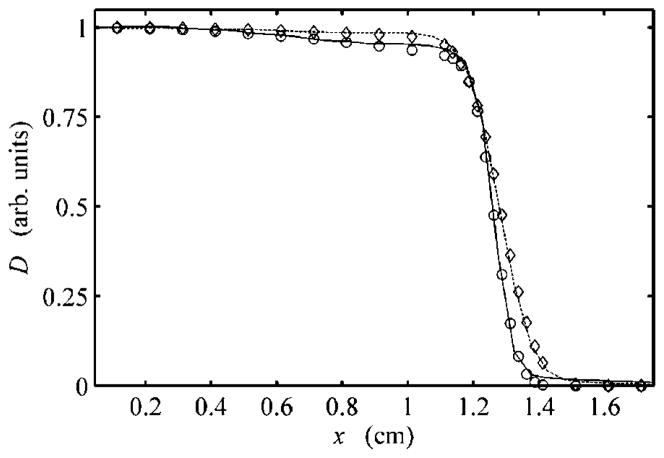
Comparison of the cross-field profiles calculated by the analytical algorithm showed excellent agreement with MC results at several depths for all beams in both the geometric expansion of the beam and the shape of the high-dose low-gradient regions. Figure 6 shows two cross-field profiles at depths of 0.5 cm and 2.4 cm for the 3015 beam. Each profile has been normalized to the central-axis dose to highlight the change in the flatness and penumbra with depth. Recall that the algorithm specifically attempts to model change in the flatness of the low-gradient regions as a function of off-axis distance and reduced range (see section 2.1.6). Table 3 shows the cross-field widths at several water-equivalent depths, d.
Figure 6.
Radial profiles perpendicular to the beam axis at a depth of 0.5 cm from MC (solid line) and EYEDOSE calculations (open circles) and at a depth of 2.4 cm from MC (dashed line) and EYEDOSE calculations (open diamonds). All data shown consider the 3015 beam and have been normalized to the dose (D) on the central axis versus the distance along the positive x-axis, perpendicular to the beam’s central axis. Note that the intensity of the cross-field profiles changes slightly with distance from the central axis and depth, an effect modeled by the analytical algorithm. Adopted from Koch (2006)
Table 3.
Cross-field widths spanning the profile at the 90% to 90% and 50% to 50% dose levels, as normalized to the central axis, from the simulations (MC) and broad-beam algorithm (BB) at several water-equivalent depths, d. Also shown are the 80% to 20% lateral penumbra widths. The measured field widths in boldface type differed from simulations and calculations by 0.5 mm or more.
| Beam | d (mm) | 90% to 90%
|
50% to 50%
|
Lateral 80% to 20%
|
|||
|---|---|---|---|---|---|---|---|
| MC (mm) | BB (mm) | MC (mm) | BB (mm) | MC (mm) | BB (mm) | ||
| 2011 | 8 | 23.6 | 23.6 | 25.3 | 25.3 | 1.1 | 1.0 |
| 14 | 23.5 | 23.6 | 25.4 | 25.5 | 1.2 | 1.2 | |
| 20 | 23.2 | 23.2 | 25.5 | 25.5 | 1.4 | 1.4 | |
| 2020 | 8 | 23.6 | 23.6 | 25.3 | 25.3 | 1.1 | 1.0 |
| 14 | 23.6 | 23.5 | 25.4 | 25.5 | 1.2 | 1.2 | |
| 20 | 23.3 | 23.2 | 25.5 | 25.5 | 1.4 | 1.4 | |
| 3015 | 8 | 23.7 | 23.4 | 25.3 | 25.3 | 1.0 | 1.1 |
| 14 | 23.7 | 23.6 | 25.4 | 25.5 | 1.1 | 1.2 | |
| 20 | 23.6 | 23.4 | 25.5 | 25.6 | 1.3 | 1.3 | |
| 26 | 23.1 | 23.1 | 25.6 | 25.7 | 1.6 | 1.6 | |
| 3030 | 8 | 23.6 | 23.5 | 25.3 | 25.3 | 1.0 | 1.1 |
| 14 | 23.6 | 23.6 | 25.4 | 25.5 | 1.1 | 1.2 | |
| 20 | 23.5 | 23.4 | 25.5 | 25.6 | 1.3 | 1.3 | |
| 26 | 23.1 | 23.1 | 25.6 | 25.7 | 1.6 | 1.6 | |
Adopted from Koch (2006).
3.1.3. Comparison of absolute D/MU values
Dose per monitor unit values in a water phantom was calculated both analytically and by MC (table 1). All D/MU values from EYEDOSE agreed with MC calculations to within 0.5% with one exception, the 2020 beam.
3.1.4. Two-dimensional gamma analysis
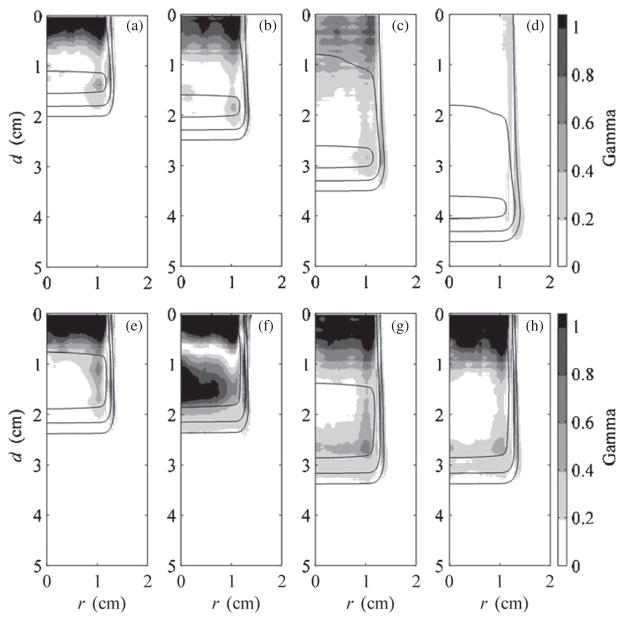
Gamma analysis using criteria of 3% dose and 0.05 cm was performed on corresponding data for each beam configuration listed in table 1, for both the flat-surfaced water phantom and eye model geometries (Low et al 1998). The criteria were chosen based on typical percentage difference tolerated in dose plane comparisons used for quality assurance and limitations imposed by the voxel dimensions in the MC and analytical calculations. Figure 7 shows results for all beams on the flat-surfaced water phantom and gives an overview of the agreement between EYEDOSE calculations and corresponding MC calculations. The shade of gray darkens as the gamma value increases. Locations within the beam where the criteria were not met resulted in gamma values exceeding 1 (shown as solid black). Overlaid onto the 2D gamma distributions in figure 7 are the 20%, 50%, and 90% isodose lines calculated by EYEDOSE. As observed in the central-axis depth-dose profiles above, EYEDOSE calculations tended to disagree with MC calculations in the proximal portion of the beam, more so as the beam range decreased or as the relative fluence weight of less-penetrating beams increased for an SOBP. The likely source for this disagreement is described in section 3.2 below.
Figure 7.
Results of 2D comparison of MC and EYEDOSE calculations, along the water-equivalent depth, d, and radial distance, r, using the gamma function with 3% and 0.05 cm criteria. These comparisons include the calculations performed on the flat-surfaced water phantom. Overlaid on each subpart are the 20% (outermost), 50% (middle) and 90% (innermost) isodose lines. All eight beams considered in this work are presented: (a) 1500, (b) 2000, (c) 3000, (d) 4000, (e) 2011, (f) 2020, (g) 3015, and (h) 3030 beams (see table 1). The MC data were adopted from Koch et al (2008).
3.2. Effect of edge-scattered protons
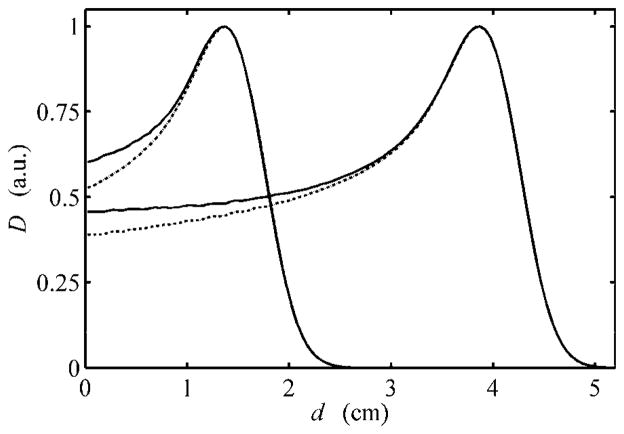
As illustrated in figures 4 and 7, the EYEDOSE algorithm underestimated the dose near the phantom surface. The observed differences increased with decreasing beam range, e.g. up to 5% for the 1500 beam. It was suspected that edge-scattered protons, largely ignored by this and other analytical algorithms, may have been the source of the observed difference. To investigate this possibility, we performed separate MC simulations identical to the previous simulations that produced the 1500 and 4000 data shown in figure 4 except that the brass collimating material that comprised the ocular nozzle model was given an importance equal to zero. This effectively terminated the history of any simulated proton that interacted with any collimating device, thus preventing protons from scattering downstream. The results of these simulations are shown in figure 8.
Figure 8.
Dose depth profiles of the 1500 and 4000 beams normalized to their respective peak dose (D) values versus water-equivalent depth (d). The MC data for the 1500 and 4000 beams shown in figure 4 are shown normalized to their peak dose values here (solid lines). Contrasted with these results are the corresponding depth profiles obtained when all proton histories that interact with any collimator component are terminated (dotted lines), with the key differences occurring in the proximal region of the Bragg peak. Adopted from Koch (2006)
As described in section 2.1.1, EYEDOSE calculated the dose as a function of the effective depth along the 4000 beam. This process led to a significant difference in the contribution to the scattered portion of the beam at shallow depths relative to deeper depths as calculated by MC. For example, as section 2.1.1 describes, the water-equivalent depth of 3.0 cm on the 4000 curve is equal to the effective depth, deff, of a point 0.5 cm deep along the 1500 curve shown in figure 4. In examining figure 8, which also shows the 1500 and 4000 beams, it can be observed that the non-scattered components of the 1500 and 4000 beams at 0.5 cm and 3.0 cm depths were similar and were equal to 61.5% and 62.8%, respectively. The relative contributions of edge-scattered protons at this effective depth in the 1500 and 4000 beams were 4.8% and 0.7%, respectively. Therefore, this example shows that the algorithm’s referencing of an effective depth equal to 3.0 cm in the calculation of the 1500 beam will neglect to account for almost 4.1% of the peak dose near the phantom surface.
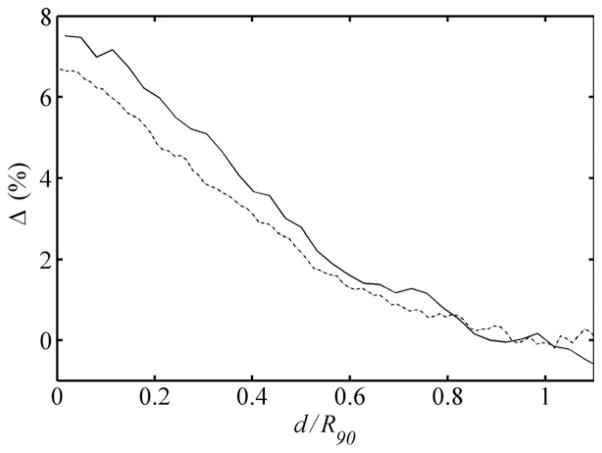
We explored a method by which future analytical algorithms may model the contribution of edge-scattered protons. Figure 9 shows the relative dose contributions of edge-scattered protons to the 1500 and 4000 beams plotted as a function of the reduced range. The similarity of the data demonstrates that the edge-scattered component can be easily separated from the rest of the beam for easy modeling to improve the algorithm’s dosimetric accuracy in the proximal region. Future analytical algorithms may reference open-beam depth-dose data that exclude edge-scattered protons. The important contribution of edge-scattered protons can easily be added as a separate component of the beam.
Figure 9.
Differences observed in the 1500 (solid line) and 4000 (dotted line) beams, in terms of percentage of the peak dose, for the corresponding profiles shown in figure 8 that were generated from the simulation conditions including and excluding protons scattered by the collimation system of the ocular nozzle. These differences are plotted versus the reduced range, i.e. the ratio of the water-equivalent depth (d) to the water-equivalent range of the beam to the distal 90% isodose level, R90. Adopted from Koch (2006)
3.3. Dose calculations and comparisons in an eye model
Figure 10 demonstrates EYEDOSE’s ability to calculate doses in a 3D customizable eye model described previously (Koch et al 2008); shown here are two SOBPs considered in the present work.
Figure 10.
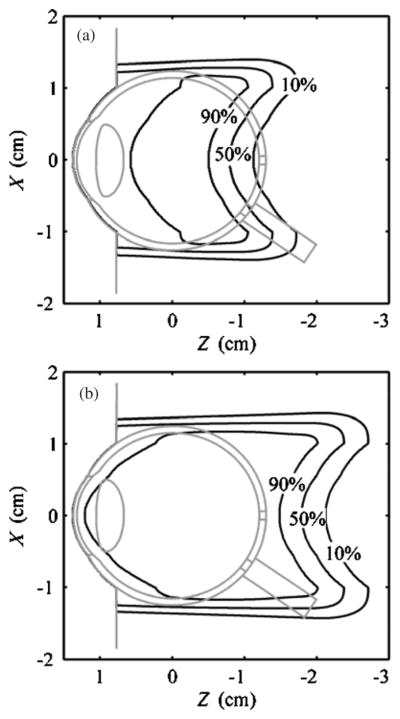
Analytical dose calculations in an eye model, which was originally described by Koch et al (2008), for the (a) 2011 and (b) 3030 beams in a 2D plane where x is perpendicular to the beam axis and z is in the parallel to the beam axis, as represented in the room coordinate system, i.e. isocenter was located at (0,0,0).
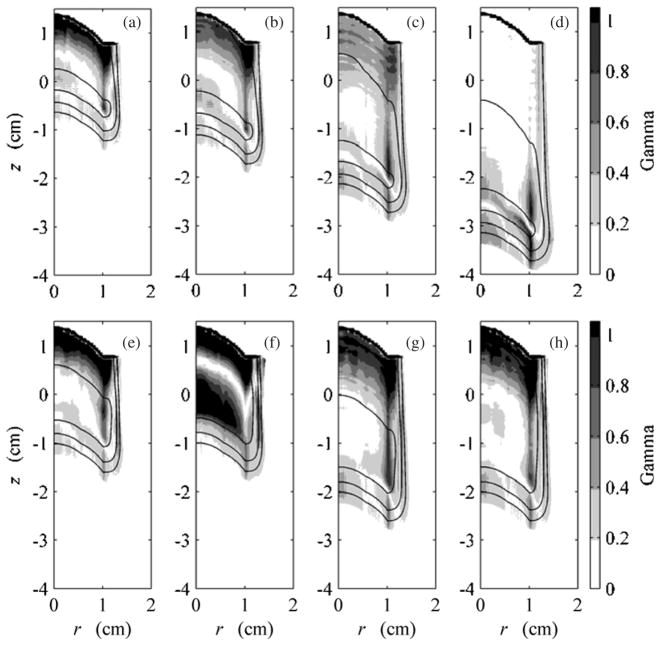
Similar to the comparisons made in figure 7 for the flat-surfaced water phantom geometry, figure 11 shows 2D comparisons of MC and EYEDOSE calculations of each beam on the eye model, the outline of which has been omitted for clarity. Again, the comparison is made by showing local gamma values calculated using a 3% dose difference and 0.05 cm distance criteria. The best agreement was observed for the open beam (d). As the range was decreased and range modulation increased, the agreement between EYEDOSE calculations and the MC calculations broke down at the most proximal surface for the reason described in section 3.2 above. In addition to this effect, the decreased agreement distal to the junction of the curved eye surface and the flat surface demonstrated the limitation of the broad-beam algorithm to precisely model side-scattered protons. This effect is most easily observed near the Bragg peak and surface, e.g. where side-scattered protons are present; here, the mean scattering angle increases sharply for low-energy protons.
Figure 11.
Results of 2D comparison of MC and analytical calculations using the gamma function with 3% and 0.5 mm criteria. These comparisons include calculations performed on the eye model rotated clockwise 90° as shown in figure 10. Overlaid on each sub-figure are the 20% (outermost), 50% (middle) and 90% (innermost) isodose lines. All eight beams considered in this work are presented: (a) 1500, (b) 2000, (c) 3000, (d) 4000, (e) 2011, (f) 2020, (g) 3015 and (h) 3030 (see table 1). The MC data were adopted from Koch et al (2008).
4. Discussion
In this work we developed an analytical algorithm to predict absolute dose distributions and demonstrated its accuracy by comparing its calculations to previously reported calculations from a benchmarked MC model of an ocular nozzle for proton therapy. We found that the predictions from the analytical algorithm agreed well with MC calculations. For depths greater than 0.7 cm the absorbed dose depth profiles agreed to within ±2% of the peak dose for three of the four SOBPs considered. Typically, analytical and MC-calculated D/MU values showed a maximum difference within 0.5% for pristine and range-modulated Bragg peaks.
Newhauser et al (2007) have previously demonstrated the use of Monte Carlo as a tool for evaluating the accuracy of a commercial pencil beam algorithm for proton therapy. Their work allowed the preliminary testing of a new commercial treatment planning system ahead of the acquisition of measured beam data, which was not possible due to the ongoing construction of the treatment facility. The Monte Carlo model used for these simulations was derived from detailed design drawings and specifications from the equipment vendor.
Others have reported on analytical algorithms for dose calculations in the eye. A pioneering analytical algorithm and its associated treatment planning system were first described by Goitein and Miller (1983) and have since became known as EYEPLAN. Since its introduction, others have contributed to the capabilities of the original planning system (Sheen 1994), but it is still limited to relative dose predictions and the accuracy of its dose predictions in the proximal region is limited by the simplicity of the algorithm (Koch and Newhauser 2005). Another treatment planning system for proton therapy of the eye, referred to as OCTOPUS, has been described by Pfieffer and Bendl (2001) and uses x-ray computed tomography (CT) images upon which to base its eye model. Both EYEPLAN and EYEDOSE currently base the eye model on a geometrical reconstruction on the eye using ophthalmological measurements that characterize the eye’s shape and tumor location, so a CT-based approach is unique. However, a detailed description of their algorithm and comparisons to Monte Carlo or measured data is still forthcoming.
The analytical absolute dose calculations reported here are the most accurate yet for ocular proton therapy. The broad-beam algorithm, which we have called EYEDOSE, is similar to previous broad-beam algorithms, most notably that reported by Hong et al (1996). However, EYEDOSE extends the capabilities of earlier approaches by including the modeling of a depth-dependent intensity profile as well as fluence weighting factors; these allow EYEDOSE to accurately predict absolute values of absorbed dose per monitor unit.
Monte Carlo is increasingly becoming more than an evaluation tool and is instead being developed to satisfy routine dose calculations in the clinic. Efforts toward this goal have been described by others demonstrate the potential for accurate dose calculations based on first principles of proton interactions with matter (Herault et al 2005, 2007, Koch et al 2008). To our knowledge, this technology has not yet been commercialized, though we expect that it will be and eventually replace analytical algorithms.
A key strength of this work is inherent in our comparison of analytical calculations to MC calculations. Since the MC model was previously benchmarked to measured data, using MC provided the ability for a more robust comparison than otherwise could have been afforded by measured data. For example, comparisons of depth-dose data could be made on a much finer scale and include depths proximal to 0.9 cm, for which measured data were unavailable due to the sidewall thickness of the water phantom (Koch et al 2008). This ability led to the discovery and demonstration of the important contributions of edge-scattered protons to dose in the proximal region and demonstrated an easy method for including these contributions in future analytical models. Last, our approach allowed for high-resolution comparisons of 2D analytical and MC calculations, which would have been limited to a lower resolution.
A limitation of this work is that calculations were only verified against measurements of a circular field collimated with a 2.4 cm diameter aperture. As was true for Hong et al (1996), we expect the reliability of the analytical algorithm to decrease for aperture sizes less than 1.0 cm. However, the typical field diameter used in ocular proton therapy is between 1.0 and 3.5 cm (Munzenrider 2001), suggesting that this limitation will be irrelevant in most instances. Lastly, while the eye is a relatively homogeneous structure, dose calculations in heterogeneous materials have not been evaluated.
The high importance of considering edge-scattered protons in analytical calculations was demonstrated by their significant effect on the level of agreement with Monte Carlo data observed in the proximal region of the target. This is in agreement with the findings of Titt et al (2008) who described the effects of collimator scattered protons on the D/MU and proximal doses at higher beam energies for large-field proton therapy. As discussed in this work, we believe this effect in ocular proton therapy can be fully modeled analytically to improve the accuracy of analytical calculations.
5. Conclusion
The results of this study demonstrated that it is possible to predict D/MU values accurately for clinically relevant range-modulated proton beams for ocular therapy using an analytical dose algorithm. Detailed absolute dose comparisons of 2D dose plans showed that the analytical model predicted the D/MU values within the stated criteria of 3% and 0.05 cm in most cases. These results strongly support the feasibility of accurately predicting absolute dose distributions in customizable patient geometry.
The MC method provided crucial data that emphasized the important role of edge-scattered protons in the accurate prediction of dose in the proximal region of pristine and spread-out Bragg peaks. Using this method, analytical algorithms may be rigorously tested and further enhanced by improved modeling of these effects that would be extremely difficult to measure.
Acknowledgments
This work was funded in part by Varian Medical Systems, The Sam Taub and Beatrice Burton Endowed Fellowship in Vision Disease, and Northern Illinois University through a subcontract of Department of Defense contract W81XWH-08-1-0205. We wish to thank Kathryn Carnes for her help in revising this manuscript.
Appendix
All configuration data for the EYEDOSE broad-beam algorithm were derived from Monte Carlo (MC) simulations of energy deposition in water or proton fluence tallies in air. The algorithm requires configuration data pertaining to the open beam and to the location of the nozzle components relative to the target, which includes the central-axis absolute depth-dose profile, DD(d), the effective source location and size, and the locations of the downstream ends of the variable degrader and aperture. In addition, a library of range modulator designs describing the thickness of each step and its relative fluence weight were available.
The central-axis depth-dose profile used for the DD(d) term in equation (5) was derived directly from MC calculations of the open beam’s absolute depth-dose profile as shown in figure 4.
The effective source of the open beam was also characterized from MC simulation. Its position served as the origin of the coordinate system within EYEDOSE. By locating the effective source, SSD the distance from the effective source to the water phantom surface was determined. In turn, SSD is used to calculate ωSAF via equations (8) and (9) and the inverse square correction in equation (10).
The effective source size was determined from a second simulation and included a half-beam block aperture, determined under the 4000 beam conditions, while tallying proton fluence in air with a rectilinear mesh tally. A least-squares fit of an error function to the proton fluence cross-field profile over a range of −0.5 cm < x < 0.5 cm adequately characterized the Gaussian width of the open beam, σopen, which was back-projected to the effective source location. Recall that σopen describes the inherent lateral spreading of the beam and is included in the calculation of the propagated source size in equation (14).
The locations of the beam-line components are important in modeling the penumbral width and the location of the field edge. The locations of the downstream faces of these components with respect to the open-beam effective source location were taken from the values used in the MC model.
The reader is referred to Hong et al (1996) for further details of these and other parameters.
References
- Egger E, Schalenbourg A, Zografos L, Bercher L, Boehringer T, Chamot L, Goitein G. Maximizing local tumor control and survival after proton beam radiotherapy of uveal melanoma. Int J Radiat Oncol Biol Phys. 2001;51:138–47. doi: 10.1016/s0360-3016(01)01560-7. [DOI] [PubMed] [Google Scholar]
- Goitein M, Miller T. Planning proton therapy of the eye. Med Phys. 1983;10:275–83. doi: 10.1118/1.595258. [DOI] [PubMed] [Google Scholar]
- Gottschalk B, Koehler A, Schneider R, Sisterson JM, Wagner M. Multiple Coulomb scattering of 160 MeV protons. Nucl Instrum Methods Phys Res. 1993;B74:467–90. [Google Scholar]
- Gragoudas ES, Marie Lane A. Uveal melanoma: proton beam irradiation. Ophthalmol Clin North Am. 2005;18:111–8. ix. doi: 10.1016/j.ohc.2004.08.002. [DOI] [PubMed] [Google Scholar]
- Herault J, Iborra N, Serrano B, Chauvel P. Monte Carlo simulation of a protontherapy platform devoted to ocular melanoma. Med Phys. 2005;32:910–9. doi: 10.1118/1.1871392. [DOI] [PubMed] [Google Scholar]
- Herault J, Iborra N, Serrano B, Chauvel P. Spread-out Bragg peak and monitor units calculation with the Monte Carlo Code MCNPX. Med Phys. 2007;34:680–8. doi: 10.1118/1.2431473. [DOI] [PubMed] [Google Scholar]
- Hogstrom KR, Mills MD, Meyer JA, Palta JR, Mellenberg DE, Meoz RT, Fields RS. Dosimetric evaluation of a pencil-beam algorithm for electrons employing a two-dimensional heterogeneity correction. Int J Radiat Oncol Biol Phys. 1984;10:561–9. doi: 10.1016/0360-3016(84)90036-1. [DOI] [PubMed] [Google Scholar]
- Hong L, Goitein M, Bucciolini M, Comiskey R, Gottschalk B, Rosenthal S, Serago C, Urie M. A pencil beam algorithm for proton dose calculations. Phys Med Biol. 1996;41:1305–30. doi: 10.1088/0031-9155/41/8/005. [DOI] [PubMed] [Google Scholar]
- Koch N. PhD Thesis. The University of Texas Health Science Center at Houston and The University of Texas M D Anderson Cancer Center; Houston, TX: 2006. Monte Carlo and analytical dose calculations for ocular proton therapy. [Google Scholar]
- Koch N, Giebeler A, Newhauser W. Customer evaluation testing: report for the protoneye treatment planning software. M D Anderson Cancer Center; Houston, TX: 2006. MDACC-10-0029. [Google Scholar]
- Koch N, Newhauser W. Virtual commissioning of a treatment planning system for proton therapy of ocular cancers. Radiat Prot Dosim. 2005;115:159–63. doi: 10.1093/rpd/nci224. [DOI] [PubMed] [Google Scholar]
- Koch N, Newhauser WD, Titt U, Gombos D, Coombes K, Starkschall G. Monte Carlo calculations and measurements of absorbed dose per monitor unit for the treatment of uveal melanoma with proton therapy. Phys Med Biol. 2008;53:1581–94. doi: 10.1088/0031-9155/53/6/005. [DOI] [PMC free article] [PubMed] [Google Scholar]
- Kooy HM, Schaefer M, Rosenthal S, Bortfeld T. Monitor unit calculations for range-modulated spread-out Bragg peak fields. Phys Med Biol. 2003;48:2797–808. doi: 10.1088/0031-9155/48/17/305. [DOI] [PubMed] [Google Scholar]
- Low DA, Harms WB, Mutic S, Purdy JA. A technique for the quantitative evaluation of dose distributions. Med Phys. 1998;25:656–61. doi: 10.1118/1.598248. [DOI] [PubMed] [Google Scholar]
- Munzenrider JE. Uveal melanomas. Conservation treatment. Hematol Oncol Clin North Am. 2001;15:389–402. doi: 10.1016/s0889-8588(05)70219-7. [DOI] [PubMed] [Google Scholar]
- Newhauser W, Fontenot JD, Zheng Y, Polf JC, Titt U, Koch N, Zhang X, Mohan R. Monte Carlo simulations for configuring and testing an analytical treatment planning system. Phys Med Biol. 2007;52:4569–84. doi: 10.1088/0031-9155/52/15/014. [DOI] [PubMed] [Google Scholar]
- Newhauser W, Koch N, Hummel S, Ziegler M, Titt U. Monte Carlo simulations of a nozzle for the treatment of ocular tumours with high-energy proton beams. Phys Med Biol. 2005;50:5229–49. doi: 10.1088/0031-9155/50/22/002. [DOI] [PubMed] [Google Scholar]
- Newhauser W, Titt U, Dexheimer D, Yan X, Nill S. Neutron shielding verification measurements and simulations for a 235-MeV proton therapy center. Nucl Instrum Methods Phys Res. 2002a;476:80–4. [Google Scholar]
- Newhauser WD, Burns J, Smith AR. Dosimetry for ocular proton beam therapy at the Harvard Cyclotron Laboratory based on the ICRU Report 59. Med Phys. 2002b;29:1953–61. doi: 10.1118/1.1487425. [DOI] [PubMed] [Google Scholar]
- Newhauser WD, Myers KD, Rosenthal SJ, Smith AR. Proton beam dosimetry for radiosurgery: implementation of the ICRU Report 59 at the Harvard Cyclotron Laboratory. Phys Med Biol. 2002c;47:1369–89. doi: 10.1088/0031-9155/47/8/310. [DOI] [PubMed] [Google Scholar]
- Pfeiffer K, Bendl R. Real-time dose calculation and visualization for the proton therapy of ocular tumours. Phys Med Biol. 2001;46:671–86. doi: 10.1088/0031-9155/46/3/304. [DOI] [PubMed] [Google Scholar]
- Rethfeldt C, Fuchs H, Gardey KU. Dose distributions of a proton beam for eye tumor therapy: hybrid pencil-beam ray-tracing calculations. Med Phys. 2006;33:782–91. doi: 10.1118/1.2168067. [DOI] [PubMed] [Google Scholar]
- Sheen M. Development of the EYE proton therapy planning program. XX PTCOG Meeting; Chester, England. 1994. p. 29. [Google Scholar]
- Sheen M. EYEPLAN software user’s manual. 2003. [Google Scholar]
- Titt U, Zheng Y, Vassiliev ON, Newhauser WD. Monte Carlo investigation of collimator scatter of proton-therapy beams produced using the passive scattering method. Phys Med Biol. 2008;53:487–504. doi: 10.1088/0031-9155/53/2/014. [DOI] [PubMed] [Google Scholar]
- Zhang R, Newhauser WD. Calculation of water equivalent thickness of materials of arbitrary density, elemental composition and thickness in proton beam irradiation. Phys Med Biol. 2009;54:1383–95. doi: 10.1088/0031-9155/54/6/001. [DOI] [PMC free article] [PubMed] [Google Scholar]


