

Abstract
Nonviral gene delivery holds great promise not just as a safer alternative to viral vectors in traditional gene therapy applications, but also for regenerative medicine, induction of pluripotency in somatic cells, and RNA interference for gene silencing. Although it continues to be an active area of research, there remain many challenges to the rational design of vectors. Among these, the inability to characterize the composition of nanoparticles and its distribution has made it difficult to probe the mechanism of gene transfection process, since differences in the nanoparticle-mediated transfection exist even when the same vector is used. There is a lack of sensitive methods that allow for full characterization of DNA content in single nanoparticles and its distribution among particles in the same preparation. Here we report a novel spectroscopic approach that is capable of interrogating nanoparticles on a particle-by-particle basis. Using PEI/DNA and PEI-g-PEG/DNA nanoparticles as examples, we have shown that the distribution of DNA content among these nanoparticles was relatively narrow, with the average numbers of DNA of 4.8 and 6.7 per particle, respectively, in PEI/DNA and PEI-g-PEG/DNA nanoparticles. This analysis enables a more accurate description of DNA content in polycation/DNA nanoparticles. It paves the way toward comparative assessments of various types of gene carriers and provides insights into bridging the efficiency gap between viral and nonviral vehicles.
Keywords: Microfluidics, single molecule detection, fluorescence spectroscopy, polyplex, nanoparticle
The use of polymeric carriers to condense and deliver gene therapeutics has been an area of active research in the past two decades due to the wide range of potential applications.1−4 Despite significant work on screening various polymer structure, examining cell transfection efficiency and trafficking kinetics, and assessing their efficiency in various animal and disease models, the delivery efficiency of polymeric carriers is typically much lower when compare with viral vectors.5−8 The severe lack of characterization of DNA nanoparticle composition and structure has significantly hampered the development of engineering approaches to control composition and structure and limited the progress in quantitative description of various steps in nanoparticle trafficking and delivery efficiency.5,7
Several recent reports have highlighted the importance not just of the total DNA dose, but also the way in which the DNA is distributed among polyplex particles in gene transfection and delivery efficiency.6,9,10 For example, coencapsulation of noncoding DNA with plasmids containing reporter genes appeared to reduce the reporter DNA dose necessary to achieve comparable transgene expression, presumably due to the increase in the number of reporter-containing particles.6 These results argue for techniques that can determine and control the DNA content in nanoparticles, which, coupled with an understanding of the probabilistic nature of the endocytic pathway, can lead to an optimized delivery strategy.11 These studies also suggest that polyplex characterization based on size and surface charge measurements and DNA binding affinity is not sufficient.12−15 The composition of the particles have only been determined at the population level by comparing the average DNA and particle volumes16,17 or the average DNA and particle concentrations,18,19 neither of which can provide much information about the distribution of DNA within a nanoparticle population.
We have previously developed a single molecule detection (SMD) method and employed it for the analysis of DNA nanoparticle composition.20 Using a laser confocal spot focused inside a microfluidics channel, we detected nanoparticles containing fluorescently labeled DNA in situ. After disrupting the nanoparticles and releasing the fluorescent DNA, the DNA content of the particles can be estimated by comparing the number of fluorescent events before and after disruption. Since this is a direct measurement of the sample, it is an improvement over methods that require theoretical estimates, e.g., of DNA volumes. It is also capable of higher throughput than particle tracking methods, since thousands of particles can be counted in minutes.18,20 However, since the number of fluorescent events is essentially a measure of the particle or DNA concentration, like previous methods it can only yield an average DNA content for each preparation. Furthermore, the rapid decay of the detection volume away from its center means the choice of the threshold level can greatly affect the number of events counted. This decay also results in highly variable fluorescence intensities that depend on the portion of the detection volume through which each particle passes, thereby obscuring most DNA content information in the fluorescence data. In addition, because the detection volume is much smaller than the size of the channel, only around 1% of all the particles that are introduced into the channel are detected, resulting in a higher level of sampling errors.
Here we report a novel single particle analysis method for direct interrogation of the composition distribution of DNA nanoparticles. This method utilizes our recently developed SMD method, known as cylindrical illumination confocal spectroscopy (CICS),21 to achieve high detection uniformity and mass detection efficiency. We developed an analysis algorithm that decomposes the particle fluorescence distribution into linear combinations of basis distributions, generated from the distribution of fluorescence intensity of the constituent labeled DNA. Using this approach, we can determine, with high throughput, the distribution of DNA content of a polyplex nanoparticle preparation through a direct interrogation of individual particles.
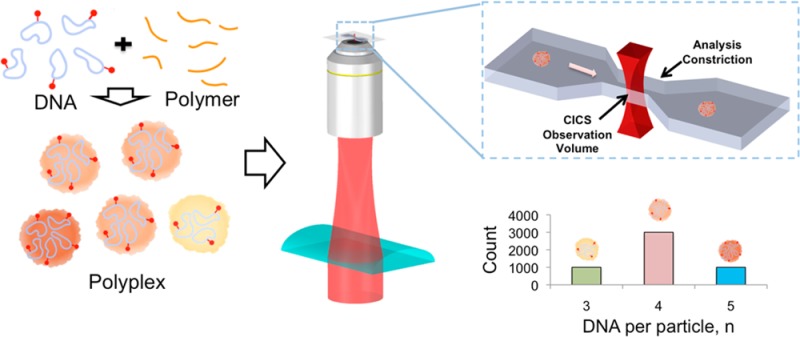
To prepare the samples used in the experiments, polymer and Cy5-labeled plasmid DNA are mixed according to reported protocols (Scheme 1a). The number of Cy5-labels per plasmid DNA was controlled to be less than 10 so that the nanoparticle complexation was not influenced, as determined by examining the nanoparticle size and surface charge. The particles are then injected into a microfluidic chip mounted on the CICS setup.21,22 In CICS, a laser beam is first expanded using beam-shaping optics, then focused along one dimension using a cylindrical lens (Scheme 1b). The beam is then tightly focused into a light sheet in a microfluidic channel using a microscope objective (Scheme 1c). As particles pass through the channel, the light sheet, which occupies the entire cross-section of the microfluidic channel, excites them, and the emitted photons are collected by the objective, thus achieving 100% detection of the particles. Using a confocal aperture, out-of-focus light is spatially filtered before the photons are detected by the avalanche photodiodes, reporting the fluorescence on a particle-by-particle basis (Scheme 1d). The aperture also restricts the detection volume to the more uniform central region, yielding variation of less than 5% for sufficiently bright fluorescent species.22 The process is then repeated for the labeled DNA molecules.
Scheme 1. Schematic Representation of the Data Acquisition Steps (a–d) and Particle Analysis Steps (e–g).

(a) Polycation carriers (orange) and DNA plasmids (blue) labeled with Cy5 (red) are mixed in 20 mM pH5.5 sodium acetate buffer to form polyplexes. (b) The polyplexes are then introduced into a microfluidic device on a CICS detection set-up. (c). Each fluorescent particle or molecule passes through the uniform CICS observation volume and registers as a fluorescence peak. (d) The distribution of fluorescence in each sample is then plotted and fitted to a lognormal profile. (e) In order to determine the abundance of the different subpopulations in each particle preparation, the aggregated signal is deconvolved into its constituent parts using a particle analysis approach. To illustrate this, a set of normalized basis distributions is first generated from a simulated DNA histogram as described in the main text. For the sake of clarity, only DNA per particle n = 3, 4, and 5 are shown. (f) Consider a sample comprising particles with 3, 4, and 5 DNA molecules. Assuming that the total particle count, N, is 5000, we can start with an initial estimate of the weights a3 = 1000, a4 = 3000, and a5 = 1000. (g) We can calculate the contribution to the final sample fluorescence of each sub-population by multiplying the probability density with the corresponding number of particles, the sum of which will be the predicted sample fluorescence distribution, D*particle (dashed lines). The difference between the prediction and the experimental particle fluorescence distribution is then minimized by modifying the relative abundance of each sub-population, thus arriving at the final estimate.
From the histograms of the fluorescence, we found that in each case it was best fitted to an asymmetric log-normal function rather than the more common, symmetric Gaussian distribution (Figure S1 of the Supporting Information). We can interpret this by noting that the factors that contribute to fluorescence intensity of each event—including the number of DNA molecules in each particle; number of fluorophores on each DNA molecule; the excitation laser power; the Poissonian variability in the photoemission and detection processes; focal plane and velocity fluctuations during measurement, etc.—multiply with each other, compounding the errors in each step and giving rise to so-called multiplicative processes.23−25 Although the mean particle fluorescence intensity is still instructive in estimating the DNA content, the resulting variability makes it impossible to determine the composition in each particle. However, apart from the number of DNA detected during each event, these factors affect both DNA and nanoparticle fluorescence identically.22 It is thus possible to deconvolve the particle fluorescence based on DNA fluorescence profile, yielding information about the distribution of DNA content.
This was achieved by adapting a data-fitting strategy first described by Mutch et al. for counting the number of fluorophores in fluorescent puncta in a total internal reflection fluorescence (TIRF) microscopy image.23,24 To illustrate the method, a simulated result is shown in Scheme 1e–g, while experimental data fitted using our approach are shown in Figure S1b. First, a set of C normalized basis distributions, {DDNA,c}c=1...C, is generated from the DNA histogram as described in Section S2, where DDNA,c represents the normalized histogram of a set of perfectly monodisperse particles, each containing exactly c DNA molecules (Scheme 1e). Using the notation DDNA,c(i) to represent the proportion of each distribution in the i-th bin, we get
for all c values, where LB is the total number of bins for a particular distribution. We have elected to use logarithmic binning to minimize the number of empty bins while still maintaining a large dynamic range. Three sets of bins are used in each fit (B = 3 and LB=1...3 of 50, 55, and 60) to minimize artifacts that may arise from bin edges. By assigning weights, ac to each basis distribution (Scheme 1f), we can deconvolve the particle distribution, Dparticle, into a linear combination of the weighted basis distributions,
where the asterisk represents the fitted estimate (Scheme 1g). Using yi to represent the number of particles in the i-th bin,
and
where N* is the estimated total number of particles. Similar to the method developed by Mutch et al.,24 we used the difference between the actual data and estimate to construct an optimization parameter,
The first term, 1/[(∑B=l3LB) – C], is used to account for the degrees of freedom in the fitting algorithm. The value of α is the penalty imposed when the number of events in the fitted data (N*) deviates from the actual sample (N) and is chosen to be 0.1 to keep N* within 1% of N. It is worth noting that, although this analysis can theoretically be performed on a traditional SMD, the rapid decay of the signal toward the edges of the detection volume as well as the low mass detection efficiency (<1%) will require an inordinate amount of data collection time to obtain sufficiently large numbers of peaks to be representative of the sample in analysis.
Model System: Streptavidin Binding to Biotinylated Single-Stranded DNA (ssDNA)
To validate the applicability of the algorithm to CICS, we developed a model system using streptavidin and biotinylated ssDNA labeled with Cy5 (Figure 1a). This system is chosen because the number of occupancy states is well-defined (n = 1–4), and they can be resolved by gel electrophoresis, similar to a previously reported method.26 Around 4500 peaks are collected for each sample for data processing. For the sample with a DNA/streptavidin molar ratio of 10 (2.5 times as many biotinylated molecules as binding sites), we showed that the majority of streptavidin molecules had two (29.4%) or three (67.9%) bound Cy5-labeled biotinylated DNA (Figure 1d). These numbers are comparable to the estimates derived from gel electrophoresis image (24.9% and 67.5%, respectively, Figure 1b,d), taking into account the loss of fluorescent labels on 5% of the DNA molecules due to DNA/dye linker hydrolysis or otherwise incomplete labeling during synthesis. Details of the analysis of the gel image are available in Section S3.
Figure 1.

Model steptavidin/biotinylated ssDNA system. (a) Cy5-labeled ssDNA molecules are incubated with streptavidin at different ratios to form conjugates with a maximum occupancy, N, of 4. (b) Agarose gel image of streptavidin incubated with varying amounts of ssDNA. Lanes are labeled with the molar ratio of DNA to binding sites on streptavidin. Band positions correspond to occupancy states of 1–4 and free DNA, in that order, since the charge increases with occupancy. (c) The sample with 10-fold excess DNA was tested on CICS, and the results show that the fitted result (stacked area plot) approximated the experimental distribution (bars) closely. (d) The estimated abundance of the various occupancy states (white) was very similar to the gel results (black). The absence of occupancy states higher than 4 further affirms the validity of the algorithm.
The very small percentage of streptavidin molecules with four bound ligands (0.6%) is consistent with reported values and can be attributed to the steric hindrance and electrostatic repulsion caused by bound DNA molecules.27 The average number of bound DNA molecules calculated from our CICS analysis is 2.7, which agreed well with the average of 2.9 estimated from the electrophoresis results. Since streptavidin is a tetrameric protein, the maximum occupancy state is four, and the proportion of peaks in Dparticles that correspond to occupancy states higher than four is thus termed the nonphysical parameter (i.e., physically impossible states). Importantly, the nonphysical parameter for our fitted CICS analysis data is zero (Figure 1d), further strengthening our confidence in the fitted distribution.
Distribution of DNA Content in Polyethylenimine (PEI)/DNA and Polyethylenimine-g-Polyethylene Glycol (PEI-g-PEG)/DNA Nanoparticles
Because nanoparticles used in gene delivery typically involve electrostatic interactions between the polycation and the DNA molecules, the charge on these particles no longer has a well-defined correlation with DNA content. In fact, the absence of migration on agarose gels is often used as an indication of polyplex stability.15 Therefore, gel electrophoresis cannot be used to determine the DNA content in these particles. On the other hand, our method is well-suited to testing the DNA content of nanoparticles. We chose to test the PEI/plasmid DNA system, widely considered as the gold standard for nonviral gene delivery.8,28 Despite its well-reported limitations, this system is often used as a positive control against which new materials or methods of preparation are compared. Consequently, an appreciation of the behavior and properties of this system is an important starting point for understanding polyplex gene delivery systems.
Compaction of Cy5-labeled DNA by the polymeric carriers can result in extremely close proximity between dye molecules, which is known to cause significant, and sometimes complete, self-quenching of the dye at high dye labeling densities, with obvious ramifications for our analysis.29−33 Therefore, controlling the DNA labeling density not only keeps the complexation process from being affected by the dye molecules (Figure S2b) but also serves to prevent fluorescence quenching (Figure S2). To verify the absence of any quenching, labeled and unlabeled DNA were used in varying proportions (20–100% labeled DNA) to prepare 5 sets of particles. We determined that the average fluorescence increased linearly with the proportion of labeled DNA at a labeling density of 7.5 dyes per DNA (R2 = 0.942), proving that fluorescence quenching is not a significant issue (Figure 2a).
Figure 2.
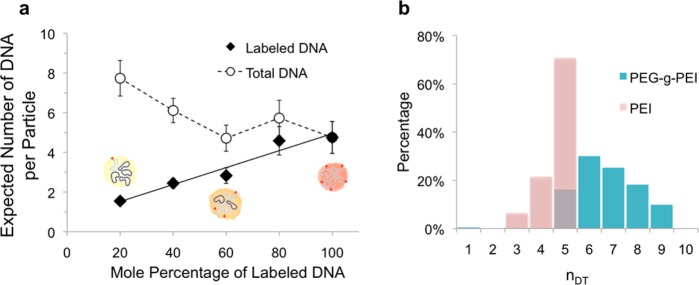
Estimation of DNA content in polyplex preparations. (a) The expected labeled DNA per particle (filled symbols) increased linearly with the proportion of labeled DNA (R2 = 0.942), indicative of absence of any quenching effect as a result of the low volume density of dyes (cartoons inset). When the unlabeled DNA is accounted for, the total DNA content of the particles is estimated to be around 5 (open symbols). At lower proportion of labeled DNA (20% and 40%), a significant portion of particles will contain no labeled DNA according to a binomial distribution, thereby skewing the estimates higher as discussed in the main text. (b) Using our method, we determined that the DNA content of PEI (pink) and PEI-g-PEG (teal) polyplexes contained an average of around 4.8 and 6.7 DNA molecules, respectively, with fairly narrow distribution of DNA content.
The distribution of DNA content in each preparation was then determined using free Cy5-labeled DNA as a control, with at least 2,500 fluorescent events for each sample for the fitting process. Freshly prepared PEI/DNA nanoparticles were found to contain an average of 4.8 DNA molecules (Figure 2). The variation of DNA content in the preparation was remarkably low, with 95% containing either 4 or 5 DNA molecules (Figure 2b), instead of a Poisson distribution, suggesting that the process of DNA incorporation is not merely a random statistical process. By accounting for the proportion of labeled DNA, the total plasmid content nDT for samples prepared with a mixture of labeled and unlabeled plasmids can be obtained using
where Plabeled is the proportion of labeled DNA.
Assuming that the labeling density does not affect incorporation selectivity with the label density tested here, the DNA content in all cases should be fairly similar, which was found to be generally true (Figure 2a). Furthermore, if our estimates of single-digit DNA content were correct, we would expect to see a significant portion of nanoparticles without labeled DNA in the sample with 20% labeled DNA as the discrete nature of the DNA content becomes apparent. To illustrate this, consider the number of labeled DNA per particle, nDL, which follows a binomial distribution, where
where j represents the subpopulation with j DNA per particle. The proportion of unlabeled particles can then be calculated as
where Pj is the proportion of a preparation that has total of j DNA molecules per particle, and P(nDL,j = 0) is the proportion of particles with j total DNA molecules with only unlabeled DNA. Using Pj from the sample prepared with only labeled DNA (Figure 2b), we found that the proportion of unlabeled particles was around 36%. Since these nonfluorescent particles are not accounted for when calculating the mean DNA content, the average DNA content is overestimated by a factor of 56%. Taking this into consideration, a sample with an actual DNA content of 4.8 DNA molecules per particle will theoretically yield an estimate of 7.4 DNA molecules when prepared with 20% labeled DNA, very close to our fitted average of 7.7 DNA molecules per particle (Figure 2a).
Performing the same experiment using a second polymer system, namely that of PEI-g-PEG, we were able to determine that these particles contained a similar amount of DNA (6.7 DNA per nanoparticle, Figure 2b). Because of the similarities in the cationic portion of the polymer, this result does not come as a surprise. Interestingly, unlike PEI/DNA nanoparticles, which aggregate quickly on standing, we have found that the PEI-g-PEG/DNA nanoparticles are very stable in solution, with little change to the fluorescence distribution even after 1 week of storage at 4 °C in aqueous buffer. This analysis offers an additional measure for nanoparticle stability besides particle size and surface charge.34
While the DNA distribution of the PEI/DNA and PEI-g-PEG/DNA nanoparticle preparations reported here were generally unimodal, this analysis approach is also applicable to other types of distributions. Such bi- or multimodal preparations may result from particle aggregation or multiple metastable particle configurations, where the average DNA content can be meaningless when trying to compare the efficacies, since it is unclear which subpopulation is the primary contributor to the transfection outcome.35 Because it is as yet not possible to prepare such samples with a high degree of control over DNA content in nanoparticles, we instead prepared PEI/DNA particles using 20% and 100% labeled DNA and mixed the particles at a 4:1 ratio to simulate a bimodal sample (total number of particles, N = 4237). We also prepared separate preparations of 20% and 100% labeled DNA particles (N = 3173 and 751, respectively) and tested all three samples using our method (Figure 3). As expected, we were able to detect the two subpopulations in the 20%/100% mixture (Figure 3a), which is similar to the sum of the separate 20% and 100% distributions (Figure 3b).
Figure 3.
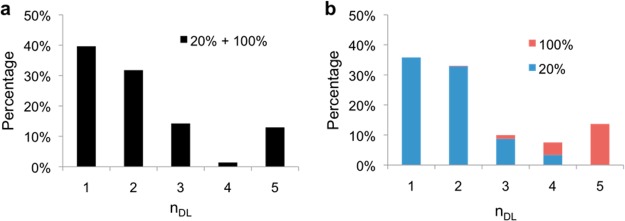
Identification of subpopulations in simulated bimodal distribution. (a) Particles formed using 20% and 100% labeled DNA were prepared and mixed at a ratio of 4:1 to simulate a bimodal distribution (N = 4237). Using our method, we were able to identify the two subpopulations in the particle mixture (nDL = 1–3 and 5, respectively). (b) By performing the same analysis on separate preparations of particles with 20% (blue bars) and 100% (red bars) labeled DNA and recombining the results (N = 3173 and 751, respectively), we obtained a similar distribution. The differences are attributed to batch-to-batch variation.
The ability of the method to distinguish between the two subpopulations further confirms its robustness and the veracity of our estimates. The differences that exist are attributed to sample-to-sample variation typical of these bulk preparation methods and highlight the persistent variations between even ostensibly identical preparations.36 They may in turn point to conditions for which we are not adequately controlling during preparation. By providing a method to quantify the heterogeneity of the polyplex preparations, we will be able to help identify these parameters and improve existing protocols.
The need for well-characterized vector systems has long been recognized in the field of nonviral gene delivery.37 Unlike other structural and physicochemical parameters, the supramolecular organization of the DNA/polymer complexes has rarely been studied. There have been several reports describing the composition of the nanoparticles, with the average DNA content ranging from less than 10 to more than 100 per particle. Despite this apparent variation, the number of DNA molecules normalized by particle volume in each case is in fact relatively close, within 1 order of magnitude of our estimate.17,18,20 This result is quite remarkable, given the variety of vectors and measurement methods used. Since all of these studies use plasmid DNA of similar sizes, this suggests that the condensation process may be primarily controlled by plasmid DNA, the much larger component in the complex.
An interesting demonstration of the effect of DNA content distribution was reported by van Gaal et al. using a mixture of reporter plasmid and nonsense plasmid to complex with PEI.6 The dilution of reporter plasmid by 16-fold with nonsense DNA only reduced the total fraction of transfected cells by ∼70%, whereas diluting reporter plasmid-containing polyplexes with nonsense DNA-containing polyplexes to the same ratio reduced transfection by around 15-fold. In addition, the coincorporation of nonsense DNA into polyplexes did not appear to significantly affect the transgene expression level for reporter-positive cells, suggesting that the presence of small numbers of reporter gene plasmids in each particle is sufficient to achieve the desired level of transfection. Dilution with nonsense DNA prior to particle formation then helps to increase the total number of reporter-containing polyplexes compared with dilution after particle formation with nonsense DNA-containing particles and hence increases the total transfection. Interestingly, if we assume that 5–6 DNA molecules were in each particle for their preparations, a 16-fold dilution of the plasmid corresponds neatly to around 70% of polyplexes containing only nonsense DNA, a number that agrees well with their findings. Other groups have also reported similar observations.9,10 These studies highlight the limitations of our current state of understanding of a complex process and the need for a more quantitative and detailed analysis of nanoparticle compositions. By enabling rapid DNA content distribution, our method will be an invaluable tool to accomplish this.
The method can be easily extended to determine the content of nanoparticles of various compositions. Simultaneous detection of polymer and DNA content will provide us with the complete assessment of nanocomplex composition and its distribution. Furthermore, in addition to typical gene delivery applications, with others such as induction of pluripotency in somatic cells and combination gene therapy, there is a clear need to codeliver multiple genes into the same cell for effective reprogramming applications.4,38−40 Since it can be difficult to achieve precise dosing of genes in target cells using different particles, it might be best to prepackage genes in single particle populations at the appropriate ratios prior to transfection. To that end, using our method to determine the gene content in the delivery vehicles can improve the vector preparation by allowing fine-tuning of DNA incorporation strategies.
In summary, this study fills an urgently needed technical gap for determining DNA content distribution in nanoparticle formulation, which is crucial to evaluating gene delivery efficiency. By rapidly interrogating thousands of fluorescent events in just a few minutes, we have been able to extract the DNA content distribution information from nanoparticle preparations. The present data shows that the DNA content of the PEI/DNA and PEI-g-PEG/DNA nanoparticles is fairly low, with less than 10 plasmids per particle. Furthermore, the non-Poissonian nature of the DNA content distribution suggests that DNA incorporation is not a random event, but driven perhaps in part by the plasmid DNA morphology. Further studies about the effect of DNA content on transfection efficiency will demonstrate the value of this information to vector design.
Acknowledgments
The authors would also like to thank funding source from National Institutes of Health (R01CA155305, U54CA151838, R21CA173390, and R21EB013274), and the Agency for Science, Technology and Research (A*STAR) Singapore.
Supporting Information Available
Materials and methods, further details of data fitting methodology, gel analysis for streptavidin/biotin experiments, DNA labeling density optimization, and discussion of fluorescence quenching processes. This material is available free of charge via the Internet at http://pubs.acs.org.
The authors declare no competing financial interest.
Funding Statement
National Institutes of Health, United States
Supplementary Material
References
- Sheyn D.; Mizrahi O.; Benjamin S.; Gazit Z.; Pelled G.; Gazit D. Adv. Drug Delivery Rev. 2010, 62, 683–698. [DOI] [PubMed] [Google Scholar]
- Beh C. W.; Seow W. Y.; Wang Y.; Zhang Y.; Ong Z. Y.; Ee P. L. R.; Yang Y.-Y. Biomacromolecules 2008, 10, 41–48. [DOI] [PubMed] [Google Scholar]
- Whitehead K. A.; Langer R.; Anderson D. G. Nat. Rev. Drug Discovery 2009, 8, 129–138. [DOI] [PMC free article] [PubMed] [Google Scholar]
- Yusa K.; Rad R.; Takeda J.; Bradley A. Nat. Methods 2009, 6, 363–369. [DOI] [PMC free article] [PubMed] [Google Scholar]
- Varga C. M.; Tedford N. C.; Thomas M.; Klibanov A. M.; Griffith L. G.; Lauffenburger D. A. Gene Ther. 2005, 12, 1023–1032. [DOI] [PubMed] [Google Scholar]
- van Gaal E. V. B.; Oosting R. S.; Hennink W. E.; Crommelin D. J. A.; Mastrobattista E. Int. J. Pharm. 2010, 390, 76–83. [DOI] [PubMed] [Google Scholar]
- Hama S.; Akita H.; Ito R.; Mizuguchi H.; Hayakawa T.; Harashima H. Mol. Ther. 2006, 13, 786–794. [DOI] [PubMed] [Google Scholar]
- Putnam D. Nat. Mater. 2006, 5, 439–451. [DOI] [PubMed] [Google Scholar]
- Symens N.; Rejman J.; Lucas B.; Demeester J.; De Smedt S. C.; Remaut K. Mol. Pharmacol. 2013, 10, 1070–1079. [DOI] [PubMed] [Google Scholar]
- Rajendra Y.; Kiseljak D.; Manoli S.; Baldi L.; Hacker D. L.; Wurm F. M. Biotechnol. Bioeng. 2012, 109, 2271–2278. [DOI] [PubMed] [Google Scholar]
- Adler A. F.; Leong K. W. Nano Today 2010, 5, 553–569. [DOI] [PMC free article] [PubMed] [Google Scholar]
- Majewski A. P.; Stahlschmidt U.; Jérôme V.; Freitag R.; Müller A. H. E.; Schmalz H. Biomacromolecules 2013, 14, 3081–3090. [DOI] [PubMed] [Google Scholar]
- Miyata K.; Nishiyama N.; Kataoka K. Chem. Soc. Rev. 2012, 41, 2562–2574. [DOI] [PubMed] [Google Scholar]
- De Smedt S. C.; Demeester J.; Hennink W. E. Pharm. Res. 2000, 17, 113–126. [DOI] [PubMed] [Google Scholar]
- Gillard M.; Jia Z.; Gray P. P.; Munro T. P.; Monteiro M. J. Polym. Chem. 2014, 5, 3372–3378. [Google Scholar]
- Pitard B.; Aguerre O.; Airiau M.; Lachagès A.-M.; Boukhnikachvili T.; Byk G.; Dubertret C.; Herviou C.; Scherman D.; Mayaux J.-F.; Crouzet J. Proc. Natl. Acad. Sci. U.S.A. 1997, 94, 14412–14417. [DOI] [PMC free article] [PubMed] [Google Scholar]
- Kreiss P.; Mailhe P.; Scherman D.; Pitard B.; Cameron B.; Rangara R.; Aguerre-Charriol O.; Airiau M.; Crouzet J. Nucleic Acids Res. 1999, 27, 3792–3798. [DOI] [PMC free article] [PubMed] [Google Scholar]
- Bhise N. S.; Shmueli R. B.; Gonzalez J.; Green J. J. Small 2012, 8, 367–373. [DOI] [PMC free article] [PubMed] [Google Scholar]
- Collins L.; Kaszuba M.; Fabre J. W. Biochim. Biophys. Acta, Gen. Subj. 2004, 1672, 12–20. [DOI] [PubMed] [Google Scholar]
- Ho Y.-P.; Chen H. H.; Leong K. W.; Wang T.-H. J. Controlled Release 2006, 116, 83–89. [DOI] [PMC free article] [PubMed] [Google Scholar]
- Liu K. J.; Wang T.-H. Biophys. J. 2008, 95, 2964–2975. [DOI] [PMC free article] [PubMed] [Google Scholar]
- Liu K. J.; Brock M. V.; Shih I.; Wang T. H. J. Am. Chem. Soc. 2010, 132, 5793–5798. [DOI] [PMC free article] [PubMed] [Google Scholar]
- Mutch S. A.; Fujimoto B. S.; Kuyper C. L.; Kuo J. S.; Bajjalieh S. M.; Chiu D. T. Biophys. J. 2007, 92, 2926–2943. [DOI] [PMC free article] [PubMed] [Google Scholar]
- Mutch S. A.; Gadd J. C.; Fujimoto B. S.; Kensel-Hammes P.; Schiro P. G.; Bajjalieh S. M.; Chiu D. T. Nat. Protocols 2011, 6, 1953–1968. [DOI] [PMC free article] [PubMed] [Google Scholar]
- Limpert E.; Stahel W. A.; Abbt M. Bioscience 2001, 51, 341–352. [Google Scholar]
- Zhang Y.; Liu K. J.; Wang T.-L.; Shih I.-M.; Wang T.-H. ACS Nano 2011, 6, 858–864. [DOI] [PMC free article] [PubMed] [Google Scholar]
- Neish C. S.; Martin I. L.; Henderson R. M.; Edwardson J. M. Br. J. Pharmacol. 2002, 135, 1943–1950. [DOI] [PMC free article] [PubMed] [Google Scholar]
- Fortune J. A.; Novobrantseva T. I.; Klibanov A. M. J. Drug Delivery 2011, 2011. [DOI] [PMC free article] [PubMed] [Google Scholar]
- Gruber H. J.; Hahn C. D.; Kada G.; Riener C. K.; Harms G. S.; Ahrer W.; Dax T. G.; Knaus H.-G. Bioconjugate Chem. 2000, 11, 696–704. [DOI] [PubMed] [Google Scholar]
- Berlier J. E.; Rothe A.; Buller G.; Bradford J.; Gray D. R.; Filanoski B. J.; Telford W. G.; Yue S.; Liu J.; Cheung C.-Y.; Chang W.; Hirsch J. D.; Beechem Rosaria P.; Haugland J. M.; Haugland R. P. J. Histochem. Cytochem. 2003, 51, 1699–1712. [DOI] [PubMed] [Google Scholar]
- Kang J.; Kaczmarek O.; Liebscher J.; Dähne L. Int. J. Polym. Sci. 2010, 2010, 1–7. [Google Scholar]
- Kuznetsova S.; Zauner G.; Schmauder R.; Mayboroda O. A.; Deelder A. M.; Aartsma T. J.; Canters G. W. Anal. Biochem. 2006, 350, 52–60. [DOI] [PubMed] [Google Scholar]
- Schobel U.; Egelhaaf H.-J.; Fröhlich D.; Brecht A.; Oelkrug D.; Gauglitz G. J. Fluoresc. 2000, 10, 147–147. [Google Scholar]
- Mao S.; Neu M.; Germershaus O.; Merkel O.; Sitterberg J.; Bakowsky U.; Kissel T. Bioconjugate Chem. 2006, 17, 1209–1218. [DOI] [PubMed] [Google Scholar]
- Albuzat T.; Keil M.; Ellis J.; Alexander C.; Wenz G. J. Mater. Chem. 2012, 22, 8558–8565. [Google Scholar]
- Grigsby C. L.; Ho Y.-P.; Lin C.; Engbersen J. F. J.; Leong K. W. Sci. Rep. 2013, 3, 1–7. [DOI] [PMC free article] [PubMed] [Google Scholar]
- Chu D. S. H.; Schellinger J. G.; Shi J.; Convertine A. J.; Stayton P. S.; Pun S. H. Acc. Chem. Res. 2012, 45, 1089–1099. [DOI] [PMC free article] [PubMed] [Google Scholar]
- Yu J.; Vodyanik M. A.; Smuga-Otto K.; Antosiewicz-Bourget J.; Frane J. L.; Tian S.; Nie J.; Jonsdottir G. A.; Ruotti V.; Stewart R.; Slukvin I. I.; Thomson J. A. Science 2007, 318, 1917–1920. [DOI] [PubMed] [Google Scholar]
- Wang H.; Jia T. H.; Zacharias N.; Gong W.; Du H. X.; Wooley P. H.; Yang S. Y. Gene Ther. 2013, 20, 128–135. [DOI] [PMC free article] [PubMed] [Google Scholar]
- Greber D.; Fussenegger M. Biotechnol. Bioeng. 2007, 96, 821–834. [DOI] [PubMed] [Google Scholar]
Associated Data
This section collects any data citations, data availability statements, or supplementary materials included in this article.