Abstract
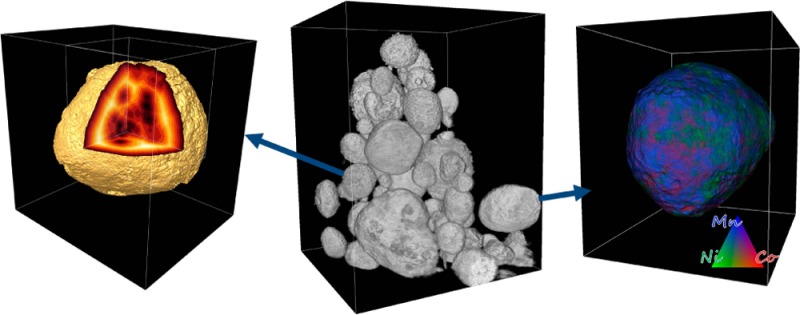
Understanding the evolution of chemical composition and morphology of battery materials during electrochemical cycling is fundamental to extending battery cycle life and ensuring safety. This is particularly true for the much debated high energy density (high voltage) lithium–manganese rich cathode material of composition Li1 + xM1 – xO2 (M = Mn, Co, Ni). In this study we combine full-field transmission X-ray microscopy (TXM) with X-ray absorption near edge structure (XANES) to spatially resolve changes in chemical phase, oxidation state, and morphology within a high voltage cathode having nominal composition Li1.2Mn0.525Ni0.175Co0.1O2. Nanoscale microscopy with chemical/elemental sensitivity provides direct quantitative visualization of the cathode, and insights into failure. Single-pixel (∼30 nm) TXM XANES revealed changes in Mn chemistry with cycling, possibly to a spinel conformation and likely including some Mn(II), starting at the particle surface and proceeding inward. Morphological analysis of the particles revealed, with high resolution and statistical sampling, that the majority of particles adopted nonspherical shapes after 200 cycles. Multiple-energy tomography showed a more homogeneous association of transition metals in the pristine particle, which segregate significantly with cycling. Depletion of transition metals at the cathode surface occurs after just one cycle, likely driven by electrochemical reactions at the surface.
Keywords: Li-ion battery, Li−Mn-rich NMC, X-ray nanotomography, XANES imaging
In the past decade, major efforts have been made to identify specific battery chemistries and materials systems that promise higher energy density at a lower cost, and improved thermal safety and cycle life.1−3 To attain these combined goals, many fundamental challenges must be addressed. For many promising electrode materials, a key challenge is the irreversible degradation of specific capacity after prolonged charge/discharge cycles.4−6 Electrochemical charge transport in energy storage materials typically involves insertion (and deinsertion) of ions, e.g. lithium or sodium, inducing atomic rearrangement of the lattice and often driving local phase segregation due to migration and/or diffusion of atoms. These changes often lead to stabilization of low energy phases with concomitant changes in particle size, shape, grain, and morphology.7−19 Particularly promising cathode materials that have grabbed recent attention are high capacity lithium- manganese rich nickel cobalt oxide (LMR-NMC) composite cathodes that promise almost twice the useable capacity (∼280 mAh/g) compared to standard cathodes such as lithium cobalt oxides.8,11,12,18 These compositions can be nominally written as Li1+xM1–xO2 (where M = Mn, Co, Ni) or can be denoted by a two phase notation xLi2MnO3·(1 – x)LiMO2 where x typically varies between 0.2–0.7.18−21 In their pristine form, these materials have a majority phase (LiMO2) with an R3̅m layered–layered structure and a minority phase (Li2MnO3) that is monoclinic (C2/m).9
Unfortunately, when this particular class of high capacity material is electrochemically cycled at voltages greater than 4.5 V, the discharge voltage profile gradually moves to a lower voltage accompanied by a large hysteresis between the charge and discharge profiles. This effect is commonly referred to as “voltage fade”.20,22,23 As a result, there is significant loss of energy as the cathode is progressively cycled, making the material unsuitable as a practical high-energy cathode material. The mechanism of this structural transition is not well understood, but a number of recent electron microscopy studies combined with electron energy-loss spectroscopy, and other X-ray and neutron studies have revealed a structural transition from the layered–layered phase to a lower energy defect-type spinel phase when the material is cycled above 4.5 V.12,19,24 The driving force behind this transition is often ascribed to both migration and exchange of lithium and transition metals (TM) between octahedral and tetrahedral sites during repeated lithiation and delithiation processes.12 In addition, there is also migration or diffusion of TM cations from the bulk to the cathode particle surface driving a number of surface reactions with the electrolyte at higher voltage.23,25 Many of these factors could affect the overall material chemical composition, morphology, and stability. The characterization methods mentioned above are often complementary; some methods characterize sample properties within highly localized regions (nanometer and less), while other methods characterize properties over ensemble averages of particles that may miss local changes due to chemical or morphological heterogeneity. One of the goals of this study is to correlate nanoscale to mesoscale morphological, chemical, and structural changes within secondary particles of the battery electrode (see SEM images in Figure S1, Supporting Information).
Here, we employ full-field (FF) transmission X-ray microscopy (TXM), which is capable of 3D imaging at high spatial resolution over a field of view of about 30 × 30 × 30 μm3 (or greater by performing mosaic sample imaging)26−33 to examine pristine and cycled high voltage LMR-NMC cathodes of composition Li1.2Mn0.525Ni0.175Co0.1O2. TXM provides both the spatial resolution (∼30 nm) and spectroscopic capability in 2D and 3D required to distinguish the distinct evolution of bulk and surface regions of the battery materials, and to follow the emergence of new local phases.34−37 Comparison of morphology and internal structure of electrodes processed through various numbers of charge cycles provides direct information about particle breakup and degradation during electrochemical cycling.
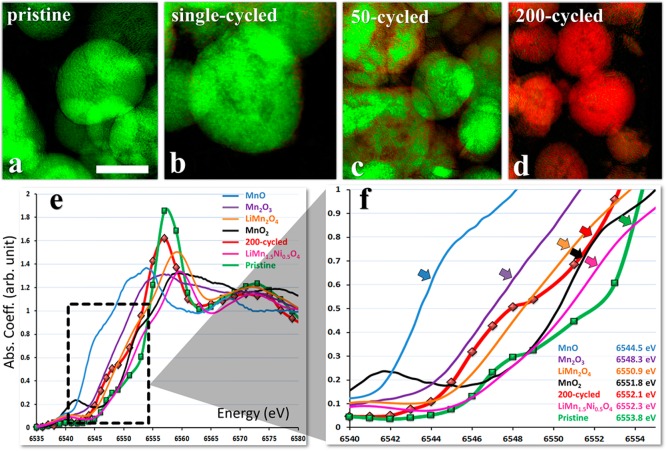
Electrode materials were sampled at different stages of the battery lifetime: pristine (uncycled), 1×-cycled, 50×-cycled, and 200×-cycled. TXM images were acquired as a function of X-ray energy near the absorption edges of Mn, Co, and Ni to investigate spatially resolved chemistry. These depth-integrated measurements resolve the chemical heterogeneity in two dimensions and provide a 2D projection of the 3D TM density distribution within the secondary particles. This 2D technique does not explicitly distinguish near surface from bulk properties, but the behavior of near-surface material is weighted more heavily than that of the center of the particle. Ni and Co K–edge 2D XANES spectra showed little or no change in their respective valence states with respect to the number of cycles, and thus are not the focus of this work (although there may be changes in Co speciation that would be more noticeable in Co L-edge XANES spectra19). The near edge spectroscopic data at the Mn K-edge (Figure 1e) showed significant changes after battery cycling and are thus a key indicator for studying chemical phase transitions in these materials under high voltage cycling.23,38−42
Figure 1.
Mn chemical phases and their distribution within LRM-NMC particles cycled at C/10 rate between 4.9 and 2.5 V. Panels a to d: Representative 2D XANES chemical maps of Mn, as a function of cycling. The color maps were determined by fitting each of the single pixel XANES spectra (30 nm resolution; ∼106 per field of view, created from energy stacks of images36) to the reference spectra for the 200×-cycled or pristine electrodes, assigned to green or red, respectively. The scale bar shown in panel a is 10 μm. The X-ray near-edge spectra and magnified plots of the two end components, the pristine and 200×-cycled samples, are shown in panels e and f, respectively, as well as the corresponding data for a few known Mn-based compounds. The edge energies of the spectra are defined as the energies at half-height of the white-line peak.
Changes in the Mn K-edge spectra of LMR-NMC cathode particles as a function of cycle number (see Supporting Information, Figure S3) show that with increased cycle numbers the Mn chemistry in the pristine phase (indicated in green) gradually evolves into a distinctly different Mn composition after 200 cycles (red). The Mn K-edge spectra of the starting and ending compositions (pristine and 200×-cycled) (Figure 1e) were used as principle compounds to follow the average change in Mn valence state as a function of electrochemical cycling. The evolution of Mn K-edge spectra as evident from the color coded pictures in Figure 1 is consistent with changes in the bulk electrochemical signature. Changes in electrochemical behavior shown in the charge–discharge voltage profiles are more clearly observed in the differential capacity (dq/dv) plot given for the first, 50th, and 200th cycles (Supporting Information, Figure S2). With increasing number of cycles the dominant contribution to capacity moves from the high voltage region to below 3 V, which could indicate a structural transition concomitant with the shift seen in the Mn K-edge (discussed below).
In order to understand the Mn K-edge spectra of pristine and cycled LMR-NMC in more detail we have measured the XANES of a number of reference compositions including MnO, Mn2O3, MnO2, and two relevant spinel compositions, LiMn2O4 and LiMn1.5Ni0.5O4.43−46 It is particularly important to compare the latter two compositions because the LMR-NMC transitions with cycling from a majority layered–layered phase to a more spinel like structure. The main features of the Mn K-edge XANES are a pre-edge peak followed by shoulder or edges corresponding to various shake up (down) processes, and a main peak that is assigned to dipole allowed 1s → 4p transitions.46 In this work, we focus on analyzing the absorption edge positions of the XANES spectra for the corresponding compositions (Figure 1e,f) defined as the energy at the half-height of the white line peak. For Mn oxides, the absorption edge shifts toward higher energy as the Mn oxidation state changes from +2 to +4. For the spinel composition, we notice a blue shift of the absorption edge with Ni substitution (from 6550.9 to 6552.3 eV), consistent with decreased electron density around Mn.46 Comparison of the respective absorption K-edge values and spectra of the 200×-cycled LMR-NMC with these reference compounds, particularly LiMn1.5Ni0.5O4 and MnO2, provides strong evidence of a spinel like phase forming when the pristine LMR-NMC is cycled at higher voltage. The shoulder peak in the spectrum of the 200×-cycled sample is likely caused by a contribution from Mn2+, which is consistent with previous studies using surface sensitive methods such as X-ray photoelectron spectroscopy (XPS).47 In addition, the edge position for Mn in the 200×-cycled sample is lower than in the pristine (6552.1 vs 6553.8 eV), indicating more reduced Mn in the cycled sample, along with higher valence states.
The 2D TXM XANES images based on Mn K-edges for various stages of cycling (Figure 1a–d) and the individual spectral evolution with Mn oxidation state and composition provide a powerful method to spatially monitor the changes from nano to mesoscale. These results are consistent with bulk XAS and electron microscopy studies reported earlier on similar compositions, for pristine and cycled LMR-NMC compositions.8,9,12,41,46 It is noteworthy that although the single pixel Mn K-edge XANES spectra have high resolution (30 nm), the 2D spatial maps provide chemical fingerprints of multiple LMR-NMC cathode particles, which are in the range of a few micrometers or more. The 2D chemical maps also provide another important insight: as shown in Figure 1, parts b and c, it appears that changes first appear at the particle surface, implying that chemical and structural changes are initiated at the surface and move inside the bulk of the particle.19 These changes may be associated with more Mn2+ at the surface as the electrode evolves, evidenced by the lower Mn K-edge opposition of the spectrum from the 200×-cycled sample. This is consistent with STEM–EELS data,19 and with findings that surface oxygen can be removed as O2, resulting in reduction of TM oxidation states.48
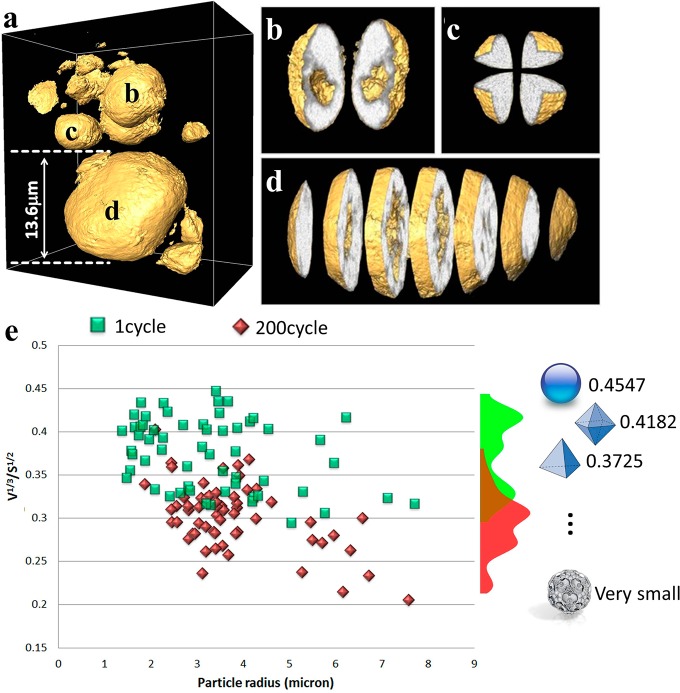
Although the 2D TXM-XANES analysis of LMR-NMC cathode materials presented above provides important information about the oxidation state evolution of Mn during repeated charge/discharge cycles, true 3D mapping is needed to distinguish heterogeneities and to fully characterize processes related to degradation of cathode performance. 3D tomography was performed on electrode materials that were cycled 1× and 200× between 2.5 and 4.9 V. Details regarding the tomographic reconstructions are described in the Methods section in the Supporting Information. More than 60 cathode particles in each group of samples were investigated, providing good statistics for the evaluation of morphological changes over electrochemical cycling. To interpret the observed changes we evaluated the morphological complexity of individual cathode particles using tomography data collected with monochromatic X-rays at 6630 eV (90 eV above the Mn K-edge). A selection of typical particles from the 1×-cycled electrode (Figure 2a) were rendered, with three of them virtually sliced/cut, as presented in the magnified views in parts b–d of Figure 2. The particles showed a range of distinct internal structure, solid and “hollow” possessing internal macro pores.
Figure 2.
Three dimensional morphology of cycled particles and corresponding statistical analysis. Panel a: A selection of typical particles from the 1×-cycled electrode from tomography data acquired at 6630 eV, with views of several particles magnified and virtually sliced/cut, indicating different types of morphology (solid and hollow; shown in panels b, c, and d). The gold surface rendering highlights the particle surface and macro pores; the gray-white volume represents the relative density of each voxel. Panel e: A plot of complexity parameter ε (defined as ε = V1/3/S1/2; unitless) versus particle radius for two groups of particles, cycled 1× (green) and 200× (red), indicates that complexity of the particle structure increases as particle size increases. A histogram of the data points is plotted on the right-hand side of panel e, along with a few selected standard geometric objects and their ε values for comparison.
To quantify morphological complexity of the cathode particles and its subsequent evolution with electrochemical cycling, we used a dimensionless parameter, ε = V1/3/S1/2 (V is the solid volume of the particle; and S is the total surface area of the solid phase).49 As a guideline, we list here the ε values for a few standard 3D solid objects (εsphere = 0.4547; εoctahedron = 0.4182; εcube = 0.4082; εtetrahedron = 0.3725; ε for a fractal object can be small and close to zero), as illustrated in the right column of Figure 2e. As seen from the list, more “complex” objects (i.e., different from the algebraic topologically stable form, the sphere) have smaller ε values. A plot of ε versus particle radius for more than 120 of the LMR-NMC particles (Figure 2e) scanned in our experiments from the 1×-cycled (green) and 200×-cycled (red) electrodes shows a wide range of ε values. It is important to clarify here that the particles are certainly not regularly shaped and the “radius” mentioned is an averaged estimation using the formula r = (3 V/4π)1/3, in which V is the volume of the particle disregarding (if any) the internal macro pores. The plot in Figure 2e shows a clear separation in morphology of the 1×-cycled particles and the 200×-cycled particles. The histogram pattern of data from Figure 2e as a function of particle complexity ε (showed in the right inset of Figure 2e) shows that the particles that have been cycled only once have ε values varying between 0.45 and 0.3, with a median value close to 0.4. In the case of the 200×-cycled cathode particles the ε value ranged between 0.35 and 0.2, indicating much larger deviation from spherical morphology for the secondary particle aggregates. This suggests that during repeated electrochemical events the electrode particles undergo internal stresses that could lead to events such as change in their internal porosities, amorphization, cracking, or fracture affecting both internal as well as external morphologies.
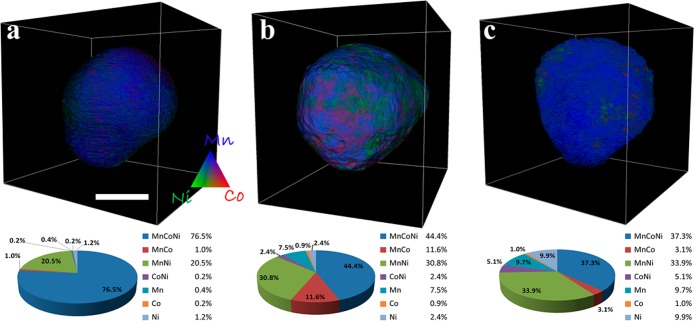
It is also of great interest to correlate the changes in particle morphologies as they evolve under electrochemical cycling with their spatial elemental distribution in three dimensions. Energy tunability of synchrotron X-rays allows us to study the energy dependence of the absorption coefficient at each volume element (voxel) within the entire reconstructed 3D space.36,50−52 Elemental sensitivity is achieved by subtracting the absorption density corresponding to each voxel as measured above and below the X-ray absorption edges of the transition metals.53 Here we are interested in the 3D distributions and relationships between Mn, Co, and Ni TM elements in the LMR-NMC cathode particles. Figure 3 shows the 3D renderings of selected particles from the pristine (Figure 3a), 1×-cycled (Figure 3b), and 200×-cycled (Figure 3c) electrodes with elemental concentrations color-coded (color legend shown in the inset). The corresponding pie charts (the relative concentration of different elemental associations calculated by performing a correlation analysis of the 3D transition metal maps, also known as absorption correlation tomography54) show the elemental TM associations in the cathode particles. In the pristine LMR-NMC particle, we notice about 76% Mn–Co–Ni association indicating a majority phase as layered NMC. In addition, about 20.6% of the voxels in the pristine particle contain Mn–Ni; the rest of the phases occupy only ∼3% of the total voxels. After the first full cycle we expect activation of the Li2MnO3 component, leading to a final discharged phase, predicted to be a mixture of Li1.2-y(MnCoNi)O2 and LiyMnO2 phases.55 Interestingly, we observe 8% as a pure Mn-based phase followed by 44% Mn–Co–Ni, 31% Mn–Ni and 12% Mn–Co. In the 200×-cycled particle, the Mn–Co–Ni phase drops down to ∼37% while the pure Mn- and Ni-based phases rise to ∼10% each with minimal pure Co-based phase (∼1%).
Figure 3.
Three dimensional renderings of selected particles from the pristine (panel a), 1×-cycled (panel b) and 200×-cycled (panel c) electrodes with elemental distribution resolved from tomography above and below the K-edges of Mn, Co and Ni. The color legend represents relative concentrations of the TM elements. The scale bar shown in panel a is 5 μm. The corresponding pie charts calculated by using absorption correlation tomography show the relative concentrations of different elemental associations within each particle.
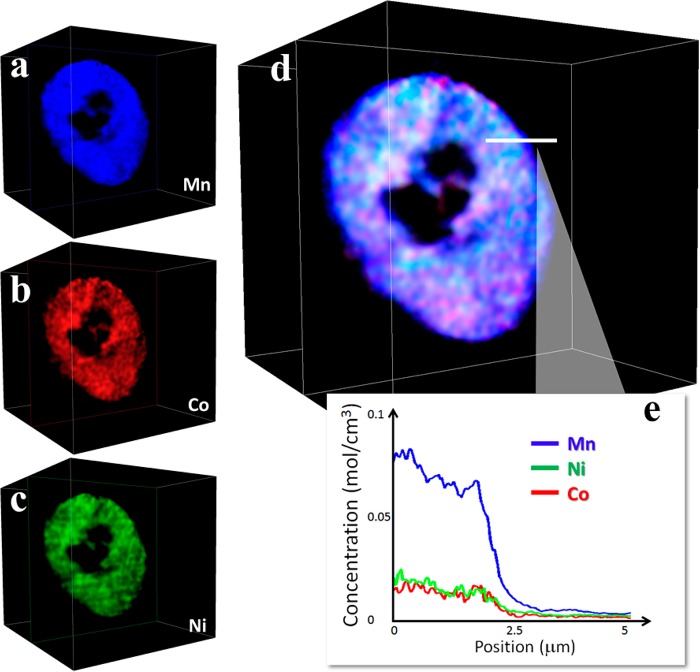
In order to obtain additional information at the cathode particle surface or edges, we obtained the respective elemental line profile of a selected slice through the three-dimensional volume. Figure 4 shows spatial concentration profiles for Mn, Co, and Ni, respectively, for a 1×-cycled internally hollow LMR-NMC cathode. Figure 4d shows the overlay of all three TMs over the same slice, with the line profile plotted in Figure 4e showing a relative Mn-rich layer on the surface. Overall, we see richer Mn regions (indicated in blue) because the cathode composition is Mn-rich (about 65%) but the relative increase of Mn at the surface indicates formation of a Mn-rich phase after the first full cycle. Although the 3D TM mapping evaluations were not performed on the same particles, the dramatic differences among the elemental associations for the pristine, 1× and 200× cycled electrodes provide direct evidence of migration and/or redistribution of the transition metals upon high voltage cycling. The data also suggest that Mn segregation begins after the first full cycle. Such observation is consistent with and complementary to electron microscopy results reported by Gu et al.12,56 observing TM segregation within nanoparticles. Gu et al.56 and Lee et al.17 proposed that such segregations, and formation of a more disordered chemical structure could slow down Li diffusion, negatively affecting battery performance. Further evidence for increased morphological disorder and migration of Mn, Co, and Ni was quantified, below.
Figure 4.
Panels a, b, and c: Distribution of TMs (Mn, Co, and Ni, respectively) over a single selected slice (one voxel thickness) through the 3D volume of the 1x-cyled electrode from Figure 3b. Panel d: Overlay of all TMs over the same slice. Panel e: Elemental concentration profile over the line (5 μm in length) indicated in panel d.
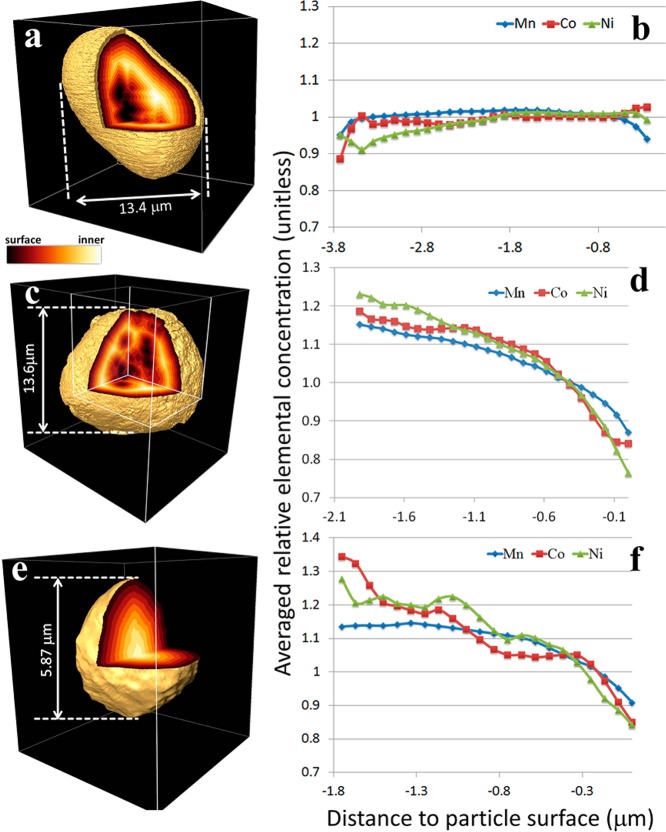
As discussed in the context of the 2D TXM XANES results (Figure 1a–d), there is an indication that electrochemical reactions are first initiated at the surface of the cathode particles and further propagate into the bulk as the cycling proceeds.55 However, the 2D projections (Figure 1a–d) are integrated over the thickness of the particles. For evaluating the “depth dependency” of the cycling effect, we must rely on 3D tomography data. In order to study the “depth dependency”, we have regrouped the 3D voxels as a function of depth from the surface by generating “3D distance maps”, in which the value of every voxel represents the shortest distance from the corresponding voxel to a surface (outer surface and/or surface of macro pores inside the particle), visualized via virtual segmentation. The three-dimensional representations of the ’distance maps’ for three representative cathode particles, selected from the pristine (Figure 5a) and 1×-cycled (Figure 5, parts c and e) electrode, demonstrate the internal composition of the structures. As illustrated in Figure 5, these particles are different in terms of their internal morphology (hollow, Figure 5, parts a and c; and solid, Figure 5e), leading to very different “distance maps”. On the basis of segmentation of the “3D distance maps”, we have generated distribution plots (Figure 5, parts b, d, and f) to compare the averaged relative concentration (see Supporting Information for method used) of the TMs as a function of distance from the corresponding particle volume element, or voxel, to a particle surface (outer surface and/or surface of a macro pore within the particle). For the 1×-cycled particles, there is a depletion of transition metals near the surface regions of the particles as indicated by a decrease in relative density of all three TMs (Figure 5, parts d and f). However, the plot for the pristine particle shows relative constant concentration throughout the entire particle (Figure 5b) indicating a more uniform Mn–Ni–Co arrangement, consistent with Figure 3a. This also suggests that the particles are relatively porous at the surface when the cathode particle undergoes a full charge–discharge cycle (2.5–4.9 V),19 which is consistent with previous findings on the enrichment of TMs in the bulk compared to the surface.48
Figure 5.
“3D distance maps” of a pristine LMR NMC particle (panel a) and two 1×-cycled particles (panels c and e). The value of every voxel represents the shortest distance to a surface (outer surface and/or surface of macro pores inside the particle), visualized via virtual segmentation. The color legend indicates the relative value of the distance from each individual voxel to the surface of the particles. The corresponding averaged relative elemental concentrations of all three TMs (Mn in blue, Co in red, and Ni in green) are plotted as a function of the distance to the particle surface (panels b, d, and f). (See Supporting Information for calculation method.) Lower levels of TMs at surfaces are observed in the 1×-cycled particles (panels d and f) but TMs are more uniformly distributed in the pristine (panel b).
The “depth dependency” presented here supports the picture that the electrochemically induced migration of TMs plausibly starts at the surface and then propagates into the body of the particle. Another hypothesis for this observed increase in porosity toward the particle surface is the diffusion of TM cations due to voids generated from the creation of oxygen vacancies caused by Li2MnO3 activation during the first electrochemical cycle.10,57 The similarities in the distribution plots in Figure 5, parts b and d, for both hollow and solid particles suggest that surfaces of the inner macro pores show no significant difference in elemental distributions, compared with outer surfaces. It is possible that the interior macro pores are connected to the particle outer surface through nanoscale pores or cracks in the cathode particles. These nanoscale pores/cracks would not be visible in the tomographic reconstruction because they are smaller than the spatial resolution limit (∼30 nm). The existence of such cracks and internal pores for LMR-NMC cathode particles has been reported in several local probe studies such as aberration corrected high-resolution electron microscopy experiments.8,9,12
In conclusion, using combined XANES and full-field TXM we have investigated the chemical, morphological, and oxidation state changes of high-voltage LMR-NMC (Li1.2Mn0.525Ni0.175Co0.1O2) cathode particles as a function of charge–discharge cycle. The Mn K-edge XANES spectra of pristine and cycled LMR-NMC cathodes provide a chemical fingerprint indicating structural changes or degradation under high voltage electrochemical cycling. Changes in Mn chemistry were seen with cycling, likely to a spinel form and reduced Mn, starting from the particle surface and extending deeper with cycling. Tomographic reconstruction of cathode particles cycled 1× and 200× showed significant variation in particle morphology, with the majority of particles adopting nonspherical shapes when cycled. Further analysis via multiple-energy tomography revealed that TMs were ∼80% homogeneously distributed in pristine electrodes but began segregating after just one cycle, and to a greater extent with 200 cycles. Further analysis yielded the bulk 3D elemental TM distribution and its variation from particle center to the surface, taking into account changes in internal geometry that produced surface-like structures within the particles. Results show depletion of TMs at outer and inner cathode surfaces after just one cycle, driven by electrochemical reactions at the surface. The depth dependence study also suggests that inner macro pores are likely connected to the particle surface through nanoscale pores/cracks. In summary, TXM-XANES is a powerful method to observe nanoscale (∼30 nm) chemical and morphological changes in battery materials, and to reconstruct tomographic maps with tens of nm resolution but covering mesoscale length scales over tens of microns. Taking into account both the large field of view and elemental sensitivity, this technique when studied in operando will provide a powerful method, complementary to electron microscopy, for studying evolution of phases and morphology of state of the art battery materials and cells.
Acknowledgments
The authors gratefully thank Dr. Michael F. Toney, Dr. Apurva Mehta, and Dr. Johanna Nelson Weker (all from SLAC National Accelerator Laboratory) for valuable discussions. This research at Oak Ridge National Laboratory, managed by UT-Battelle, LLC, for the U.S. Department of Energy under Contract DE-AC05-00OR22725, is sponsored by the Vehicle Technologies Program for the Office of Energy Efficiency and Renewable Energy. The TXM at SSRL was supported by NIH/NIBIB under Grant Number 5R01EB004321. Portions of this research were carried out at the Stanford Synchrotron Radiation Lightsource, a Directorate of SLAC National Accelerator Laboratory and an Office of Science User Facility operated for the U.S. Department of Energy Office of Science by Stanford University. Z.W. acknowledges the support from the Science Fund for Creative Research Groups, NSFC (Grant Number: 11321503), the National Basic Research Program of China (Grant Number: 2012CB825801), and the Knowledge Innovation Program of the Chinese Academy of Sciences (Grant Number: KJCX2-YW-N42).
Supporting Information Available
Further details on materials and methods and additional TXM data. This material is available free of charge via the Internet at http://pubs.acs.org.
Author Present Address
∥ Department of Chemistry, Indian Institute of Technology Hyderabad, Ordnance Factory Estate, Yeddumailaram, 502205, Andhra Pradesh, India
Author Contributions
Y.L. and J.N. designed the project. F.Y., Y.L., and J.C.A. performed the TXM measurements. F.Y. and Y.L. analyzed the data. F.Y., Y.L., J.C.A., and J.N. wrote the manuscript. S.K.M prepared the samples and performed the electrochemical cycling. Z.W., G.E.I., and P.P. contributed to the interpretation of the data. The manuscript reflects the contributions of all authors.
The authors declare no competing financial interests.
Funding Statement
National Institutes of Health, United States
Supplementary Material
References
- Armand M.; Tarascon J.-M. Nature 2008, 451, 652. [DOI] [PubMed] [Google Scholar]
- Dunn B.; Kamath H.; Tarascon J.-M. Science 2011, 334, 928. [DOI] [PubMed] [Google Scholar]
- Bruce P. G.; Freunberger S. A.; Hardwick L. J.; Tarascon J.-M. Nat. Mater. 2012, 11, 19. [DOI] [PubMed] [Google Scholar]
- Whittingham M. S. Chem. Rev. 2004, 104, 4271. [DOI] [PubMed] [Google Scholar]
- Goodenough J. B. Acc. Chem. Res. 2013, 46, 1053. [DOI] [PubMed] [Google Scholar]
- Wang L.; Li J.; He X.; Pu W.; Wan C.; Jiang C. J. Solid State Electrochem. 2009, 13, 1157. [Google Scholar]
- Xu B.; Fell C. R.; Chi M.; Meng Y. S. Energy Environ. Sci. 2011, 4, 2223. [Google Scholar]
- Ito A.; Li D.; Sato Y.; Arao M.; Watanabe M.; Hatano M.; Horie H.; Ohsawa Y. J. Power Sources 2010, 195, 567. [Google Scholar]
- Jarvis K. A.; Deng Z.; Allard L. F.; Manthiram A.; Ferreira P. J. Chem. Mater. 2011, 23, 3614. [Google Scholar]
- Armstrong A. R.; Holzapfel M.; Novák P.; Johnson C. S.; Kang S.-H.; Thackeray M. M.; Bruce P. G. J. Am. Chem. Soc. 2006, 128, 8694. [DOI] [PubMed] [Google Scholar]
- Thackeray M. M.; Kang S.-H.; Johnson C. S.; Vaughey J. T.; Benedek R.; Hackney S. A. J. Mater. Chem. 2007, 17, 3112. [Google Scholar]
- Gu M.; Belharouak I.; Zheng J.; Wu H.; Xiao J.; Genc A.; Amine K.; Thevuthasan S.; Baer D. R.; Zhang J.-G.; Browning N. D.; Liu J.; Wang C. ACS Nano 2013, 7, 760. [DOI] [PubMed] [Google Scholar]
- Kim D.; Kang S.-H.; Balasubramanian M.; Johnson C. S. Electrochem. Commun. 2010, 12, 1618. [Google Scholar]
- Lin J.; Mu D.; Jin Y.; Wu B.; Ma Y.; Wu F. J. Power Sources 2013, 230, 76. [Google Scholar]
- McCalla E.; Rowe A. W.; Shunmugasundaram R.; Dahn J. R. Chem. Mater. 2013, 25, 989. [Google Scholar]
- Liu X.; Wang D.; Liu G.; Venkat S.; Liu Z.; Hussain Z.; Yang W. Nat. Commun. 2013, 4, 2586. [DOI] [PMC free article] [PubMed] [Google Scholar]
- Lee J.; Urban A.; Li X.; Su D.; Hautier G.; Ceder G. Science 2014, 343, 519–522. [DOI] [PubMed] [Google Scholar]
- Hong J.; Seo D.-H.; Kim S.-W.; Gwon H.; Oh S.-T.; Kang K. J. Mater. Chem. 2010, 20, 10179. [Google Scholar]
- Lin F.; Markus M. M.; Nordlund D.; Weng T.-C.; Asta M. D.; Xin H. L.; Doeff M. M. Nat. Commun. 2014, 5, 3529. [DOI] [PubMed] [Google Scholar]
- Martha S. K.; Nanda J.; Veith G. M.; Dudney N. J. J. Power Sources 2012, 199, 220. [Google Scholar]
- Johnson C. S.; Li N.; Lefief C.; Vaughey J. T.; Thackeray M. M. Chem. Mater. 2008, 20, 6095. [Google Scholar]
- Bettge M.; Li Y.; Gallagher K.; Zhu Y.; Wu Q.; Lu W.; Bloom I.; Abraham D. P. J. Electrochem. Soc. 2013, 160, A2046. [Google Scholar]
- Li Y.; Bettge M.; Polzin B.; Zhu Y.; Balasubramanian M.; Abraham D. P. J. Electrochem. Soc. 2013, 160, A3006. [Google Scholar]
- Mohanty D.; Sefat A. S.; Li J.; Meisner R. A.; Rondinone A. D.; Payzant E. A.; Abraham D. P.; Wood D. L. III; Daniel C. Phys. Chem. Chem. Phys. 2013, 15, 19496. [DOI] [PubMed] [Google Scholar]
- Fell C. R.; Carroll K. J.; Chi M.; Meng Y. S. J. Electrochem. Soc. 2010, 157, A1202. [Google Scholar]
- Neuhausler U.; Schneider G.; Ludwig W.; Meyer M. A.; Zschech E.; Hambach D. J. Phys. D-Appl. Phys. 2003, 36, A79. [Google Scholar]
- Yin G.-C.; Tang M.-T.; Song Y._F.; Chen F.-R.; Liang K. S.; Duewer F. W.; Yun W.; Ko C.-H.; Shieh H.-P. D. Appl. Phys. Lett. 2006, 88, 241115. [Google Scholar]
- Chu Y. S.; Yi J. M.; De Carlo F.; Shen Q.; Lee W.-K.; Wu H. J.; Wang C. L.; Wang J. Y.; Liu C. J.; Wang C. H.; Wu S. R.; Chien C. C.; Hwu Y.; Tkachuk A.; Yun W.; Feser M.; Liang K. S.; Yang C. S.; Je J. H.; Margaritondo G. Appl. Phys. Lett. 2008, 92, 103119. [Google Scholar]
- Kim G. B.; Yoon Y. J.; Shin T. J.; Youn H. S.; Gho Y. S.; Lee S. J. Microsc. Res. Tech. 2008, 71, 639. [DOI] [PubMed] [Google Scholar]
- Li W.; Wang N.; Chen J.; Liu G.; Pan Z.; Guan Y.; Yang Y.; Wu W.; Tian J.; Wei S.; Wu Z.; Tian Y.; Guo L. Appl. Phys. Lett. 2009, 95, 053108. [Google Scholar]
- Wang J.; Chen Y.-c. K.; Yuan Q.; Tkachuk A.; Erdonmez C.; Hornberger B.; Feser M. Appl. Phys. Lett. 2012, 100, 143107. [Google Scholar]
- Yuan Q.; Zhang K.; Hong Y.; Huang W.; Gao K.; Wang Z.; Zhu P.; Gelb J.; Tkachuk A.; Hornberger B.; Feser M.; Yun W.; Wu Z. J. Synchrotron Radiat. 2012, 19, 1021. [DOI] [PubMed] [Google Scholar]
- Nelson J.; Misra S.; Yang Y.; Jackson A.; Liu Y.; Wang H.; Dai H.; Andrews J. C.; Cui Y.; Toney M. F. J. Am. Chem. Soc. 2012, 134, 6337. [DOI] [PubMed] [Google Scholar]
- Boesenberg U.; Meirer F.; Liu Y.; Shukla A. K.; Dell’Anna R.; Tyliszczak T.; Chen G.; Andrews J. C.; Richardson T. J.; Kostecki R.; Cabana J. Chem. Mater. 2013, 25, 1664. [DOI] [PMC free article] [PubMed] [Google Scholar]
- Chen W.-C.; Song Y.-F.; Wang C.-C.; Liu Y.; Morris D. T.; Pianetta P. A.; Andrews J. C.; Wu H.-C.; Wu N.-L. J. Mater. Chem. A 2013, 1, 10847. [Google Scholar]
- Meirer F.; Cabana J.; Liu Y.; Mehta A.; Andrews J. C.; Pianetta P. J. Synchrotron Radiat. 2011, 18, 773. [DOI] [PMC free article] [PubMed] [Google Scholar]
- Wang J.; Chen-Wiegart Y.-c. K.; Wang J. Chem. Commun. 2013, 49, 6480. [DOI] [PubMed] [Google Scholar]
- Nam K.-W.; Bak S.-M.; Hu E.; Yu X.; Zhou Y.; Wang X.; Wu L.; Zhu Y.; Chung K.-Y.; Yang X.-Q. Adv. Funct. Mater. 2013, 23, 1047. [Google Scholar]
- Cabana J.; Casas-Cabanas M.; Omenya F. O.; Chernova N. A.; Zeng D.; Whittingham M. S.; Grey C. P. Chem. Mater. 2012, 24, 2952. [DOI] [PMC free article] [PubMed] [Google Scholar]
- Kang S. H.; Kempgens P.; Greenbaum S.; Kropf A. J.; Amine K.; Thackeray M. M. J. Mater. Chem. 2007, 17, 2069. [Google Scholar]
- Ito A.; Sato Y.; Sanada T.; Hatano M.; Horie H.; Ohsawa Y. J. Power Sources 2011, 196, 6828. [Google Scholar]
- Ates M. N.; Mukerjee S.; Abraham K. M. J. Electrochem. Soc. 2014, 161, A355. [DOI] [PMC free article] [PubMed] [Google Scholar]
- Croft M.; Sills D.; Greenblatt M.; Lee C.; Cheong S. W.; Ramanujachary K. V.; Tran D. Phys. Rev. B 1997, 55, 8726. [Google Scholar]
- Sun Y. K.; Kim M. G.; Kang S. H.; Amine K. J. Mater. Chem. 2003, 13, 319. [Google Scholar]
- Karan N. K.; Balasubramanian M.; Abraham D. P.; Furczon M. M.; Pradhan D. K.; Saavedra-Arias J. J.; Thomas R.; Katiyar R. S. J. Power Sources 2009, 187, 586. [Google Scholar]
- Wei Y.; Nam K. W.; Kim K. B.; Chen G. Solid State Ionics 2006, 177, 29. [Google Scholar]
- Zhan C.; Lu J.; Kropf A. J.; Wu T.; Jansen A. N.; Sun W.-K.; Qiu X.; Amine K. Nat. Commun. 2013, 4, 2437. [DOI] [PubMed] [Google Scholar]
- Koga H.; Croguennec L.; Ménétrier M.; Douhil K.; Belin S.; Bourgeois L.; Suard E.; Weill F.; Delmas C. J. Electrochem. Soc. 2013, 160, A786. [Google Scholar]
- Falconer K.Fractal Geometry: Mathematical Foundations and Applications; Wiley: New York, 2003. [Google Scholar]
- Rau C.; Somogyi A.; Simionovici A. Nucl. Instrum. Meth. Phys. Res. B 2003, 200, 444. [Google Scholar]
- Nelson G. J.; Harris W. M.; Izzo J. R. Jr.; Grew K. N.; Chiu W. K. S.; Chu Y. S.; Yi J.; Andrews J. C.; Liu Y.; Pianetta P. Appl. Phys. Lett. 2011, 98, 173109. [Google Scholar]
- Guttmann P.; Bittencourt C.; Rehbein S.; Umek P.; Ke X.; Van Tendeloo G.; Ewels C. P.; Schneider G. Nat. Photonics 2012, 6, 25. [Google Scholar]
- Liu Y.; Meirer F.; Wang J.; Requena G.; Williams P.; Nelson J.; Mehta A.; Andrews J. C.; Pianetta P. Anal. Bioanal. Chem. 2012, 404, 1297. [DOI] [PubMed] [Google Scholar]
- Kao T. L.; Shi C. Y.; Wang J.; Mao W. L.; Liu Y.; Yang W. Microsc. Res. Tech. 2013, 76, 1112. [DOI] [PubMed] [Google Scholar]
- Wang F.; Yu H.-C.; Chen M.-H.; Wu L.; Pereira N.; Thornton K.; Ven A. V.; Zhu Y.; Amatucci G. G.; Graetz J. Nat. Commun. 2012, 3, 1201. [DOI] [PubMed] [Google Scholar]
- Gu M.; Belharouak I.; Genc A.; Wang Z.; Wang D.; Amine K.; Gao F.; Zhou G.; Suntharampillai T.; Baer D. R.; Zhang J.-G.; Browning N. D.; Liu J.; Wang C. Nano Lett. 2012, 12, 5186. [DOI] [PubMed] [Google Scholar]
- Koga H.; Croguennec L.; Ménétrier M.; Mannessiez P.; Weill F.; Delmas C. J. Power Sources 2013, 236, 250. [Google Scholar]
Associated Data
This section collects any data citations, data availability statements, or supplementary materials included in this article.


