Abstract
Mesoporous and hollow carbon microspheres embedded with magnetic nanoparticles (denoted as MHM) were prepared via a facile self-sacrificial method for rapid capture of low-abundant peptides from complex biological samples. The morphology, structure, surface property, and magnetism were well-characterized. The hollow magnetic carbon microspheres have a saturation magnetization value of 130.2 emu g–1 at room temperature and a Brunauer–Emmett–Teller specific surface area of 48.8 m2 g–1 with an average pore size of 9.2 nm for the mesoporous carbon shell. The effectiveness of these MHM affinity microspheres for capture of low-concentration peptides was evaluated by standard peptides, complex protein digests, and real biological samples. These multifunctional hollow carbon microspheres can realize rapid capture and convenient separation of low-concentration peptides. They were validated to have better performance than magnetic mesoporous silica and commercial peptide-enrichment products. In addition, they can be easily recycled and present excellent reusability. Therefore, it is expected that this work may provide a promising tool for high-throughput discovery of peptide biomarkers from biological samples for disease diagnosis and other biomedical applications.
Keywords: carbon material, mesoporous, magnetic separation, peptide, enrichment
Introduction
In the past decade, carbon nanomaterials (e.g., carbon spheres, graphene, carbon nanotubes, etc.) have drawn intensive interest due to their remarkable chemical and physical properties such as chemical inertness, structural regularity, mechanical stability, electrical conductivity, and biocompability.1−3 Carbon materials with porous structures and hetero components can provide enhanced properties and multifunctional capabilities by combining the merits of large surface area and the synergistic effects between multiple discrete components, thereby showing high potential in various fields including functional object support, biofuel cell and energy storage, and fluorescent or electronic biosensors, etc.4−7 Recently, carbon nanomaterials with porous structure and multifunctional components have also been designed and constructed for biomedical applications. For example, biomolecule-functionalized carbon nanotubes, mesoporous carbon nanovectors, and carbon–silica hybrids were explored for targeted delivery of water-insoluble anticancer drugs,8,9 in virtue of the unique hydrophobic interactions and the supramolecular π stacking between drug molecules and the carbonaceous structures. In addition, by taking advantage of their multifunctional capabilities, graphene and mesoporous carbon composites attached by nanostructures or modified by functional molecules were widely investigated as electrode materials, enzyme mimics, and platforms for the detection of biological targets in medical diagnosis.10−12 Despite these burgeoning achievements, facile preparation of composite and multifunctional carbon nanostructures remains a great challenge, and it is highly desirable to further develop and adequately utilize their unique nanostructure and remarkable physiochemical properties in extending their use in demanding biomedical applications.
With the advent of the postgenomic era, proteomics has been developing for disease diagnosis and treatment, because it can provide a global perspective on protein expression changes for detailed descriptions of the structure, function, and control of biological systems.13,14 It is well-documented that some bioactive peptides play a pivotal role in a broad range of physiological conditions (e.g., pain sensation, blood pressure, and energy homeostasis),15,16 and some endogenous peptides in body fluids or tissues could be biomarkers with higher clinical sensitivity and specificity.17,18 With the development of modern analytical technologies, mass spectrometry (MS) has become a powerful tool for the inspection of peptide biomarkers, as it can provide direct and intrinsic information on the peptides and screen multiple peptides simultaneously.19,20 However, direct analysis of peptides extracted from biological samples by MS is a great challenge, owing to the low concentrations of the target peptides, strong interference, and suppression of high-abundance biomolecules as well as other impurities (e.g., salts and surfactants). A number of nanostructures for the capture and purification of low-concentration peptides, such as silanized silica microspheres, polymer reverse micelles, metal–organic frameworks, and hybrid materials,21−25 have been explored to capture and purify the low-concentration peptides from biosamples. Although these materials have shown interesting performance, they are compromised by their complex fabrication strategies, limited affinity sites, poor stability, and poor recyclability.
Mesoporous carbon nanostructures have a high potential to enrich low-concentration peptides due to their chemical stability, high surface area, unique hydrophobic interactions and similar pore size to peptides.26 On the other hand, further optimization of the materials’ structures and integration with other functional composites would provide new opportunities to improve the capture efficiency and facilitate the separation process. Recently, functionalized magnetic nanostructures have become extremely favorable materials for the convenient and fast transport and separation of the targets, owing to their chemical durability, unique magnetic response, high separation efficiency, and convenient operation.27−32 Therefore, the design and synthesis of magnetic affinity material combining the merits of its magnetic property and the special affinity of mesoporous carbon is of particular interest in proteomic applications requiring fast and convenient enrichment of low-abundance peptides. Hard and soft template-based synthetic methods are always used to prepare the mesoporous or hollow carbon nanostructures first and then load the precursors of magnetic materials to further produce embedded magnetic nanoparticles.3,33 Nonetheless, it is well-known that complicated, high-cost, and time-consuming multistep procedures are required to prepare mesoporous or hollow carbon nanostructures via template-based methods, not to mention the additional step to introduce the magnetic nanoparticles into mesoporous carbon nanostructures. As an alternative, herein we designed and constructed a novel magnetic, hollow, and mesoporous carbon nanostructure (denoted as MHM microspheres) via a facile method combining biomimetic formation of a polymer shell, carbonization of an organic shell, and sacrifice of an inorganic core, and we also demonstrated that the MHM microspheres are effective affinity materials for rapid enrichment and separation of low-concentration peptides.
Experimental Section
Materials
Ferric chloride (FeCl3·6H2O), ethylene glycol (EG), trisodium citrate (H3Cit), tris(hydroxymethyl)aminomethane hydrochloride (Tris-HCl), ethanol (EtOH), sodium acetate (NaAc), ammonium bicarbonate (NH4HCO3), acetonitrile (ACN), trifluoroacetic acid (TFA), hexadecyltrimethylammonium bromide (CTAB), and ammonium hydroxide (NH3·H2O) were obtained from Alfa Aesar. Dopamine hydrochloride (DA), tetraethyl orthosilicate (TEOS), 2,5-dihydroxybenzoic acid (2,5-DHB), angiotensin II, myoglobin from equine heart (MYO), cytochrome C (Cty-C), bovine serum albumin (BSA), and trypsin (from bovine pancreas, l-1-tosylamide-2-phenylethyl chloromethyl ketone-treated) were purchased from Sigma-Aldrich (St. Louis, MO, USA). All the chemical agents were used without further purification. Human urine samples were collected from a healthy volunteer. All procedures involving samples obtained from human subjects were approved by the Institutional Review Board (IRB) of The Penn State University.
Preparation of Fe3O4 and Fe3O4@PDA Microspheres
The magnetic Fe3O4 particles were prepared according to a reported solvothermal approach with minor modification.34 Typically, FeCl3·6H2O (0.81 g) and trisodium citrate (0.20 g) were first dissolved in ethylene glycol (20 mL). Then, NaAc (1.20 g) was added, and the mixture was vigorously stirred to form a transparent solution. Afterward, the solution was transferred to a 50 mL Teflon-lined stainless-steel autoclave. The autoclave was sealed and heated at 200 °C and maintained for 8 h, and then it was allowed to cool to room temperature. The products were washed with ethanol and deionized water several times and dried at 60 °C for 12 h.
For preparation of Fe3O4@PDA (PDA = polydopamine) core–shell microspheres, the as-synthesized Fe3O4 particles (25 mg) were fully dispersed in 25 mL of 20 mM tris-HCl (pH = 8.0) by ultrasonication for 30 min. DA (50 mg) was dissolved in 25 mL of deionized water. The dopamine solution was quickly injected into the Fe3O4 dispersion under continuous magnetic stirring at room temperature for 8 h. After that, the products were collected, separated by sorting using a magnet, and then washed several times with deionized water. For preparation of pure PDA microspheres, 20 mg of DA dissolved into 10 mL of 20 mM tris-HCl (pH = 8.0), the mixture were stirred for 12 h at room temperature. After that, the PDA microspheres were collected by centrifugation at 8000 rpm. The precipitates were washed with water and ethanol several times and then dried at 60 °C for 12 h.
Preparation of MHM Microspheres
MHM microspheres were obtained by carbonizing the Fe3O4@PDA core–shell microspheres at 700 °C for 1 h in Ar at a rate of 5 °C min–1. For comparison, Fe3O4@PDA core–shell microspheres were also calcined at 550 °C for 1 h in Ar at a rate of 5 °C min–1, and the products are denoted as Fe3O4@C. The pure PDA microspheres were also carbonized at 700 °C for 1 h in Ar at a rate of 5 °C min–1 to obtain the pure carbon microspheres. For comparison, magnetic mesoporous silica particles were also prepared according to the previous report with slight modification.35 Typically, 50 mg of the as-prepared Fe3O4 particles was fully dispersed in a solution containing 0.5 g of CTAB and 200 mL of deionized water. Then, 5 mL of NaOH solution (0.1 M) and 195 mL of deionized water were added to the solution, after which it was mechanically stirred for 30 min at 60 °C. Next, 2.5 mL of a TEOS/ethanol solution (v/v = 1/4) were injected into the homogeneous solution, with intense agitation applied. The mixture obtained was heated at 60 °C for 12 h. The resulting particles were separated using the magnet and then washed with deionized water and ethanol. Finally, the CTAB template was removed by a solvent extraction method by using NH4NO3/ethanol solution (6 g L–1) refluxed at 60 °C for 10 h. This extraction process was repeated twice. The products were denoted as Fe3O4@mSiO2.
Materials Characterization
Scanning electron microscopy (SEM) images were performed on a field emission scanning electron microscope (FESEM; NanoSEM 630, NOVA) equipped with an energy-dispersive X-ray analysis system (EDXA). Transmission electron microscopy (TEM) and high-resolution TEM (HRTEM) images were taken with a JEOL-2010 microscope at the accelerating voltage of 200 kV. Powder X-ray diffraction (XRD) patterns were collected on a PANalytical Empyrean X-ray powder diffractometer (Cu Kα radiation, 45 kV, 40 mA) with the detection range from 5 to 80 degree. Raman spectra were recorded on a WITec Confocal Raman instrument with a 514 nm laser wavelength. Zetal potential of the particles were examined using a Malvern Zetasizer ZS. Fourier transform infrared (FT-IR) spectra were determined on a Bruker Vertex V70 FTIR spectrometer over a potassium bromide pellet and then scanned from 400 to 4000 cm–1 at a resolution of 6 cm–1. Nitrogen adsorption isotherms were measured at liquid nitrogen temperature (77 K) with a Micromeritcs ASAP 2020 apparatus. The specific surface area was determined by the Brunauer–Emmett–Teller (BET) method. The total pore volume was evaluated by the t-plot method, and pore size distribution was analyzed with the supplied BJH software package from the adsorption branches of the isotherms. Magnetization measurement was carried out with a superconducting quantum interface device (SQUID) magnetometer at 300 K.
Preparation of Protein Digests
Proteins (1 mg of Cyt-C or BSA) were dissolved in 1 mL of 50 mM NH4HCO3 solution, and then trypsin was added into the solution with a molar ratio of 50:1 (protein/trypsin) at 37 °C for 16 h. Finally, the obtained tryptic digests were diluted to the target concentrations and stored at −20 °C refrigerator before use.
Low-Concentration Peptide Enrichment
A solution of a standard peptide (angiotensin II) was first used to investigate the possibility of the MHM affinity microspheres for enrichment of trace peptides. 500 μL of angiotensin II solution (2.5 nM) was mixed with 2.5 μL of 20 mg mL–1 well-dispersed MHM microsphere suspension and then shaken for 5 min. Subsequently, the particles trapped target peptides were collected and isolated from the mixture using a permanent magnet. After that, the enriched peptides were eluted with 5 μL of 0.5% TFA and 80% ACN solution, and the supernatant was collected for MS detection after magnetic separation.
Protein digests were diluted to 2.5 nM before enrichment. 500 μL of protein digest was mixed with 2.5 μL of 20 mg mL–1 well-dispersed MHM microsphere suspension and then shaken for 5 min. Subsequently, the particles with captured target peptides were collected and isolated from the mixture with the help of a permanent magnet. After that, the enriched peptides were eluted with 5 μL of 0.5% TFA and 80% ACN solution, and the supernatant was collected for MS detection after magnetic separation. For comparison, a commercial ZipTipC18 pipet tip and homemade Fe3O4@mSiO2 microspheres were also used to capture target peptides from the above model samples. The sample preparation of peptides prior to matrix-assisted laser desorption ionization time-of-flight mass spectrometry (MALDI-TOF MS) using ZipTipC18 pipet tips was according to the standard procedure provided by Millipore Corporation. The procedure of peptide enrichment using Fe3O4@mSiO2 was similar to that of MHM microspheres.
Enrichment of Peptides from Human Urine
Five microliters of 20 mg mL–1 well-dispersed MHM suspension was added into 1 mL of freshly collected urine and then shaken for 15 min. After that, the microspheres with captured targets were sorted by a magnet and washed with pure water (200 μL). Then the MHM affinity microspheres with captured peptides were eluted with 5 μL of 0.5% TFA and 80% ACN solution. After magnetic separation, the supernatant was collected for MS detection.
MALDI-TOF MS Analysis
One microliter of sample solution was mixed with 1 μL of matrix solution containing 20 mg/mL DHB (in 50% acetonitrile aqueous solution, v/v) and 1% H3PO4 aqueous solution (v/v) by pipetting, and 0.5 μL of mixture was deposited onto the MALDI target. MALDI-TOF MS analysis was performed on an AB SCIEX MALDI-TOF/TOF 5800 mass spectrometer (Foster City, CA, USA) in positive ion mode with 355 nm Nd:YAG laser, 200 Hz repetition rate, and 20 kV acceleration voltage. Fragment ion spectra were submitted to MASCOT (http://www.matrixscience.com/) for database search and identification of corresponding peptides using the following search parameters: Date base: SwissProt; Enzyme: Trypsin; Number of missed cleavages allowed: 1; Taxonomy: Mammals; Peptide tolerance: 0.5.
Results and Discussion
Synthesis and Characterization of MHM Microspheres
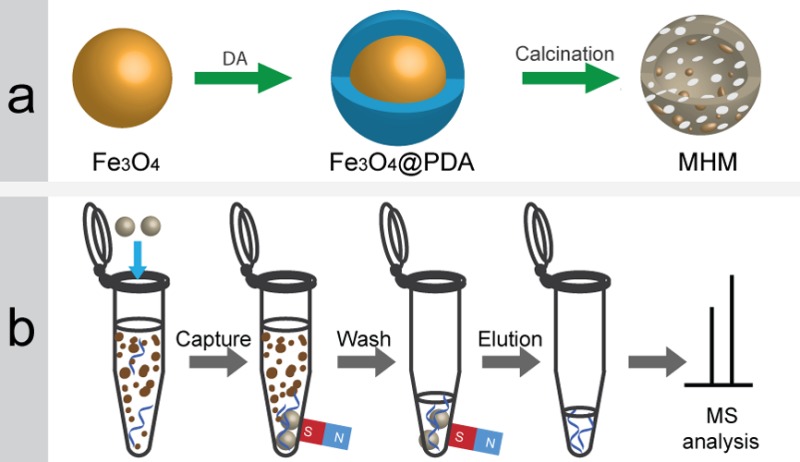
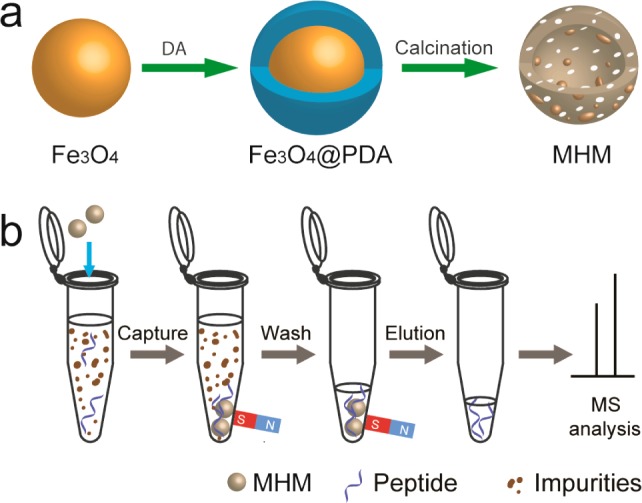
Scheme 1a illustrates the synthesis strategy of the MHM microspheres. First, well-dispersed Fe3O4 microspheres prepared by a solvothermal method were used as the sacrificial template and the magnetic precursor. Then, a biomimetic adhesive method was used to coat the magnetic core with a highly uniform polymeric shell by self-assembly of dopamine (DA) molecules on the surface of Fe3O4 in alkaline aqueous solution, leading to formation of the PDA shell as the carbon resource. After thermal treatment of the magnetic PDA microspheres (denoted as Fe3O4@PDA) at high temperature under the argon atmosphere, the magnetic, hollow and mesoporous carbon microspheres were prepared.
Scheme 1. Schematic Illustration of the (a) Synthesis Strategy for MHM Microspheres and (b) Rapid Capture and Magnetic Separation of Peptides for MS Analysis.
In the Supporting Information, Figure S1a,b shows the scanning electron microscopy (SEM) images of the prepared Fe3O4 microspheres with different magnification. The Fe3O4 microspheres have the relatively coarse surface and regular spherical shape with an average size of 200 nm, and they consist of numerous aggregative small Fe3O4 nanoparticles. After encapsulation with PDA, as shown in the Supporting Information, Figure S1c,d, the surface of t he resulting microspheres becomes smoother compared with the Fe3O4 microspheres, and the size of the microspheres increased to around 280 nm. As revealed by the TEM images, the obtained Fe3O4@PDA microspheres possess a well-defined core–shell structure, and the thickness of the PDA is ∼40 nm. As shown in Figure 1a,b, the MHM products still keep the sphere-like morphology after high-temperature carbonization under inert gas protection. However, the size of the MHM microspheres decreased slightly, and they present a porous and rough surface, which could be ascribed to the pyrolysis of PDA layer (Figure 1b). According to the SEM image of broken MHM microspheres, a large cavity is apparent, and the core particles have disappeared partially, indicating the hollow and mesoporous structure of MHM microspheres (Figure 1c). The TEM images further authenticate the mesoporous structure of the MHM microspheres and the disappearance of Fe3O4 cores (Figure 1d). Note that the hollow structure can only be observed indistinctly, due to the low contrast of carbon material and the nonuniform surface of the hollow shell.36,37 Interestingly, many nanoparticles with size of 10–30 nm were decorated on the shell of the MHM microspheres. According to the HRTEM image (Figure 1e), the pore wall is composed of graphitic carbon, because of the presence of the curved lattice fringes of graphitic (002) layers with an interplanar spacing of 0.35 nm. Furthermore, the lattice fringe spacing of the nanoparticles that decorate the hollow shell can also be clearly observed, and the lattice fringe spacing is ∼0.20 nm (Figure 1f), which agrees well with the (110) crystal plane of iron (JCPDS Card No. 06–0696). These results indicate that Fe nanoparticles were formed by conversion of Fe3O4 phase during the thermal treatment, leading to the fracturing and disappearance of magnetic cores.
Figure 1.
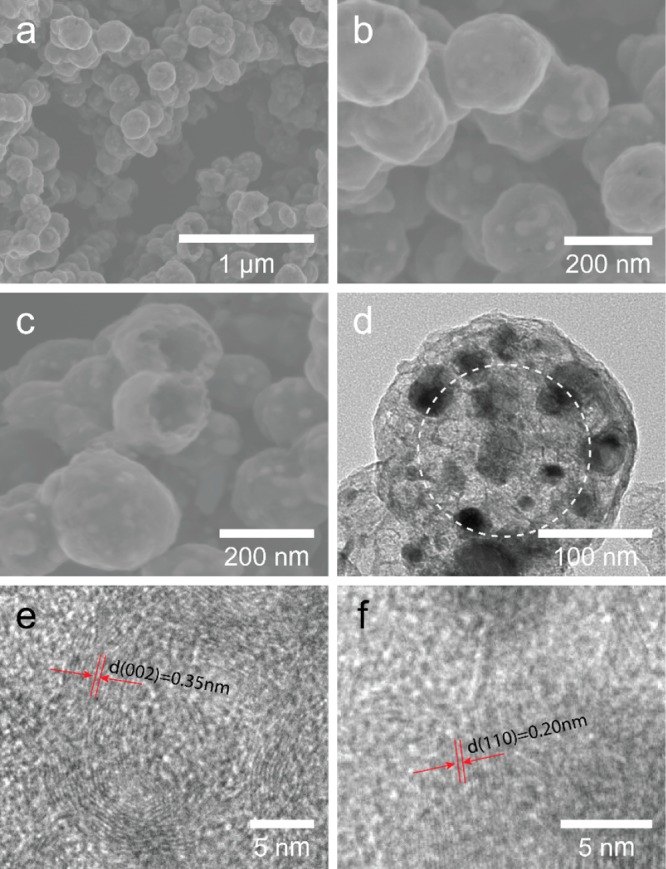
SEM images of MHM microspheres with different magnification (a, b) and some broken MHM microspheres (c); TEM image of a typical MHM microsphere (d), and the dotted circle represents the obscure hollow structure; HRTEM images of the pore (e) and nanoparticle (f) in the MHM microspheres.
The difference of elemental composition of prepared microspheres corresponds to the phase transformation, as a cause of the dramatic change in morphology, which was investigated by the energy-dispersive X-ray (EDX) analysis. Figure 2 shows the EDX spectra of the Fe3O4, Fe3O4@PDA, and MHM microspheres. Apparently, the Fe3O4 microspheres are mainly composed of the elements Fe and O. For the Fe3O4@PDA microspheres, besides all the elements observed in the Fe3O4 microspheres, the presence of the new element N and the increase of the relative intensity for element C demonstrate the successful addition of PDA shell. However, after thermal treatment at high temperature, the element Fe possessed the highest peak intensity, while the relative content of the elements C, N, and O dramatically decreased. These results indicate that the corresponding phase transformation has taken place during the thermal process.
Figure 2.
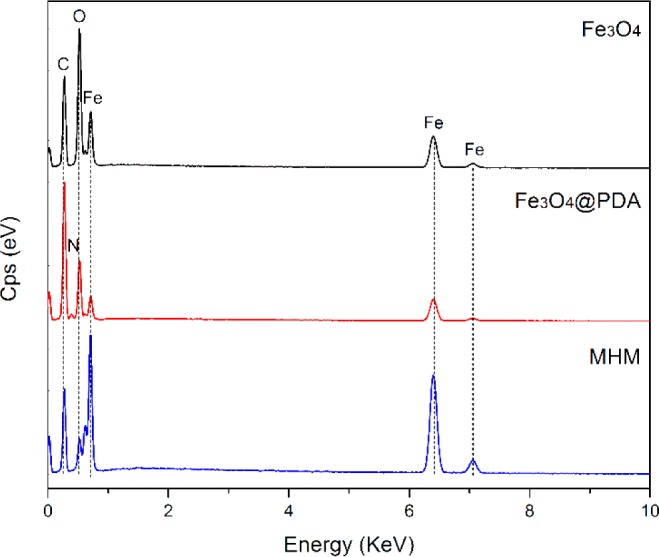
EDX spectra of the prepared Fe3O4, Fe3O4@PDA, and MHM microspheres.
Note that the temperature of the thermal treatment is critical for the formation of mesoporous and hollow structure for the MHM microspheres. As shown in the SEM image (Figure 3a), in contrast to the MHM microspheres, the resulting products (denoted as Fe3O4@C) after thermal treatment at 550 °C under inert gas protection still remain a relatively smooth surface when compared to their precursor microspheres. Furthermore, the well-defined core–shell structure can be obtained in the TEM images, the Fe3O4 cores still keep their original morphology, and no porous structure is apparent on the carbon shell (Figure 3b). Compared to the EDX spectrum of MHM microspheres, the abundance of element O in the EDX spectrum of Fe3O4@C (Figure 3c) also demonstrates that the integrity of Fe3O4 core is almost unaffected during the thermal treatment. To investigate the role of Fe3O4 core in formation of the mesoporous and hollow carbon nanostructures, a control experiment of thermal treatment of pure PDA microspheres without magnetic cores at 700 °C was conducted. Figure 3d shows the TEM image of the carbonized microspheres. It is apparent that only dense carbon microspheres could be obtained without incorporation of the magnetic cores. These results reveal that both the high temperature of the thermal treatment and the Fe3O4 cores play important roles in generation of magnetic hollow and mesoporous carbon microspheres.
Figure 3.
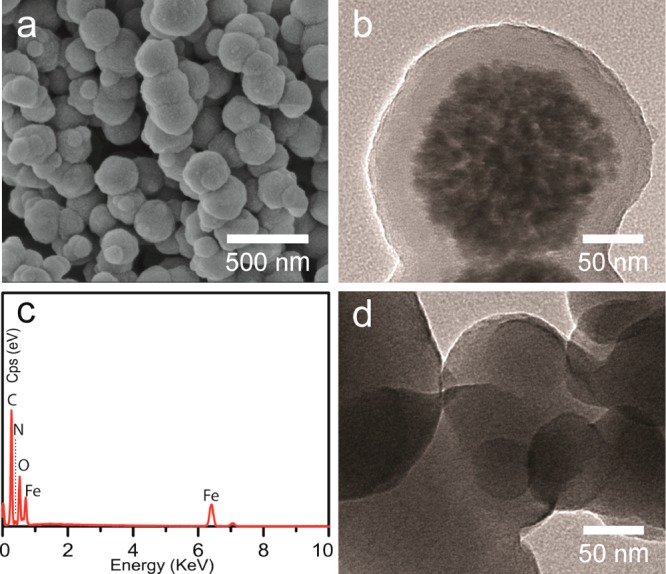
SEM image (a), TEM image (b), and EDX spectrum (c) of Fe3O4@C and TEM image of carbon microspheres (d).
To further demonstrate the phase transformation for formation of magnetic mesoporous carbon microspheres, the microspheres were characterized by powder X-ray diffraction (XRD). Figure 4a displays the powder XRD patterns of the Fe3O4, Fe3O4@PDA, and MHM products, and all the products show well-defined diffraction peaks. The XRD patterns of the Fe3O4 can be assigned to the characteristic diffraction peaks from magnetite (JCPDS Card No. 19–0629). Similar XRD patterns can also be observed in the results of Fe3O4@PDA microspheres, further revealing that the main magnetite phase of magnetic cores was not destroyed during the fabrication procedure. However, after thermal treatment at high temperature, the characteristic diffraction peaks from magnetite disappeared, while new strong diffraction peaks become present and could be assigned to the iron phase (JCPDS Card No. 06–0696), which is consistent with the previous TEM results.
Figure 4.
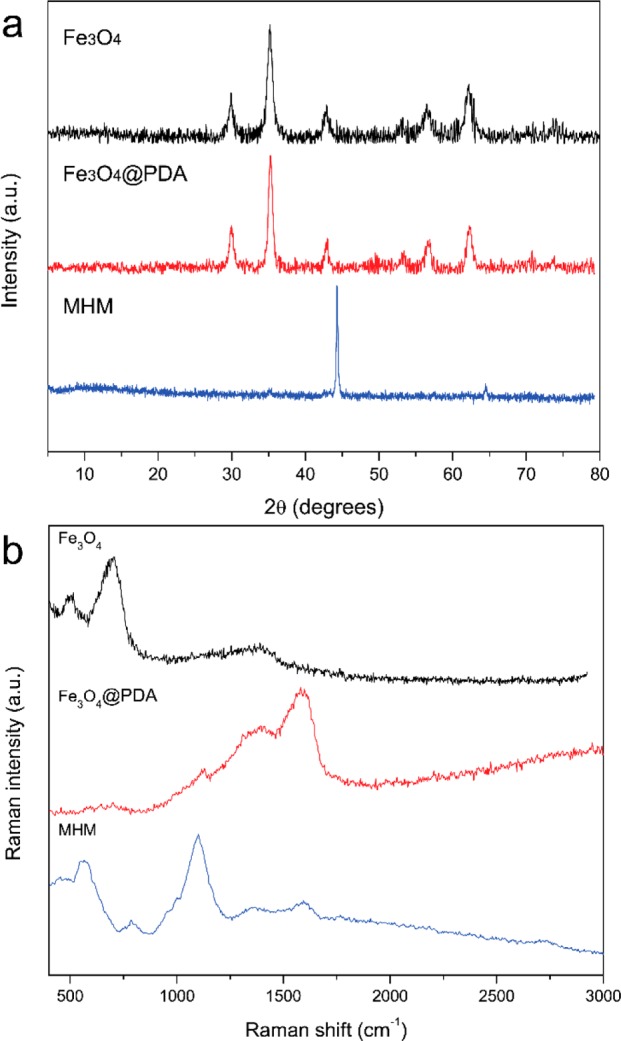
XRD patterns (a) and Raman spectra (b) of Fe3O4, Fe3O4@PDA, and MHM microspheres.
The nature of the composition and interface changes of the samples was also investigated by Raman spectroscopy, as shown in Figure 4b. The Raman spectrum of bare magnetic cores shows two strong bands around 489 and 681 cm–1, which correspond to the T2g and A1g modes of symmetry, which indicate the presence of Fe3O4.38,39 In comparison to the Fe3O4 microspheres, two new broad characteristic bands around 1355 and 1577 cm–1 are present in the Raman spectrum of Fe3O4@PDA microspheres, which are attributed to the deformation of the catechol group in the PDA shell.40 After thermal treatment, the Raman spectrum of the microspheres is greatly changed, due to the loss of PDA shell and generation of new carbon species. In particular, the Raman spectrum of MHM microspheres shows two typical peaks between 1200 and 1800 cm–1. The strong peak at around 1595 cm–1 could be assigned to G-bands of the characteristic ordered graphitic-like carbon, while the other peak of D-band at around 1346 cm–1 could be ascribed to the presence of defects within the hexagonal graphitic structure. Notably, the G-band shifted to higher wavenumbers, compared with the spectra of pure graphite crystals, because of the presence of some structural imperfections of the carbon.41 In addition, a weak characteristic peak can also be observed around 2716 cm–1, which could be attributed to the two-dimensional mode of graphitic-like carbon. The above results demonstrate the formation of graphitic carbon, which agrees well with the TEM observation.
Surface properties of prepared microspheres were characterized using the zeta-potential analysis (Figure 5a). The prepared Fe3O4 appears to show a positive zeta-potential value (7.59 ± 0.34 mV). However, after coating of PDA shell, the microspheres present a negative zeta potential of −34.73 ± 0.74 mV, indicating formation of PDA layer on the Fe3O4. The negative zeta-potential value of the Fe3O4@PDA microspheres should be assigned to the deprotonation of the phenolic group on the PDA shells.42 After carbonization, the zeta-potential value of MHM microspheres increased to −17.70 ± 0.66 mV, implying the surface transformation of the prepared microspheres. Furthermore, FT-IR spectra were also recorded to analyze the surface property and manifest the transformation of prepared microspheres. As shown in Figure 5b, the characteristic absorption peak at ∼590 cm–1 in Fe3O4 microspheres can be assigned to the stretching vibration of Fe–O from the Fe3O4. After coating of PDA shell, besides the absorption band of Fe–O bond, the presence of new absorption bands between 1800 and 1000 cm–1 evidence the successful modification of the magnetic core. The characteristic absorption peaks at 1622 and 1289 cm–1 can be attributed to the stretching vibration of the aromatic rings and the C–O stretching of phenol compounds, respectively, while the enhanced absorption bands at 3374 and 3243 cm–1 can be assigned to the stretching vibration of O–H and N–H.43−45 After carbonization, most of the characteristic peaks of the organic groups disappeared, and the absorption bands of Fe–O stretching vibration dramatically decreased. These results further demonstrate the carbonization of PDA and the dramatic transformation of magnetic core under high temperature.
Figure 5.
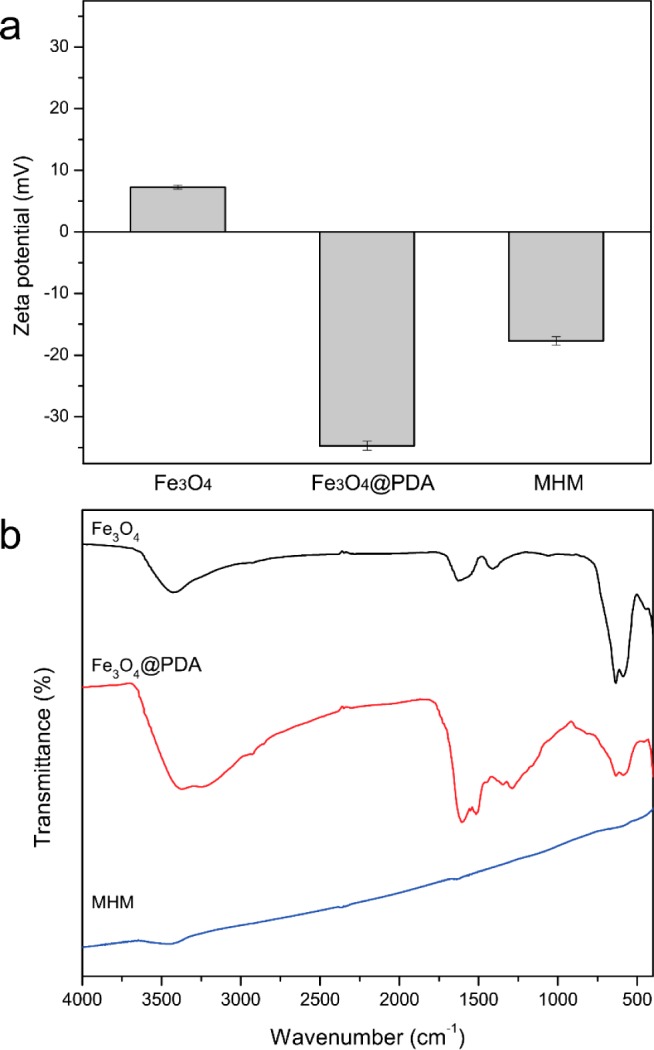
Zeta potentials (a) and FTIR spectra (b) of Fe3O4, Fe3O4@PDA, and MHM microspheres.
The surface area and porous structure of the MHM microspheres was characterized by N2-sorption measurement at 77 K. As displayed in Figure 6a, the adsorption/desorption isotherm of the MHM microspheres possesses type IV curve with a distinct hysteresis loop at relatively high P/P0 according to the IUPAC classification,46 suggesting a mesoporous structure. The average BET specific surface area, the average pore diameter, and the total pore volume of MHM microspheres were calculated to be 48.8 m2 g–1, 9.2 nm, and 0.11 cm3g–1, respectively. The pore-size distribution derived from the adsorption curve in Figure 6a using the Barrett–Joyner–Halenda (BJH) method is shown in the inset. As is apparent, besides a relatively narrow and high peak in the mesoporous range around 2.0 nm, a broad band range from 5 to 50 nm was also present in the MHM microspheres. The distribution of multiple pore sizes agrees well with the previous TEM results, which is possibly attributable to the cavity and interspace produced by corrosion of Fe3O4 cores and graphitization of amorphous carbon catalyzed by reduced Fe metal during the high-temperature thermal treatment.47 Note that the unique porous structure of the affinity microspheres would promote their performance in the following application of enriching target biomolecules, due to their high surface areas and pure affinity surface. More importantly, because of their hollow structure, the affinity carbon shells of the MHM affinity microspheres have numerous relatively large but shallow open pores, which would facilitate the mass transport and diffusion of target biomolecules. Therefore, the targets can not only be effectively adsorbed into the affinity shell, but also be rapidly released and diffused out of the shell in the elution step.48−50
Figure 6.
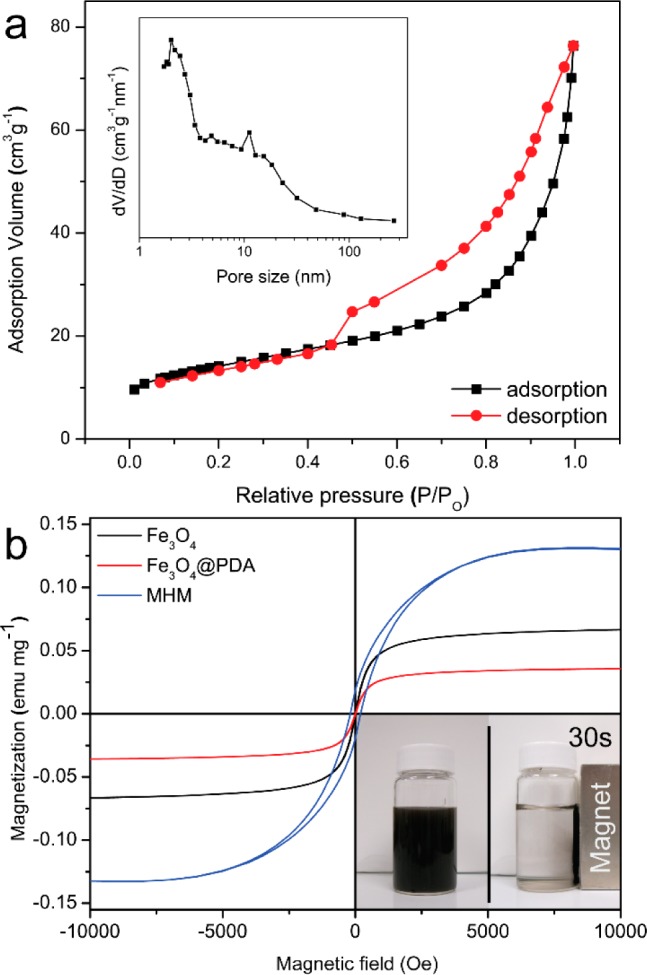
N2 adsorption–desorption isotherm and pore size distribution (inset) of the MHM microspheres (a); room-temperature magnetization curves (b) of Fe3O4, Fe3O4@PDA, and MHM microspheres, and inset shows an example of the magnetic response of MHM microspheres.
The magnetism of nanostructures would contribute to the fast and convenient separation of nanostructures via an external magnetic field, thereby being free of tedious and time-consuming centrifugation in practical applications. As shown in Figure 6b, the magnetic hysteresis curves of the MHM microspheres were recorded at 300 K via a SQUID magnetometer. The Fe3O4 and Fe3O4@PDA microspheres show relative superparamagnetism with saturation magnetization values of 66.6 and 35.7 emu g–1, respectively. Interestingly, MHM have stronger magnetism than their precursor particles, with a saturation magnetization value of 130.2 emu g–1, which can be ascribed to the weight loss of nonmagnetic species because of the reduction of the Fe3O4 core to iron nanoparticles. Figure 6b inset shows an example of drawing the MHM microspheres by a magnet. As expected, in the presence of the magnet, the well-dispersed MHM microspheres can be rapidly separated from the mixture in less than 1 min. The above results demonstrate that the MHM affinity microspheres have a good magnetic response that would contribute to their facile and rapid separation in practical applications.
Enrichment of Low-Concentration Peptides Using MHM Microspheres
By taking advantage of their unique nanostructure, distinct hydrophobicity, and rapid magnetic response, the MHM microspheres can be applied to extract low-concentration peptides from complex biological samples. Scheme 1b displays the typical enrichment procedure. The MHM microspheres were mixed in the sample solution for interaction with the peptides. Then, the microspheres with captured peptide were easily isolated by a magnet. After further purification and elution, the enriched peptides were ready for MS analysis.
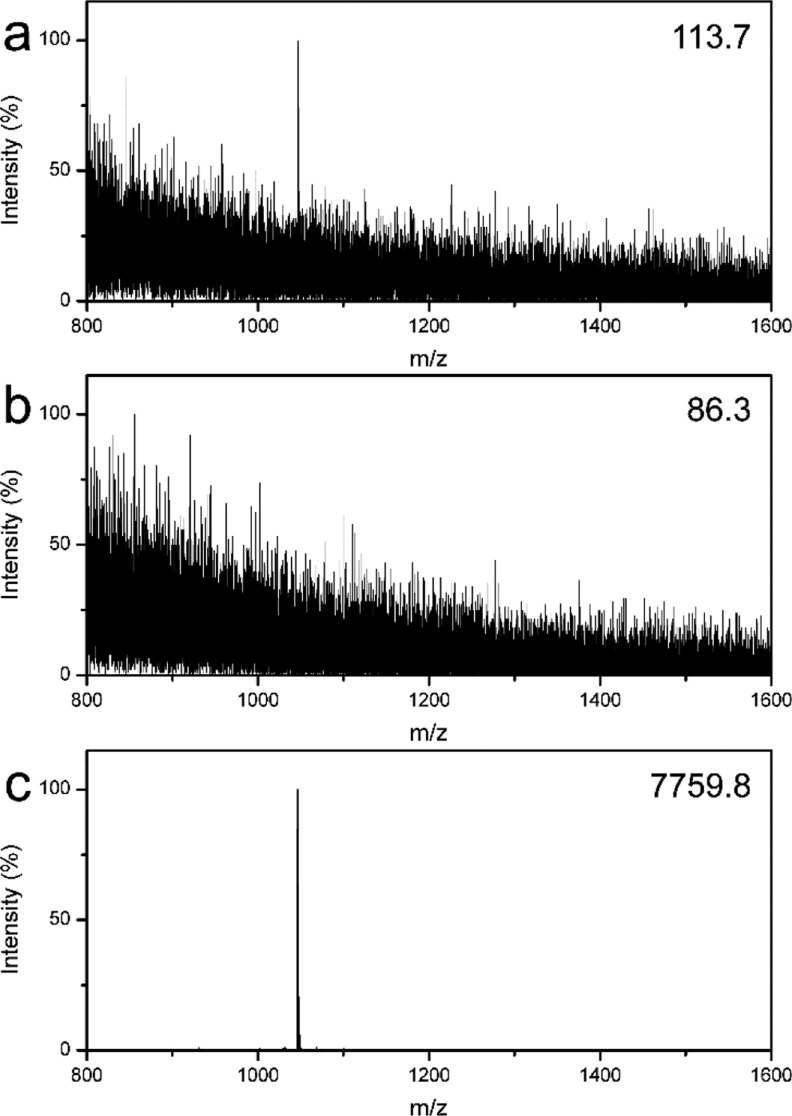
To investigate the possibility of the MHM affinity microspheres for enrichment of low-concentration peptides, a solution of diluted standard peptides, angiotensin II (molecule weight: 1046.2 Da, sequence: DRVYIHPF, concentration: 2.5 nM), was used as a model sample. As displayed in Figure 7a, the target peptides can be detected by MALDI-TOF MS; however, the intensity and signal-to-noise ratio (S/N) are very low, due to the extremely low concentration of target peptides. After treatment using the MHM affinity microspheres via above-mentioned procedure, the supernatant was also analyzed using MS. It is of particular interest that no clear peptide signal can be detected in the supernatant (Figure 7b), revealing that the target peptides were captured by the affinity microspheres. Figure 7c shows the MS of the enriched peptides. As expected, the target peptides were detected with strong intensity and high S/N. These results demonstrate that the MHM affinity microspheres can effectively enrich low-concentration peptides.
Figure 7.
MALDI-TOF mass spectra of 2.5 nM angiotensin II solution: direct detection (a), the supernatant (b), and the eluent (c) after enrichment using MHM affinity microspheres, respectively. The number in the top right corner is the highest peak intensity.
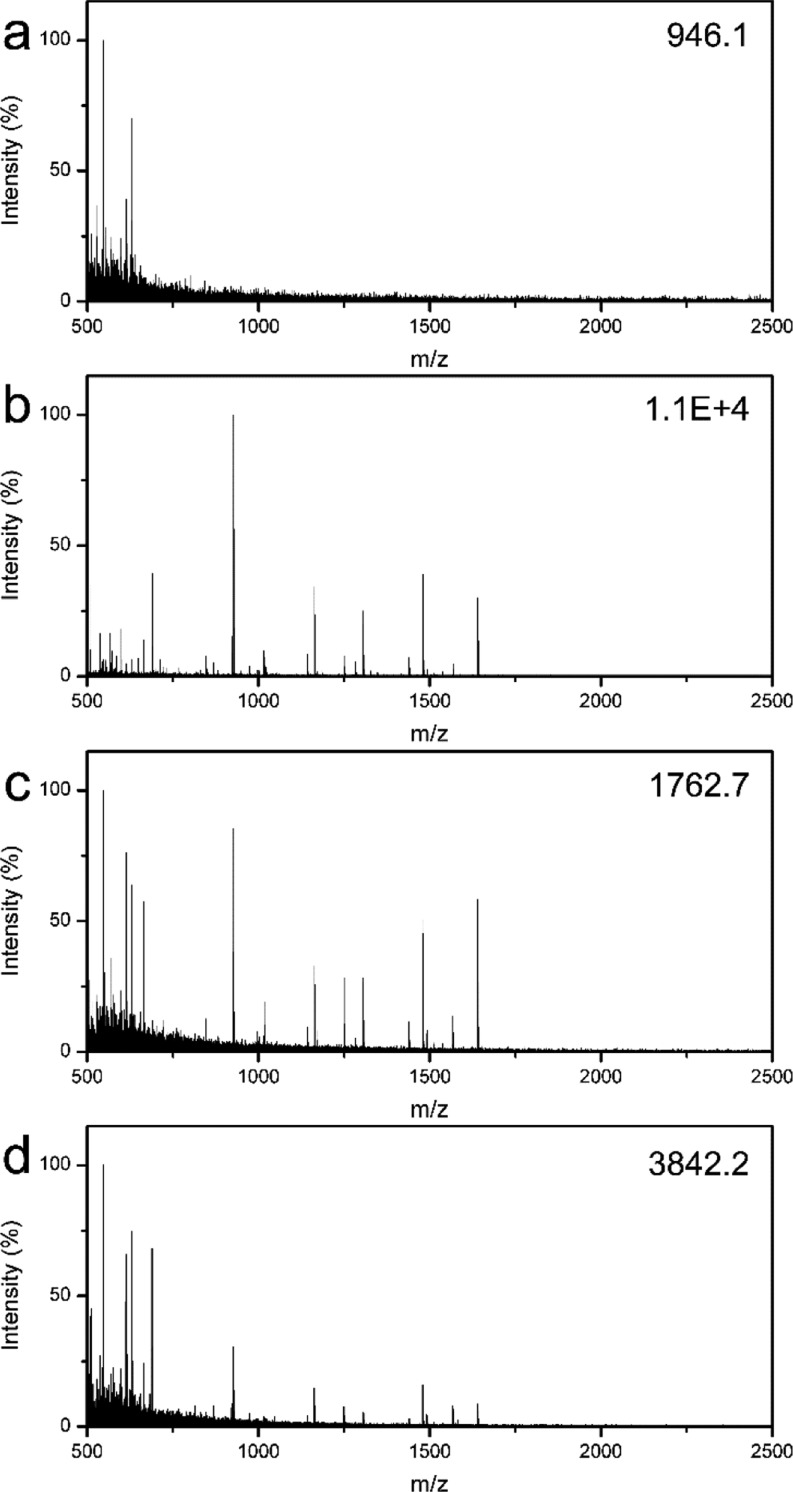
To further evaluate the effectiveness of the MHM affinity microspheres for the capture of various peptides from the low-concentration and complex peptide samples, protein digestions of BSA and Cyt-c were used. Figure 8a displays the MS of direct analysis of diluted BSA tryptic digest (2.5 nM). Because of the extremely low concentration of the peptide mixture and possible interference from salts, only three peptides from BSA can be detected, and the intensity and S/N are very low. Notably, it is hard to identify the target protein in proteomics via peptide mass fingerprint (PMF)-based online database search according to the present MS of poor quality. However, after enrichment using the MHM affinity microspheres, many peptides with high intensity and S/N can be observed with a clean background (Figure 8b), indicating most of the peptides were enriched and purified. More importantly, the BSA protein can be successfully identified based on the high-quality MS, and 34 peptides with sequence coverage of 37% can be effectively matched (Supporting Information, Table S1). This result is much better than that of the magnetic mesoporous silica counterpart in previous reports.51 For further comparison, the commercial product (ZipTip C18 pipet tip) and homemade mesoporous magnetic silica were also applied to the same sample. As shown in Figure 8c,d, although the ZipTip C18 pipet tip and mesoporous magnetic silica are effective to enrich peptides from the peptide mixtures, fewer target peptides can be detected, and the intensity is relatively low. Furthermore, only 16 peptides with sequence coverage of 20% and 19 peptides with sequence coverage of 22% can be identified via PMF-based online database search for ZipTip C18 pipet tip and mesoporous magnetic silica, respectively (Supporting Information, Table S1). A similar phenomenon can also be observed in MS results collected from the enrichment of low-concentration Cyt-C digests (Supporting Information, Figure S2), indicating the universality of the MHM affinity microspheres for efficient enrichment of low-concentration peptides. Supporting Information, Tables S1 and S2 list the detailed information on the identified peptides from BSA and Cyt-c digests by MALDI-TOF MS analysis, respectively. The above results clearly demonstrate the advantages of MHM affinity microspheres for enrichment of low-concentration peptides from a complex peptide mixture.
Figure 8.
MALDI-TOF mass spectra of the diluted BSA digest (2.5 nM): direct detection (a) and after enrichment with the MHM affinity microspheres (b), the magnetic mesoporous silica microspheres (c), and the ZipTip C18 pipet tip (d), respectively. The number in the top right corner is the highest peak intensity.
Because of the high stability of their carbon shells and the fast magnetic separation possible because of their magnetic cores, the affinity microspheres can be regenerated by washing with buffer several times after use. Highly diluted BSA digests (2.5 nM) were used to investigate the reusability of the affinity microspheres. Figure 9a,b displays the typical mass spectra of the low-concentration BSA digests after enrichment using the regenerated affinity microspheres after three and five times, respectively. Notably, many peptides with high intensity and clean background can be detected, indicating the excellent performance of the reused affinity microspheres. Furthermore, the same conclusion can also be drawn from the PMF-based online database search. As shown in Figure 9c, the model protein can still be effectively identified with high peptide matched number and sequence coverage, even after being reused five times, verifying the excellent reusability of the MHM affinity microspheres.
Figure 9.
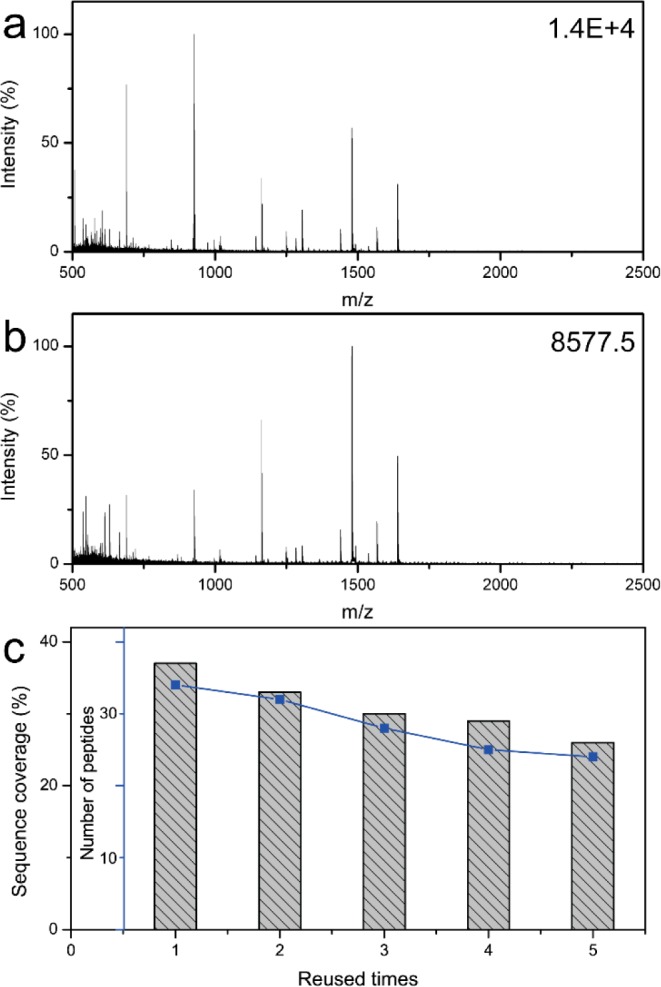
MALDI-TOF mass spectra of the diluted BSA digest after enrichment with the recycled MHM affinity microspheres used three (a) and five (b) times. The number of matched peptides and sequence coverage of the diluted BSA digest after enrichment using the recycled MHM affinity microspheres (c).
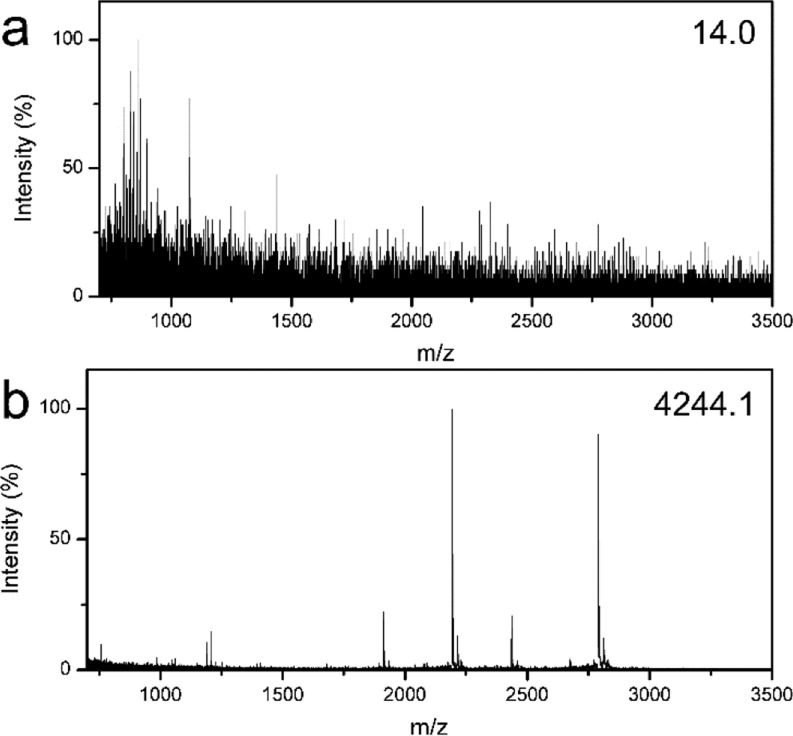
Human urine is a common biological sample in clinical diagnostics, and it contains various informative endogenous peptides correlating well with the pathophysiology, which are potential biomarkers to diagnose and monitor many diseases.52,53 However, it is still a great challenge to detect these peptides directly by MS, because the urine contains a high salt concentration and other solid residuals that would severely interfere with MS analysis. Thus, it is imperative to enrich the target peptides before MS analysis. Herein, human urine was used to evaluate the effectiveness of the MHM affinity microspheres for enrichment of peptides from the complex biological sample. Figure 10a presents the mass spectrum of direct analysis of a urine sample, indicating no effective peptide peaks can be detected. However, as shown in Figure 10b and Supporting Information, Table S3, after enrichment and purification using the MHM affinity microspheres, many peptides could be detected with strong intensity and clean background. These results further prove the capability of the MHM affinity microspheres for enrichment of target peptides from complex biological samples.
Figure 10.
MALDI-TOF mass spectra of human urine: direct detection (a) and after enrichment (b) with the MHM affinity microspheres.
Conclusion
In summary, magnetic hollow and mesoporous carbon microspheres were prepared via a facile method, and they have been applied for the rapid enrichment and separation of low-concentration peptides. The MHM affinity microspheres possess the unique nanostructure, high surface area, magnetic properties as well as characteristic affinity, thereby having high potential in rapid extraction and enrichment of peptides from the complex biological samples. The effectiveness of these MHM affinity microspheres has been evaluated with standard peptides, complex protein digests, and real biological samples, and they show better performance than the commercial product and conventional polypeptide enrichment material mesoporous magnetic silica. In addition, MHM affinity microspheres can be reused several times. Therefore, this work may provide a promising tool for high-throughput discovery of biomarkers from biological samples for disease diagnosis in biomedical applications.
Acknowledgments
This work was supported by the National Cancer Institute of the National Institutes of Health under Award No. DP2CA174508. The content is solely the responsibility of the authors and does not necessarily represent the official views of the National Institutes of Health.
Supporting Information Available
SEM and TEM images; tabulated data; mass spectra. This material is available free of charge via the Internet at http://pubs.acs.org.
The authors declare no competing financial interest.
Funding Statement
National Institutes of Health, United States
Supplementary Material
References
- Qiu L.; Liu J. Z.; Chang S. L. Y.; Wu Y.; Li D. Biomimetic Superelastic Graphene-Based Cellular Monoliths. Nat. Commun. 2012, 3, 1241. [DOI] [PubMed] [Google Scholar]
- Cargnello M.; Grzelczak M.; Rodríguez-González B.; Syrgiannis Z.; Bakhmutsky K.; La Parola V.; Liz-Marzán L. M.; Gorte R. J.; Prato M.; Fornasiero P. Multi-Walled Carbon Nanotubes Drive the Activity of Metal@Oxide Core–Shell Catalysts in Modular Nanocomposites. J. Am. Chem. Soc. 2012, 134, 11760–11766. [DOI] [PubMed] [Google Scholar]
- Zhu M.; Diao G. Review on the Progress in Synthesis and Application of Magnetic Carbon Nanocomposites. Nanoscale 2011, 3, 2748–2767. [DOI] [PubMed] [Google Scholar]
- Merlet C.; Rotenberg B.; Madden P. A.; Taberna P.-L.; Simon P.; Gogotsi Y.; Salanne M. On the Molecular Origin of Supercapacitance in Nanoporous Carbon Electrodes. Nat. Mater. 2012, 11, 306–310. [DOI] [PubMed] [Google Scholar]
- Ganesan R.; Lee J. S. Tungsten Carbide Microspheres as a Noble-Metal-Economic Electrocatalyst for Methanol Oxidation. Angew. Chem., Int. Ed. 2005, 44, 6557–6560. [DOI] [PubMed] [Google Scholar]
- Zhang S.; Chen L.; Zhou S.; Zhao D.; Wu L. Facile Synthesis of Hierarchically Ordered Porous Carbon Via in Situ Self-Assembly of Colloidal Polymer and Silica Spheres and Its Use as a Catalyst Support. Chem. Mater. 2010, 22, 3433–3440. [Google Scholar]
- Cheng G.; Wang Z.-G.; Liu Y.-L.; Zhang J.-L.; Sun D.-H.; Ni J.-Z. A Graphene-Based Multifunctional Affinity Probe for Selective Capture and Sequential Identification of Different Biomarkers from Biosamples. Chem. Commun. 2012, 48, 10240–10242. [DOI] [PubMed] [Google Scholar]
- Liu Z.; Robinson J. T.; Tabakman S. M.; Yang K.; Dai H. Carbon Materials for Drug Delivery & Cancer Therapy. Mater. Today 2011, 14, 316–323. [Google Scholar]
- Sahoo N. G.; Bao H.; Pan Y.; Pal M.; Kakran M.; Cheng H. K. F.; Li L.; Tan L. P. Functionalized Carbon Nanomaterials as Nanocarriers for Loading and Delivery of a Poorly Water-Soluble Anticancer Drug: A Comparative Study. Chem. Commun. 2011, 47, 5235–5237. [DOI] [PubMed] [Google Scholar]
- Feng L.; Wu L.; Qu X. New Horizons for Diagnostics and Therapeutic Applications of Graphene and Graphene Oxide. Adv. Mater. 2012, 25, 168–186. [DOI] [PubMed] [Google Scholar]
- Cheng G.; Liu Y.-L.; Wang Z.-G.; Zhang J.-L.; Sun D.-H.; Ni J.-Z. The GO/RGO-Fe3O4 Composites with Good Water-Dispersibility and Fast Magnetic Response for Effective Immobilization and Enrichment of Biomolecules. J. Mater. Chem. 2012, 22, 21998–22004. [Google Scholar]
- Li H.; Zhang Y.; Wang L.; Tian J.; Sun X. Nucleic Acid Detection Using Carbon Nanoparticles as a Fluorescent Sensing Platform. Chem. Commun. 2011, 47, 961–963. [DOI] [PubMed] [Google Scholar]
- Ray S.; Reddy P. J.; Jain R.; Gollapalli K.; Moiyadi A.; Srivastava S. Proteomic Technologies for the Identification of Disease Biomarkers in Serum: Advances and Challenges Ahead. Proteomics 2011, 11, 2139–2161. [DOI] [PubMed] [Google Scholar]
- Beretta L. Proteomics from the Clinical Perspective: Many Hopes and Much Debate. Nat. Methods 2007, 4, 785–786. [DOI] [PubMed] [Google Scholar]
- Felipe C. D.; Herrero J. F.; O’Brien J. A.; Palmer J. A.; Doyle C. A.; Smith A. J. H.; Laird J. M. A.; Belmonte C.; Cervero F.; Hunt S. P. Altered Nociception, Analgesia and Aggression in Mice Lacking the Receptor for Substance P. Nature 1998, 392, 394–397. [DOI] [PubMed] [Google Scholar]
- Coll A. P.; Farooqi I. S.; O’Rahilly S. The Hormonal Control of Food Intake. Cell 2007, 129, 251–262. [DOI] [PMC free article] [PubMed] [Google Scholar]
- Doerr A. Phosphorylation and the Cell Cycle. Nat. Methods 2008, 5, 858–859. [Google Scholar]
- Swami M. Proteomics: A Discovery Strategy for Novel Cancer Biomarkers. Nat. Rev. Cancer 2010, 10, 597. [DOI] [PubMed] [Google Scholar]
- Sauer S.; Kliem M. Mass Spectrometry Tools for the Classification and Identification of Bacteria. Nat. Rev. Microbiol. 2010, 8, 74–82. [DOI] [PubMed] [Google Scholar]
- Yates J. R. III A Century of Mass Spectrometry: From Atoms to Proteomes. Nat. Methods 2011, 8, 633–637. [Google Scholar]
- Xiong H. M.; Guan X. Y.; Jin L. H.; Shen W. W.; Lu H. J.; Xia Y. Y. Surfactant-Free Synthesis of SnO2@PMMA and TiO2@PMMA Core–Shell Nanobeads Designed for Peptide/Protein Enrichment and MALDI-TOF MS Analysis. Angew. Chem., Int. Ed. 2008, 47, 4204–4207. [DOI] [PubMed] [Google Scholar]
- Chen H.; Xu X.; Yao N.; Deng C.; Yang P.; Zhang X. Facile Synthesis of C8-Functionalized Magnetic Silica Microspheres for Enrichment of Low-Concentration Peptides for Direct MALDI-TOF MS Analysis. Proteomics 2008, 8, 2778–2784. [DOI] [PubMed] [Google Scholar]
- Gu Z.-Y.; Chen Y.-J.; Jiang J.-Q.; Yan X.-P. Metal-Organic Frameworks for Efficient Enrichment of Peptides with Simultaneous Exclusion of Proteins from Complex Biological Samples. Chem. Commun. 2011, 47, 4787–4789. [DOI] [PubMed] [Google Scholar]
- Li Y.; Zhang X.; Deng C. Functionalized Magnetic Nanoparticles for Sample Preparation in Proteomics and Peptidomics Analysis. Chem. Soc. Rev. 2013, 42, 8517–8539. [DOI] [PubMed] [Google Scholar]
- Zhao M.; Deng C.; Zhang X. Synthesis of Polydopamine-Coated Magnetic Graphene for Cu2+ Immobilization and Application to the Enrichment of Low-Concentration Peptides for Mass Spectrometry Analysis. ACS Appl. Mater. Interfaces 2013, 5, 13104–13112. [DOI] [PubMed] [Google Scholar]
- Qin H.; Gao P.; Wang F.; Zhao L.; Zhu J.; Wang A.; Zhang T.; Wu R. a.; Zou H. Highly Efficient Extraction of Serum Peptides by Ordered Mesoporous Carbon. Angew. Chem., Int. Ed. 2011, 50, 12218–12221. [DOI] [PubMed] [Google Scholar]
- Landázuri N.; Tong S.; Suo J.; Joseph G.; Weiss D.; Sutcliffe D. J.; Giddens D. P.; Bao G.; Taylor W. R. Magnetic Targeting of Human Mesenchymal Stem Cells with Internalized Superparamagnetic Iron Oxide Nanoparticles. Small 2013, 9, 4017–4026. [DOI] [PubMed] [Google Scholar]
- Woo E.; Ponvel K. M.; Ahn I.-S.; Lee C.-H. Synthesis of Magnetic/Silica Nanoparticles with a Core of Magnetic Clusters and Their Application for the Immobilization of His-Tagged Enzymes. J. Mater. Chem. 2010, 20, 1511–1515. [Google Scholar]
- Liu Y.; Wang Y.; Zhou S.; Lou S.; Yuan L.; Gao T.; Wu X.; Shi X.; Wang K. Synthesis of High Saturation Magnetization Superparamagnetic Fe3O4 Hollow Microspheres for Swift Chromium Removal. ACS Appl. Mater. Interfaces 2012, 4, 4913–4920. [DOI] [PubMed] [Google Scholar]
- Dui J.; Zhu G.; Zhou S. Facile and Economical Synthesis of Large Hollow Ferrites and Their Applications in Adsorption for As(V) and Cr(Vi). ACS Appl. Mater. Interfaces 2013, 5, 10081–10089. [DOI] [PubMed] [Google Scholar]
- Cheng G.; Zhang J. L.; Liu Y. L.; Sun D. H.; Ni J. Z. Synthesis of Novel Fe3O4@SiO2@CeO2 Microspheres with Mesoporous Shell for Phosphopeptide Capturing and Labeling. Chem. Commun. 2011, 47, 5732–5734. [DOI] [PubMed] [Google Scholar]
- Cheng G.; Wang Z.-G.; Liu Y.-L.; Zhang J.-L.; Sun D.; Ni J. Magnetic Affinity Microspheres with Meso-/Macroporous Shell for Selective Enrichment and Fast Separation of Phosphorylated Biomolecules. ACS Appl. Mater. Interfaces 2013, 5, 3182–3190. [DOI] [PubMed] [Google Scholar]
- Wu Z.; Li W.; Webley P. A.; Zhao D. General and Controllable Synthesis of Novel Mesoporous Magnetic Iron Oxide@Carbon Encapsulates for Efficient Arsenic Removal. Adv. Mater. 2011, 24, 485–491. [DOI] [PubMed] [Google Scholar]
- Liu J.; Sun Z.; Deng Y.; Zou Y.; Li C.; Guo X.; Xiong L.; Gao Y.; Li F.; Zhao D. Highly Water-Dispersible Biocompatible Magnetite Particles with Low Cytotoxicity Stabilized by Citrate Groups. Angew. Chem., Int. Ed. 2009, 48, 5875–5879. [DOI] [PubMed] [Google Scholar]
- Cheng G.; Liu Y.-L.; Zhang J.-L.; Sun D.-H.; Ni J.-Z. Lanthanum Silicate Coated Magnetic Microspheres as a Promising Affinity Material for Phosphopeptide Enrichment and Identification. Anal. Bioanal. Chem. 2012, 404, 763–770. [DOI] [PubMed] [Google Scholar]
- Liu R.; Mahurin S. M.; Li C.; Unocic R. R.; Idrobo J. C.; Gao H.; Pennycook S. J.; Dai S. Dopamine as a Carbon Source: The Controlled Synthesis of Hollow Carbon Spheres and Yolk-Structured Carbon Nanocomposites. Angew. Chem., Int. Ed. 2011, 50, 6799–6802. [DOI] [PubMed] [Google Scholar]
- Cheng G.; Zhang J. L.; Liu Y. L.; Sun D. H.; Ni J. Z. Monodisperse RePO(4) (Re=Yb, Gd, Y) Hollow Microspheres Covered with Nanothorns as Affinity Probes for Selectively Capturing and Labeling Phosphopeptides. Chem.—Eur. J. 2012, 18, 2014–2020. [DOI] [PubMed] [Google Scholar]
- Mandal M.; Kundu S.; Ghosh S. K.; Panigrahi S.; Sau T. K.; Yusuf S. M.; Pal T. Magnetite Nanoparticles with Tunable Gold or Silver Shell. J. Colloid Interface Sci. 2005, 286, 187–194. [DOI] [PubMed] [Google Scholar]
- Kyeongse S.; Youngmin L.; Mi Ru J.; Ki Min N.; Yong-Mook K. Comprehensive Design of Carbon-Encapsulated Fe3O4 Nanocrystals and Their Lithium Storage Properties. Nanotechnology 2012, 23, 505401. [DOI] [PubMed] [Google Scholar]
- Thakur V. K.; Lin M.-F.; Tan E. J.; Lee P. S. Green Aqueous Modification of Fluoropolymers for Energy Storage Applications. J. Mater. Chem. 2012, 22, 5951–5959. [Google Scholar]
- Zhang L.-W.; Fu H.-B.; Zhu Y.-F. Efficient TiO2 Photocatalysts from Surface Hybridization of TiO2 Particles with Graphite-Like Carbon. Adv. Funct. Mater. 2008, 18, 2180–2189. [Google Scholar]
- Liu Q.; Yu B.; Ye W.; Zhou F. Highly Selective Uptake and Release of Charged Molecules by Ph-Responsive Polydopamine Microcapsules. Macromol. Biosci. 2011, 11, 1227–1234. [DOI] [PubMed] [Google Scholar]
- Martin M.; Salazar Carballo P. A.; Villalonga R.; Campuzano S.; Pingarron J. M.; Gonzalez-Mora J. L. Preparation of Core–Shell Fe3O4@Poly(Dopamine) Magnetic Nanoparticles for Biosensor Construction. J. Mater. Chem. B 2013, 2, 739–746. [DOI] [PubMed] [Google Scholar]
- Yan Y.; Zheng Z.; Deng C.; Zhang X.; Yang P. Facile Synthesis of Ti4+-Immobilized Fe3O4@Polydopamine Core-Shell Microspheres for Highly Selective Enrichment of Phosphopeptides. Chem. Commun. 2013, 49, 5055–5057. [DOI] [PubMed] [Google Scholar]
- Zhang M.; He X.; Chen L.; Zhang Y. Preparation of Ida-Cu Functionalized Core–Satellite Fe3O4/Polydopamine/Au Magnetic Nanocomposites and Their Application for Depletion of Abundant Protein in Bovine Blood. J. Mater. Chem. 2010, 20, 10696–10704. [Google Scholar]
- Pierotti R.; Rouquerol J. Reporting Physisorption Data for Gas/Solid Systems with Special Reference to the Determination of Surface Area and Porosity. Pure Appl. Chem. 1985, 57, 603–619. [Google Scholar]
- Ai K.; Liu Y.; Ruan C.; Lu L.; Lu G. Sp2 C-Dominant N-Doped Carbon Sub-Micrometer Spheres with a Tunable Size: A Versatile Platform for Highly Efficient Oxygen-Reduction Catalysts. Adv. Mater. 2013, 25, 998–1003. [DOI] [PubMed] [Google Scholar]
- Kim O.-H.; Cho Y.-H.; Kang S. H.; Park H.-Y.; Kim M.; Lim J. W.; Chung D. Y.; Lee M. J.; Choe H.; Sung Y.-E. Ordered Macroporous Platinum Electrode and Enhanced Mass Transfer in Fuel Cells Using Inverse Opal Structure. Nat. Commun. 2013, 4, 2473. [DOI] [PubMed] [Google Scholar]
- Pulko I.; Wall J.; Krajnc P.; Cameron N. R. Ultra-High Surface Area Functional Porous Polymers by Emulsion Templating and Hypercrosslinking: Efficient Nucleophilic Catalyst Supports. Chem.—Eur. J. 2010, 16, 2350–2354. [DOI] [PubMed] [Google Scholar]
- Du J.; Lai X.; Yang N.; Zhai J.; Kisailus D.; Su F.; Wang D.; Jiang L. Hierarchically Ordered Macro–Mesoporous TiO2–Graphene Composite Films: Improved Mass Transfer, Reduced Charge Recombination, and Their Enhanced Photocatalytic Activities. ACS Nano 2010, 5, 590–596. [DOI] [PubMed] [Google Scholar]
- Liu S.; Chen H.; Lu X.; Deng C.; Zhang X.; Yang P. Facile Synthesis of Copper(II) Immobilized on Magnetic Mesoporous Silica Microspheres for Selective Enrichment of Peptides for Mass Spectrometry Analysis. Angew. Chem., Int. Ed. 2010, 49, 7557–7561. [DOI] [PubMed] [Google Scholar]
- Casado-Vela J.; del Pulgar T. G.; Cebrián A.; Álvarez-Ayerza N.; Lacal J. C. Human Urine Proteomics: Building a List of Human Urine Cancer Biomarkers. Expert Rev. Proteomics 2011, 8, 347–360. [DOI] [PubMed] [Google Scholar]
- Chen Y.-T.; Chen H.-W.; Domanski D.; Smith D. S.; Liang K.-H.; Wu C.-C.; Chen C.-L.; Chung T.; Chen M.-C.; Chang Y.-S.; Parker C. E.; Borchers C. H.; Yu J.-S. Multiplexed Quantification of 63 Proteins in Human Urine by Multiple Reaction Monitoring-Based Mass Spectrometry for Discovery of Potential Bladder Cancer Biomarkers. J. Proteomics 2012, 75, 3529–3545. [DOI] [PubMed] [Google Scholar]
Associated Data
This section collects any data citations, data availability statements, or supplementary materials included in this article.


