

Abstract
The loss of cognitive function in Alzheimer’s disease (AD) patients is strongly correlated with the loss of neurons in various regions of the brain. We have created a new fluorescent bigenic mouse model of AD by crossing “H-line” yellow fluorescent protein (YFP) mice with the 5xFAD mouse model, which we call the 5XY mouse model. The 5xFAD mouse has been shown to have significant loss of L5 pyramidal neurons by 12 months of age. These neurons are transgenically labeled with YFP in the 5XY mouse, which enable longitudinal imaging of structural changes. In the 5XY mice, we observed an appearance of axonal dystrophies, with two distinct morphologies in the early stages of the disease progression. Simple swelling dystrophies are transient in nature and are not directly associated with amyloid plaques. Rosette dystrophies are more complex structures that remained stable throughout all imaging sessions, and always surrounded an amyloid plaque. Plaque growth was followed over 4 weeks, and significant growth was seen between weekly imaging sessions. In addition to axonal dystrophy appearance and plaque growth, we were able to follow spine stability in 4-month old 5XY mice, which revealed no significant loss of spines. 5XY mice also showed a striking shrinkage of the neocortex at older ages (12–14 months). The 5XY mouse model may be a valuable tool for studying specific events in the degeneration of the neocortex, and may suggest new avenues for therapeutic intervention.
Keywords: Two-photon microscopy, axonal dystrophy, amyloid plaques, neuronal loss, YFP
Introduction
Alzheimer’s disease (AD) is a devastating neurodegenerative disease that affects several million patients. AD is the most prevalent form of dementia and is defined by three pathological hallmarks: senile/amyloid plaques, neurofibrillary tangles (NFTs), and neuronal loss. While the actual etiology of AD is unknown for the majority of patients, a small subset have genetic mutations associated with early onset, or familial AD (FAD). These genetic mutations have been found in two proteins: presenilin (PS) and amyloid precursor protein (APP). APP produces amyloid beta peptides (Aβ), ranging from 36–43 amino acids in length, when it is cleaved by two secretases: β-secretase-1 (BACE1) (Vassar et al., 1999) and γ-secretase (Yu et al., 2000). FAD mutations of APP in the Aβ regions adjacent to the γ-secretase cleavage site cause a shift in the production ratio of Aβ42 to Aβ40, however, the total level of Aβ produced is not significantly altered (Giannakopoulos et al., 2009; Holtzman et al., 2011; Spires et al., 2004). However, the FAD Swedish mutation is located not adjacent to the γ-secretase cleavage site, but to the BACE1 cleavage site. This mutation location results in increased production of all species of Aβ, without a change in the ratio between Aβ42 to Aβ40 (Anderton et al., 1998; Knobloch and Mansuy, 2008; Noguchi et al., 2011). Mutations in PS, a protein involved in the γ-secretase complex, result in an increase in Aβ42 production relative to Aβ40 (Blazquez-Llorca et al., 2011). These changes in Aβ production are important as it is the Aβ42 peptide that aggregates into the senile plaques, and is considered the pathophysiological species.
The mutations in APP and PS have enabled the creation of transgenic mouse models of FAD (Duyckaerts et al., 2008). Nevertheless, there is no mouse model currently available that develops all three pathological hallmarks of clinical AD: plaques, NFTs, and neuronal loss (Merino-Serrais et al., 2011). Note there is no known mutation in tau, the proteinaceous component of NFTs, associated with FAD, so any tau mutations incorporated into FAD mouse models originate from tauopathy diseases, such as frontotemporal dementia with Parkinsonism (FTD-P) (Lee et al., 2005). Recently, it was reported that a mouse model with a mutated form of tau from FTD-P and known FAD mutations in APP showed amyloid plaques, NFTs, and neuronal loss. Therefore, it has been postulated that the majority of FAD mouse lines using APP and PS1 mutations are models of preclinical AD, as they develop plaques and some memory loss, but fail to include neuronal loss (Merino-Serrais et al., 2011). However, there have been recently created FAD mouse models that have significant neuronal loss in the hippocampus (Liu et al., 2008), neocortex (Bittner et al., 2010; Oakley et al., 2006), or both areas (Paulson et al., 2008). The loss of neurons in these areas is principally relevant to AD, as these are some of the major sites of pathology seen in human sufferers, and is best correlated with clinical dementia (Morrison and Hof, 2007). We have chosen one of these models, called the 5xFAD mouse model (Oakley et al., 2006), which displays rapid deposition of Aβ and massive neuronal loss of pyramidal neurons in the neocortex.
5xFAD mice express five FAD mutations: the Swedish, Florida, and London mutations in APP, as well as two mutations in presenillin 1 (Oakley et al., 2006). This combination of mutations under the Thy-1 promoter results in the development of senile plaques between 2–4 months of age and the loss of Layer 5 (L5) neocortical neurons around 12–18 months of age. Due to the occurrence of neurodegeneration, we believe this model has great potential to provide new insights into the disease. In order to understand the progression of neurodegeneration in the mouse model, we chose to perform longitudinal in vivo two-photon microscopy of the neocortex.
In order to analyze the changes in individual neurons longitudinally, we crossed the 5xFAD mouse line with the H-line yellow fluorescent protein (YFP) mouse model (Feng et al., 2000), making a bigenic fluorescent mouse model we have named the 5xFAD-YFP, or 5XY mouse. The inclusion of YFP in the L5 neurons allowed us to use two-photon microscopy to image chronically the progression of neurodegeneration in the somatosensory cortex. Other bigenic fluorescent AD mouse models have been made by crossing the H-line mouse with a variety of other FAD mouse lines. Studies of these mouse lines have revealed important details of structural and pathological changes (Adalbert et al., 2009; Bittner et al., 2010; Bolmont et al., 2008; Brendza et al., 2003; Brendza et al., 2005; Meyer-Luehmann et al., 2008; Spires et al., 2005; Tsai et al., 2004). However, in contrast to these other bigenic mouse models, longitudinal two-photon imaging of the 5XY mouse allowed us to capture both the initial fine details of neurodegeneration as well as massive neuronal loss in the neocortex. In this study, we report each of these stages from our in vivo imaging of the 5XY mouse model.
Materials and Methods
In vivo two-photon imaging
We used a two-photon laser scanning microscope and PrarieView software (Prairie Technologies, Inc., Middleton, WI, USA) with a 20x water immersion objective (Olympus; 0.95 or 1.0 numerical aperture) to image neurons and plaques. A mode-locked Ti:sapphire laser (Chameleon; Coherent, Santa Clara, CA, USA) was used to generate 2-photon excitation at 950 nm and 840nm, for YFP and methoxy-XO4 respectively, with power at the back aperture in the range of 10–50mW, depending on depth. Photomultiplier tubes R3896 (Hamamatsu Corporation, Bridgewater, NJ, USA) collected the emitted light from the cells. We used a pixel dwell time of 4μs, with a frame size of 512×512 pixels. The animal remained under anesthesia for the duration of the imaging session, using 20% ketamine/xylazine supplement of the initial dose (0.1 mg/kg), as needed. Imaging sessions lasted approximately 1.5 hours per session.
Mouse model
The 5xFAD mouse (B6.Cg-Tg(APPSwFlLon,PSEN1*M146L*L286V)6799Vas/J) (Oakley et al., 2006) was crossed with the H-line YFP mouse (B6.Cg-Tg(Thy1-YFP)16Jrs/J) (Feng et al., 2000) by The Jackson Laboratory (Bar Harbor, ME). The creation of this new cross generates four genotypes: wild-type mice (WT; −/−), 5xFAD trangenes only (5X; +/−), YFP transgenes only (Y; −/+), and both 5xFAD transgenes and YFP transgenes (5XY; +/+). For our imaging studies, we used female 5XY and Y mice at ages ranging from 3 months to 14 months.
Chronic cranial window implantation
Mice were anesthetized with an intraperitoneal (I.P) injection of 0.1 mg/kg xylazine/ketamine mixture, and supplemented with 20% of initial dose, as needed. The level of anesthesia was checked using the paw pinch test. Once fully anesthetized, all hair on the scalp was removed using a razor blade and the scalp was cleaned with alternating swabs of 70% ethanol and betadine. A midline incision in the skin was made from the base of the skull to the base of the nose. The periosteum was cleaned from the skull with a sterile cotton swab and then the animal was placed in a stereotaxic apparatus (Narishige International USA, Inc., East Meadow, NY, USA). Areas were marked in the designated stereotactic coordinate for the somatosensory cortex (−2 bregma, +2 midline). The surrounding area of skull was covered with a thin layer of Vetbond (3M, St. Paul, MN, USA). The craniotomy was performed using a burr drill bit with a microdrill. The skull was gently removed and a sterile 5 mm glass coverslip was placed over the exposed area and sealed with cyanoacrylate glue. The remaining exposed area was covered with dental cement, with a small well around the coverslip. Skin was glued and/or sutured around the window area.
Skull Thinning
Surgery was performed as described above to the point of the removal of the periosteum. The skull was swabbed with a sterile cotton swab and then a custom head plate was fixed to the skull with cyanoacrylate glue. A small burr-drill was used to thin an area of the skull approximately 1 mm in diameter. The skull was thinned to approximately 20 μm thick, which was checked manually with the microscope software. All animal work was conducted in accordance with the Mount Sinai School of Medicine Institutional Animal Care and Use Committee guidelines.
Amyloid beta plaque labeling
Methoxy-XO4 was used to label Aβ deposits in the brain (Klunk et al., 2002). A 12 mg/kg solution in artificial cerebrospinal fluid was injected I.P. 15–18 hours before each imaging session. Imaging wavelengths of either 780 nm or 840 nm were used.
Image Analysis
In vivo dendritic segments were deconvolved using AutoDeblur (MediaCybernetics, Rockville, MD, USA) and then put into NeuronStudio (Rodriguez et al., 2008; Wearne et al., 2005) for neurite and spine analysis. Image adjustments to optimize contrast were performed in ImageJ. Distracting background was removed for presentation purposes. For in vivo plaques, the diameter of individual plaques was measured, and the cross-sectional area was determined. For statistical analysis, a one-way ANOVA was performed. Two-way ANOVA was performed for plaque distribution through the layers of the neocortex over time. Confidence levels were set at 95% for all statistical analyses. All figures were produced using Adobe Photoshop.
Results
Development and two-photon imaging of the 5XY mouse line
In order to visualize neurons in vivo, the 5xFAD mouse model (Oakley et al., 2006) was crossed with the transgenically fluorescent H-line mouse model (Feng et al., 2000), to yield a new mouse line, which we have named 5XY. The 5XY mouse includes both 5xFAD transgenes and YFP transgenes, with the control Y mouse only including the YFP transgenes. L5 pyramidal neurons in the H-line mouse are sparsely labeled with YFP, and are intensely fluorescent. Pyramidal neurons in Layers 2 and 3 (L2/3) are equally fluorescent but are labeled to a lesser extent. The 5XY and Y mice had an identical pattern of fluorescent labeling (Fig 1A,F). Detailed views of apical dendrites (Fig 1B,D) and basal cell bodies (Fig 1C,E) also show no difference in labeling. A cranial window (Trachtenberg et al., 2002) was implanted in 5XY mice and age-matched YFP-only controls (i.e. FAD null, YFP positive) at approximately 10–12 weeks, and neocortical neurons were imaged using 2-photon microscopy (Ellis-Davies, 2011). The majority of windows remained optically transparent for up to four months, and allowed for repetitive imaging of the same neuronal structures 500–600μm below the pia up to eight times. In a small subset of mice, skull thinning was performed instead of window implantation. Skull thinning (Grutzendler et al., 2002) allows for clear repetitive imaging up to 250μm below the pia, without the invasive removal of the skull. All neuronal structures imaged through thinned skulls and window implantations were very similar, showing that neither surgery adversely affects neurites or labeling.
Figure 1.
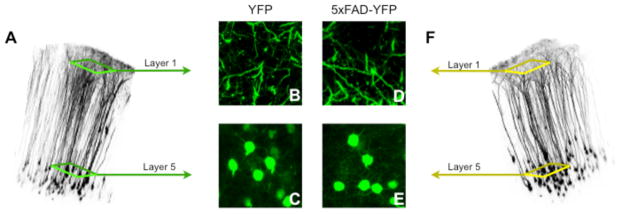
YFP expression in 5XY and YFP-only controls. A) A volume reconstruction of a 3-month-old YFP “Y” control mouse. These mice are hemizygous for YFP and wild for the 5xFAD transgenes. B) Apical dendrites of the Y mouse. C) L5 pyramidal neuron cell bodies in the basal layers of the neocortex. D) Apical dendrites of the 5xFAD-YFP “5XY” mouse. E) L5 pyramidal neuron cell bodies in the basal layers of the neocortex. F) A volume reconstruction of a 3-month-old 5XY mouse. These mice are hemizygous for YFP and hemizygous for 5xFAD transgenes.
Axonal dystrophy appearance
In the 5XY and Y mice, we were able to reimage axons reliably over several weeks. The first sign of neuronal atrophy in the 5XY mice is axonal dystrophy, appearing between 3–4 months of age (Fig 2A–C), which are not seen in Y control mice, even up to 6 months of age (Fig 2D–F). We have observed two distinct dystrophy morphologies which we refer to as “simple swelling” dystrophy (Fig 3A) and “rosette” dystrophy (Fig 3B). The simple swelling appears along a continuous single axon and is often transient, appearing and disappearing between imaging sessions. These simple swellings were seen more often in the apical layers of the neocortex. Rosette dystrophies appeared as several small swellings clustered in a sphere or circle. Unlike the simple swellings, once a rosette dystrophy appeared in an imaging session, it remained there throughout all subsequent imaging sessions. Rosette dystrophies were more abundant in the basal layers of the neocortex in the early stages of pathology (Fig 4). Note that in H-line mice the YFP has been shown previously to have no deleterious or toxic effects on neuronal structures (Feng et al., 2000), and our Y mice did not display any axonal dystrophy or swelling in any imaging session at any age.
Figure 2.

Rosette dystrophies appear around 3 months of age. A–C) Basal layer of a 5XY mouse showing the appearance of axonal dystrophies (red arrows). D–F) Basal layer of a Y mouse showing no dystrophic axons or any other structural abnomalities, even at 6 months of age. Scale bar = 20μm.
Figure 3.
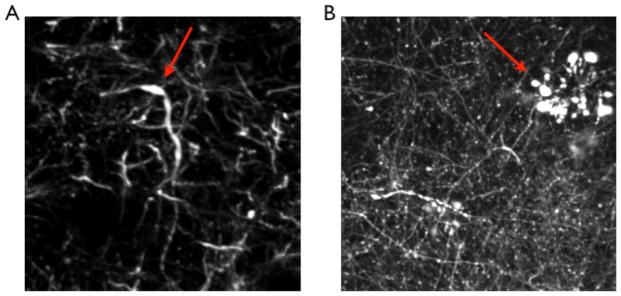
Axonal Dystrophy in the 5XY mouse. Two distinct types of axonal dystrophy were observed in the 5XY mice. A) Simple swelling of a single axon, which is transient across imaging sessions. These swellings are not always in close proximity to a plaque. B) Rosette dystrophy. This type of axonal dystrophy is seen in various mouse models of AD, and appears to be stable throughout all imaging sessions. Red arrows indicate dystrophy location.
Figure 4.

Rosette dystrophies begin in the basal layers of L5 pyramidal neurons. Rosette dystrophies are first detected approximately 500μm below the pia mater and rapidly increase in number (B). While there is substantial dystrophy in the basal layer, there is no evidence of axonal dystrophy, or any structural abnormalities, in the apical layers of these neurons (A). (* indicates individual cell somas, cyan arrow indicates a dystrophic area, scale bar = 50μm)
Amyloid plaque growth
We imaged 152 individual amyloid plaques every 7 days through a cranial window over four consecutive weeks in 3–4 month-old 5XY mice (n=4 mice). In order to visualize plaques in vivo, methoxy-XO4 was administered I.P. 15–18 hours before an imaging session. Methoxy-XO4 is a fluorescent analog of Congo Red that is able to cross the blood brain barrier and stain the dense core of the plaques (Klunk et al., 2002). Only plaques that were present in the first imaging session were analyzed for growth over the four weeks. Significant plaque growth was observed at 7-, 14-, and 21-day time points (Fig 5). At the 7-day time point, 23% of plaques increased by at least 2-fold compared to Day 0. The average fold increase in cross-sectional area at the 7-day mark was 1.69 ± 0.81 (p<0.0001; Fig 5A). The 14-day time point revealed 42% of the plaques increased by at least 2-fold compared to Day 0, with the largest increase at 8-fold. The average fold increase at 14-days is 2.26 ± 1.38 (p<0.0001; Fig 5B). At the 21-day time point, 66% of the plaques increased by 2-fold or more compared to Day 0, with the maximum observed increase of 12-fold. The average fold increase at 21 days was 3.24 ± 2.06 (p<0.0001; Fig 5C). Note, no plaques were detected in Y mice.
Figure 5.

Increase in plaque size in the 5XY mouse. 97 plaques were reimaged over 21 days, at 7-day intervals. A) There is an overall significant increase in plaque size (cross-sectional area) from Day 0 to Day 7. The average fold-change for plaques at the 7-day time point was 1.69±0.81. B) After 14 days, there remains a significant fold-change, with an average fold-change of 2.26±1.38. C) Plaque size continued to grow at the 21-day mark, with an average fold-change of 3.24±2.06 (*p<0.0001). D) A representative plaque showing significant growth over 21 days of imaging (scale bar = 10μm).
Relationship between axonal dystrophies and plaques
We examined the relationship between the axonal dystrophies seen in the 5XY mouse and plaque deposition. YFP and methoxy-XO4 can be spectrally separated, enabling us to image neuronal structures and plaques simultaneously (Klunk et al., 2002; Meyer-Luehmann et al., 2008). Therefore, methoxy-XO4 was administered to each mouse prior to the imaging session. Every rosette dystrophy was immediately surrounding a plaque (n=4 mice, 395 dystrophies; Fig 6A), suggesting an intimate and direct relationship. The simple swelling dystrophies, however, were not surrounding or even near plaques (n=6 mice, 46 dystrophies, Fig 6B). The average distance between a simple swelling dystrophy and a plaque was 73.58 ± 64.81μm. For a distribution of distance between plaques and simple swellings see Fig 6C.
Fig 6.

Spatial relationship between types of dystrophy and plaques. A) Rosette dystrophies are always encircling a plaque, showing an intimate associate between plaque location and rosette dystrophies. Scale bar = 10μm. B) Simple swelling dystrophies are an average of 73.58±64.81μm away from a plaque. Therefore, there is no intimate associate between simple swelling dystrophies and plaque location. Yellow arrow indicates simple swelling dystrophy. Scale bar = 15μm. C) The distribution of simple swelling dystrophies and their distance from the nearest plaque.
Amyloid distribution
We also examined plaque distribution in the apical and basal layers of the somatosensory cortex, Layer 1 (L1) and L2/3 in the apical layers (Fig 7A), and the basal layers (Fig 7B), comprised of Layer 4 (L4) and L5, and over four weekly imaging sessions of 4-month-old 5XY mice (n= 3 mice, 930 plaques, Fig 7A). Plaques in the basal layers were consistently the most abundant (Wk1: 69.87 ± 19.90%, Wk2: 65.24 ± 15.80%, Wk3: 62.04 ± 15.86%, Wk4: 63.33 ± 11.97%), followed by L1 (Wk1: 21.01 ± 3.57%, Wk2: 19.86 ± 5.11%, Wk3: 20.93 ± 5.32%, Wk4: 20.35 ± 0.95%; p<0.05 when compared to basal), and L2/3 (Wk1: 9.12 ± 10.56%, Wk2: 14.90 ± 7.16%, Wk3: 17.03 ± 10.49%, Wk4: 16.32 ± 10.35%; p<0.01 when compared to basal), in descending order. This pattern of distribution was maintained throughout all four imaging sessions (Fig 7C).
Figure 7.

Plaque distribution in the neocortex. A) Maximum projections of selected volumes of apical and basal layers of the neocortex of one mouse. Green labeling is YFP labeled neurons, while red labeling is methoxy-XO4 stained plaques. There is a greater number of plaques in the basal level compared to the apical level. B) Graphical representation of the distribution of plaques in each layer over the 4 weekly imaging sessions. There was a statistically significant effect of layer (p<0.05), but not time (p>0.05), over the 4 weeks. Scale bar = 50μm.
Spine Density
As mentioned, axonal dystrophy begins to appear between 3–4 months of age, and rapidly increases over the following weeks. However, during this time of axonal damage, the dendrites appeared structurally healthy in all layers in vivo. No dendritic dystrophy or structural abnormalities, which have been reported in the 3xTg mouse model (Bittner et al., 2010), were observed in the first few months of repetitive imaging. We examined spine density on the basal dendrites (~500μm below the pia mater) of 4 month-old 5XY and Y mice. The same dendritic segments were imaged in vivo once a week for three weeks (Fig 8A). The density of basal spines in the 5XY mice did not significantly decrease over the three imaging sessions (1.12 ± 0.19, 1.15 ± 0.25, 1.21 ± 0.26 spines/μm, respectively; n=987 spines, p>0.05; Fig 8B) and were not statistically different from the basal spine density of Y mice during the same period (1.15 ± 0.08, 1.13 ± 0.10, 1.09 ± 0.10 spines/μm, respectively; n=1070 spines, p>0.05; Fig 8B). Dendritic segments were chosen without the knowledge of plaque proximity in order to obtain an unbiased population study of spine density on basal dendrites. The stability of dendritic spines on basal dendrites was confirmed by the imaging of ex vivo brain slice samples by high-resolution confocal microscopy. This tissue was from the same cohort of 5XY and Y mice used for the in vivo studies. We observed no statistically significant difference in spine density between genotypes at 4 months of age (Crowe and Ellis-Davies, submitted).
Figure 8.
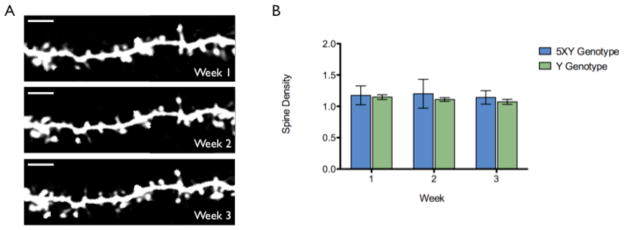
Basal spine density in vivo. A) 5XY basal spines over three 1-week imaging sessions. Images were taken approximately 500μm below the pia mater. Scale bar = 5μm. B) The graphical representation of average spine density between genotypes over the three 1-week imaging sessions. There is no statistical difference in density between genotypes or with time (p>0.05, n=2057 spines). C) A representative basal dendritic segment from confocal imaging of 4-month-old ex vivo 5XY brain tissue. Scale bar = 10μm.
Volume Loss
The number of L5 pyramidal neurons of the cortex was found to be significantly decreased at 12 months of age compared to Y mice. We have looked at a few older 5XY mice with window implantations to understand when neuronal loss begins to occur. We have found that by approximately 14 months of age in female 5XY mice the neocortex has shrunk by 20–50% (n=2; Fig 9). The cell bodies in the bottom of the image at 14 months resemble a similar labeling density as would be expected in L5, rather than L2/3, despite the depth of the cells in the imaging volume. An acute window implantation was performed on a surgically naïve 14 month old 5XY female to determine if the volume loss was due to the presence of a window for over 6 months. We observed a drastic reduction of volume, ~50%, in the acute surgery mouse compared to the average volume seen in control mice (data not shown).
Fig 9.
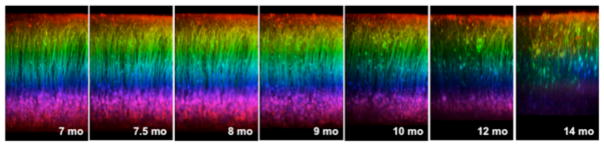
Progressive volume loss in an aged 5XY mouse. Over the course of 7 months, there was increased neuritic dystrophy and an eventual shrinkage of the neocortex by 14 months. Neocortical shrinkage was found to be between a 20–50% change from the original imaging depth.
Surgical Technique
Two different surgeries have been developed for in vivo two-photon imaging of transgenically fluorescent mice: skull thinning (Grutzendler et al., 2002) and chronic window implantation (Trachtenberg et al., 2002). For the majority of our experiments, a chronic window implantation was used for imaging. Window implantation enables imaging depths of up to 600μm below the pia mater, but is considered invasive due to the removal of a small area of skull (Grutzendler et al., 2002; Holtmaat et al., 2009). Skull thinning is considerably less invasive since the skull remains intact, but the imaging depths do not normally exceed 250μm below the pia mater. In order to ensure that any structural changes observed in the 5XY mouse was due to the progression of disease and not the implantation of the window, skull thinning was performed on a small subset of mice (n=3). In young 5XY mice (2–3 months of age), apical neuronal structures appeared indistinguishable from age-matched Y mice in skull thinning mice (Fig 10A) and window implantation mice (Fig 10B). The rate of structural decline was similar using both 2-photon imaging surgery methods with large qualitative loss of structural integrity in the apical layers by 8 months of age (Fig 10A,B).
Fig 10.

Neuronal changes with skull thinning or window implantation. A) Skull thinning revealed that there are large structural changes, in the form of dystrophies, that progress from 5 months of age to 8 months of age. B) Window implantation also showed progressive neuronal changes from 5 months to 8 months of age. There were no obvious effects of the more invasive window implantation on the rate or progression of disease damage.
Discussion
In this study, we have described the features of neurodegeneration and disease progression in a new bigenic fluorescent mouse model of FAD using in vivo longitudinal two-photon microscopy. AD is a progressive degenerative disease, characterized by three pathological hallmarks: senile plaques, neurofibrillary tangles, and neuronal loss. Hundreds of mouse models of AD have been created using the genetic mutations observed in FAD patients, but few show significant neuronal loss (Duyckaerts et al., 2008; Tsuchiya et al., 2002), a significant clinical aspect of human AD sufferers (Morrison and Hof, 2007). We chose to study a transgenic mouse that models this loss, along with the time-dependent deposition of amyloid plaques in the neocortex.
Recently, the first reports of long-term positron emission tomography (PET) imaging of FAD patients were published, providing unique insight into the progression of the disease (Forster et al., 2012; Kadir et al., 2012; Ossenkoppele et al., 2012). The studies examined Pittsburgh compound B (PIB) retention and F-fluorodeoxyglucose (FDG) uptake, a marker of brain metabolism, and how it relates to the performance of subjects on cognitive tests. In one study, there was an increase in PIB retention, a slight decrease in FDG uptake, and no change in cognitive performance at the 3-year follow up scans (Kadir et al., 2012). At the 5-year follow-up, no significant changes in PIB retention were observed, but a significant decrease in FDG uptake was seen. There was a significant decrease in cognitive function, with episodic memory showing the greatest levels of impairments. With the 5XY mouse model it is possible to image the increase in plaque burden along with the decline in neuronal structures, which has the potential to reveal how closely the course of pathology mimics the pathology seen with PET imaging in human patients.
The 5xFAD mouse model was introduced in 2006, and since then there have been several studies examining changes in neuronal number (Jawhar et al., 2010), intraneuronal Aβ levels (Jawhar et al., 2010), behavioral performance (Devi and Ohno, 2010; Kimura and Ohno, 2009; Oakley et al., 2006; Ohno et al., 2007), BACE1 levels (Devi and Ohno, 2010; Ohno et al., 2007; Zhang et al., 2011; Zhao et al., 2007), and mitochondrial function (Devi and Ohno, 2012). While these studies provide important insight into different aspects of neurodegeneration seen in the 5xFAD model, no longitudinal study had been performed to determine the events of neurodegeneration in the L5 pyramidal neurons. The use of transgenic fluorescence is not only a convenient means of labeling cells for imaging fixed tissue (Feng et al., 2000), but allows for easy and sensitive detection of neuronal structures (Holtmaat et al., 2009). We were able to clearly identify the soma, main apical dendrite, apical tufted dendrites, basal dendrites, postsynaptic spine heads, axons in basal and apical layers, and presynaptic boutons of L5 neurons. In young 5XY mice, YFP labeling is identical to Y control mice (Fig 1), indicating that the 5XY mice at young ages are structurally healthy and any changes to the neurites can be attributed to the progression of pathology and disease, rather than inherent structural abnormalities of the model. We also performed two different surgeries, one less invasive than the other, in separate sets of mice to ensure that any changes in neuronal structure were not artifacts of surgery. In our hands, we found the type of surgery performed for imaging does not alter the rate of neuronal atrophy or create any structural changes in Y mice (Fig 10).
The 5XY fluorescent bigenic mouse line is not the first example of a fluorescent AD mouse model, however, it is the first fluorescent AD mouse model that has extensive neuronal loss in the neocortex. Recent studies of other bigenic fluorescent mouse models of FAD have revealed important details of structural and pathological changes. In many of these studies, it has been shown that plaques have a “local toxicity,” altering the immediately surrounding neuronal structures. Examples of local toxicity are neuritic curvature around plaques (Meyer-Luehmann et al., 2008), dystrophic neurites (Adalbert et al., 2009; Bittner et al., 2010; Bolmont et al., 2008; Brendza et al., 2003; Brendza et al., 2005; Spires et al., 2005; Tsai et al., 2004), spine loss (Bittner et al., 2010; Bittner et al., 2012; Spires et al., 2005; Tsai et al., 2004), and breakage of neuronal branches (Tsai et al., 2004). In only one of these studies, using the 3xTg model, was any neocortical neuronal loss observed, which was of the Layer III pyramidal neurons (Bittner et al., 2010). Several of the previously studied fluorescent AD mouse models reported severely dystrophic axons, dubbed rosette dystrophies (Adalbert et al., 2009; Bittner et al., 2010; Brendza et al., 2003; Brendza et al., 2005; Spires et al., 2005; Tsai et al., 2004), which we also saw in the 5XY mouse. Using longitudinal imaging, we were able to follow the appearance of the rosette dystrophies, which first appear in L5, as well as the appearance and disappearance of simple swelling dystrophies. We were able to determine that rosette dystrophies are consistent throughout weeks of imaging, while the simple swelling dystrophies were transient, often disappearing within one to two imaging sessions. The cause of the transient nature of the simple swelling dystrophies is unknown, but the 5XY model could be a good candidate for exploration of this phenomenon.
Recently, the rosette dystrophies in the 5xFAD mouse model were examined in brain sections from 6-month-old mice (Zhang et al., 2009). It was found that there was a heavy localized BACE1 immunoreactivity in the dystrophic axons, an obligatory protein in the production of Aβ42, and therefore plaque formation. When the 5xFAD mouse model is crossed with either a homozygous or heterozygous knockout of BACE1, the pathological phenotype of the 5xFAD is reversed (Devi and Ohno, 2010; Kimura et al., 2010). We found our in vivo data followed a similar correlation between rosette dystrophies and plaque deposition. We showed that not only was every imaged rosette dystrophy surrounding a compact plaque, but also that dystrophies were stable. This maintained intimate relationship between rosette dystrophies and plaques indicates that dystrophic axons may play an important role in plaque development and maintenance.
Plaque growth in the early to mid-stage progression of pathology has been shown in longitudinal studies of other mouse models of AD (Burgold et al., 2011; Hefendehl et al., 2011; Yan et al., 2009), revealing that plaques are indeed dynamic structures. While there is evidence that plaque growth can be extensive, with up to 20-fold increases reported, arrests in growth have been reported in large plaques in aged AD mice (>12 months of age) (Burgold et al., 2011; Hefendehl et al., 2011). We were able to show that plaque growth in 3–4 month old 5XY mice was highly dynamic with 66% of plaques growing at least 2-fold by the termination of the experiment (Fig 5), similar to the previously studied mouse models of AD (Burgold et al., 2011; Hefendehl et al., 2011). In addition to detecting plaque growth in the 5XY mouse, we were able to determine that the basal layers of the neocortex of 4-month-old 5XY mice had a significantly higher density of plaques than the apical layers. This finding would indicate that the basal layers either produce more Aβ than the apical layers and plaques are deposited locally, or that the basal layers are more efficient as reservoirs for Aβ. Understanding the relationship between plaque growth and distribution, neuronal loss, and behavioral changes in the 5XY mouse might provide useful insight into the clinical manifestation of AD in human patients.
While there was a structural decline in axons in the form of dystrophies, we found dendritic spine density remained stable. Importantly, the longitudinal stability of spines in non-diseased mice has been reported in several studies over the past several years (Grutzendler et al., 2002; Trachtenberg et al., 2002; Holtmaat et al., 2005; Pan and Gan, 2008; Lai et al., 2012; Holtmaat et al., 2006; Zuo et al., 2005). There is a general agreement from several studies using in vivo two-photon imaging that spines appear generally stable in adult mice (>3 months of age) (Bhatt et al., 2009; Holtmaat and Svoboda, 2009). The loss of spines has long been assumed to be the primary step in structural and cognitive decline associated with AD (Lambert et al., 1998; Luebke et al., 2010; Shrestha et al., 2006; Snyder et al., 2005). In vivo studies have shown that spine density was significantly decreased within 15–20μm of a plaque, furthering the evidence of local toxicity of plaques (Spires et al., 2005; Tsai et al., 2004). We chose to examine basal spines between 500–550μm below the pia mater because it was in the basal layers that the axonal dystrophy and plaques first appeared. Surprisingly, we found that basal spine density in 4-month-old 5XY mice was comparable to Y control mice throughout all three weekly imaging sessions. Comparable spine densities between genotypes at 4 months of age were confirmed by ex vivo high-resolution imaging of the same cohort of mice used in this in vivo study (Crowe and Ellis-Davies, submitted). Ex vivo imaging allows for a more facile study of basal dendritic spines, enabling the analysis of approximately 4-fold more individual spines. Thus, we believe that our ex vivo findings substantially support our in vivo data. The spine stability in the 4-month-old 5XY mouse model suggests that dendritic spines are less susceptible to atrophy than axons in the initial stages of neurodegeneration and plaque appearance in 5xFAD mice. A recent study also found that spine loss in the APPPS1-YFP mouse model was preceded by amyloid plaque formation by at least 4 weeks (Bittner et al., 2012). Our work, along with other recent two-photon imaging studies of bigenic FAD mice, suggest that the modes of neurodegeneration are multifactorial, embracing both and pre- and post-synaptic neuronal components.
Although we do not observe any spine density differences between 5XY and Y mice at 4 months of age, we were able to observe a drastic loss of volume in the neocortex in aged 5XY mice. Neocortical neuron loss was report to be extensive by 12–18 months of age in the 5xFAD mouse model (Oakley et al., 2006). We were unable to perform any quantitative measures of longitudinal volume loss in vivo, as it is extremely difficult to maintain an optically transparent window for more than a few months. It is also rather complicated to re-image aged 5XY mice, as we found that the extensive level of neuronal damage made it difficult to relocate the same exact areas in the brain at the later (most atrophied) time points. However, shrinkage of the brain is an important pathological feature in the model because it is also seen in human brains from AD patients. The loss of neurons and brain volume is best correlated with dementia (Morrison and Hof, 2007), and no published studies to date have shown progressive neurodegeneration and loss of brain volume in the same mouse longitudinally. While we have shown a quantitative example of this, a more qualitative approach is necessary to understand the mechanisms behind this dramatic change in neuronal structure.
Understanding the events of neurodegeneration is a crucial step in understanding how this disease progresses and developing new treatment strategies. It has been suggested that the clinical manifestation of AD, measured by the Clinical Dementia Rating (CDR), occurs approximately 10–20 years after the actual onset of pathology (Holtzman et al., 2011). Extensive pathology has been shown in many postmortem brain samples of patients with low CDR scores, which would be considered very mild dementia (Morris and Price, 2001; Price and Morris, 1999; Price et al., 2001). Understanding this disparity between pathogenesis and cognitive abilities could be important for understanding how to treat and manage Alzheimer’s disease. Results from long-term PET imaging of AD patients suggest that the accumulation of amyloid plaques in the brain precedes neuronal decline. The PET imaging modality is inherently low resolution (mm scale), in contrast, two-photon fluorescence microscopy allows high-resolution (sub-μm) imaging of structural changes in the brain. Our application of this technique revealed both detailed and general structural changes in the brains of 5XY mice as FAD pathology progressed. Recently, the idea that axons are highly susceptible to atrophy in several neurodegenerative diseases has been advanced (Coleman and Perry, 2002) with several genetically distinct mouse models of AD supporting this hypothesis (Adalbert et al., 2007). Our results with the 5XY mouse are consistent with these ideas, as in young mice we observed a rapid increase in axonal dystrophies that appeared to be the very first stage of neuronal atrophy. Such atrophy was intimately associated with amyloid plaques, yet the cell body and dendritic tree appeared essentially normal at this time. Importantly, profound dendritic atrophy was apparent when imaging older 5XY mice. These results taken together show the 5XY mouse is a uniquely powerful tool for the study of neuronal atrophy.
Acknowledgments
We thank Dr. Wenbiao Gan and Dr. Guang Yang for initial training in the thinned skull technique. We also thank Dr. Karel Svoboda for providing an early manuscript version of his window implantation method that was eventually published as Nature Protocols 10.1038/nprot.2009.89.
Footnotes
Conflict of interest statement.
The authors declare they have no conflict of interest.
Author contributions.
All authors had full access to all the data in the study and take responsibility for the integrity of the data and the accuracy of the data analysis. Study concept: GCRE-D. Study design: GCRE-D and SEC. Acquisition of data: SEC. Analysis and interpretation of data: SEC and GCRE-D. Drafting of the manuscript: SEC and GED. Statistical analysis: SEC. Obtained funding: GCRE-D. Study supervision: GCRE-D.
References
- Adalbert R, Gilley J, Coleman MP. Abeta, tau and ApoE4 in Alzheimer’s disease: the axonal connection. Trends Mol Med. 2007;13:135–42. doi: 10.1016/j.molmed.2007.02.004. [DOI] [PubMed] [Google Scholar]
- Adalbert R, Nogradi A, Babetto E, Janeckova L, Walker SA, Kerschensteiner M, Misgeld T, Coleman MP. Severely dystrophic axons at amyloid plaques remain continuous and connected to viable cell bodies. Brain. 2009;132:402–16. doi: 10.1093/brain/awn312. [DOI] [PubMed] [Google Scholar]
- Anderton BH, Callahan L, Coleman P, Davies P, Flood D, Jicha GA, Ohm T, Weaver C. Dendritic changes in Alzheimer’s disease and factors that may underlie these changes. Prog Neurobiol. 1998;55:595–609. doi: 10.1016/s0301-0082(98)00022-7. [DOI] [PubMed] [Google Scholar]
- Bhatt DH, Zhang S, Gan WB. Dendritic spine dynamics. Annu Rev Physiol. 2009;71:261–82. doi: 10.1146/annurev.physiol.010908.163140. [DOI] [PubMed] [Google Scholar]
- Bittner T, Fuhrmann M, Burgold S, Ochs SM, Hoffmann N, Mitteregger G, Kretzschmar H, LaFerla FM, Herms J. Multiple events lead to dendritic spine loss in triple transgenic Alzheimer’s disease mice. PLoS One. 2010;5:e15477. doi: 10.1371/journal.pone.0015477. [DOI] [PMC free article] [PubMed] [Google Scholar]
- Bittner T, Burgold S, Dorostkar MM, Fuhrmann M, Wegenast-Braun BM, Schmidt B, Kretzschmar H, Herms J. Amyloid plaque formation precedes dendritic spine loss. Acta Neuropathol. 2012 doi: 10.1007/s00401-012-1047-8. [DOI] [PMC free article] [PubMed] [Google Scholar]
- Blazquez-Llorca L, Garcia-Marin V, Merino-Serrais P, Avila J, DeFelipe J. Abnormal tau phosphorylation in the thorny excrescences of CA3 hippocampal neurons in patients with Alzheimer’s disease. J Alzheimers Dis. 2011;26:683–98. doi: 10.3233/JAD-2011-110659. [DOI] [PubMed] [Google Scholar]
- Bolmont T, Haiss F, Eicke D, Radde R, Mathis CA, Klunk WE, Kohsaka S, Jucker M, Calhoun ME. Dynamics of the microglial/amyloid interaction indicate a role in plaque maintenance. J Neurosci. 2008;28:4283–92. doi: 10.1523/JNEUROSCI.4814-07.2008. [DOI] [PMC free article] [PubMed] [Google Scholar]
- Brendza RP, O’Brien C, Simmons K, McKeel DW, Bales KR, Paul SM, Olney JW, Sanes JR, Holtzman DM. PDAPP; YFP double transgenic mice: a tool to study amyloid-beta associated changes in axonal, dendritic, and synaptic structures. J Comp Neurol. 2003;456:375–83. doi: 10.1002/cne.10536. [DOI] [PubMed] [Google Scholar]
- Brendza RP, Bacskai BJ, Cirrito JR, Simmons KA, Skoch JM, Klunk WE, Mathis CA, Bales KR, Paul SM, Hyman BT, Holtzman DM. Anti-Abeta antibody treatment promotes the rapid recovery of amyloid-associated neuritic dystrophy in PDAPP transgenic mice. J Clin Invest. 2005;115:428–33. doi: 10.1172/JCI23269. [DOI] [PMC free article] [PubMed] [Google Scholar]
- Burgold S, Bittner T, Dorostkar MM, Kieser D, Fuhrmann M, Mitteregger G, Kretzschmar H, Schmidt B, Herms J. In vivo multiphoton imaging reveals gradual growth of newborn amyloid plaques over weeks. Acta Neuropathol. 2011;121:327–35. doi: 10.1007/s00401-010-0787-6. [DOI] [PMC free article] [PubMed] [Google Scholar]
- Coleman MP, Perry VH. Axon pathology in neurological disease: a neglected therapeutic target. Trends Neurosci. 2002;25:532–7. doi: 10.1016/s0166-2236(02)02255-5. [DOI] [PubMed] [Google Scholar]
- Devi L, Ohno M. Genetic reductions of beta-site amyloid precursor protein-cleaving enzyme 1 and amyloid-beta ameliorate impairment of conditioned taste aversion memory in 5XFAD Alzheimer’s disease model mice. Eur J Neurosci. 2010;31:110–8. doi: 10.1111/j.1460-9568.2009.07031.x. [DOI] [PMC free article] [PubMed] [Google Scholar]
- Devi L, Ohno M. Mitochondrial dysfunction and accumulation of the beta-secretase-cleaved C-terminal fragment of APP in Alzheimer’s disease transgenic mice. Neurobiol Dis. 2012;45:417–24. doi: 10.1016/j.nbd.2011.09.001. [DOI] [PMC free article] [PubMed] [Google Scholar]
- Duyckaerts C, Potier MC, Delatour B. Alzheimer disease models and human neuropathology: similarities and differences. Acta Neuropathol. 2008;115:5–38. doi: 10.1007/s00401-007-0312-8. [DOI] [PMC free article] [PubMed] [Google Scholar]
- Ellis-Davies GC. Two-photon microscopy for chemical neuroscience. ACS Chem Neurosci. 2011;2:185–197. doi: 10.1021/cn100111a. [DOI] [PMC free article] [PubMed] [Google Scholar]
- Feng G, Mellor RH, Bernstein M, Keller-Peck C, Nguyen QT, Wallace M, Nerbonne JM, Lichtman JW, Sanes JR. Imaging neuronal subsets in transgenic mice expressing multiple spectral variants of GFP. Neuron. 2000;28:41–51. doi: 10.1016/s0896-6273(00)00084-2. [DOI] [PubMed] [Google Scholar]
- Forster S, Yousefi BH, Wester HJ, Klupp E, Rominger A, Forstl H, Kurz A, Grimmer T, Drzezga A. Quantitative longitudinal interrelationships between brain metabolism and amyloid deposition during a 2-year follow-up in patients with early Alzheimer’s disease. Eur J Nucl Med Mol Imaging. 2012 doi: 10.1007/s00259-012-2230-9. [DOI] [PubMed] [Google Scholar]
- Giannakopoulos P, Kovari E, Gold G, von Gunten A, Hof PR, Bouras C. Pathological substrates of cognitive decline in Alzheimer’s disease. Front Neurol Neurosci. 2009;24:20–9. doi: 10.1159/000197881. [DOI] [PubMed] [Google Scholar]
- Grutzendler J, Kasthuri N, Gan WB. Long-term dendritic spine stability in the adult cortex. Nature. 2002;420:812–6. doi: 10.1038/nature01276. [DOI] [PubMed] [Google Scholar]
- Hefendehl JK, Wegenast-Braun BM, Liebig C, Eicke D, Milford D, Calhoun ME, Kohsaka S, Eichner M, Jucker M. Long-term in vivo imaging of beta-amyloid plaque appearance and growth in a mouse model of cerebral beta-amyloidosis. J Neurosci. 2011;31:624–9. doi: 10.1523/JNEUROSCI.5147-10.2011. [DOI] [PMC free article] [PubMed] [Google Scholar]
- Holtmaat A, Wilbrecht L, Knott GW, Welker E, Svoboda K. Experience-dependent and cell-type-specific spine growth in the neocortex. Nature. 2006;441:979–83. doi: 10.1038/nature04783. [DOI] [PubMed] [Google Scholar]
- Holtmaat A, Bonhoeffer T, Chow DK, Chuckowree J, De Paola V, Hofer SB, Hubener M, Keck T, Knott G, Lee WC, Mostany R, Mrsic-Flogel TD, Nedivi E, Portera-Cailliau C, Svoboda K, Trachtenberg JT, Wilbrecht L. Long-term, high-resolution imaging in the mouse neocortex through a chronic cranial window. Nat Protoc. 2009;4:1128–44. doi: 10.1038/nprot.2009.89. [DOI] [PMC free article] [PubMed] [Google Scholar]
- Holtmaat A, Svoboda K. Experience-dependent structural synaptic plasticity in the mammalian brain. Nat Rev Neurosci. 2009;10:647–58. doi: 10.1038/nrn2699. [DOI] [PubMed] [Google Scholar]
- Holtmaat AJ, Trachtenberg JT, Wilbrecht L, Shepherd GM, Zhang X, Knott GW, Svoboda K. Transient and persistent dendritic spines in the neocortex in vivo. Neuron. 2005;45:279–91. doi: 10.1016/j.neuron.2005.01.003. [DOI] [PubMed] [Google Scholar]
- Holtzman DM, Morris JC, Goate AM. Alzheimer’s disease: the challenge of the second century. Sci Transl Med. 2011;3:77sr1. doi: 10.1126/scitranslmed.3002369. [DOI] [PMC free article] [PubMed] [Google Scholar]
- Jawhar S, Trawicka A, Jenneckens C, Bayer TA, Wirths O. Motor deficits, neuron loss, and reduced anxiety coinciding with axonal degeneration and intraneuronal Abeta aggregation in the 5XFAD mouse model of Alzheimer’s disease. Neurobiol Aging. 2010 doi: 10.1016/j.neurobiolaging.2010.05.027. [DOI] [PubMed] [Google Scholar]
- Kadir A, Almkvist O, Forsberg A, Wall A, Engler H, Langstrom B, Nordberg A. Dynamic changes in PET amyloid and FDG imaging at different stages of Alzheimer’s disease. Neurobiol Aging. 2012;33:198 e1–14. doi: 10.1016/j.neurobiolaging.2010.06.015. [DOI] [PubMed] [Google Scholar]
- Kimura R, Ohno M. Impairments in remote memory stabilization precede hippocampal synaptic and cognitive failures in 5XFAD Alzheimer mouse model. Neurobiol Dis. 2009;33:229–35. doi: 10.1016/j.nbd.2008.10.006. [DOI] [PMC free article] [PubMed] [Google Scholar]
- Kimura R, Devi L, Ohno M. Partial reduction of BACE1 improves synaptic plasticity, recent and remote memories in Alzheimer’s disease transgenic mice. J Neurochem. 2010;113:248–61. doi: 10.1111/j.1471-4159.2010.06608.x. [DOI] [PMC free article] [PubMed] [Google Scholar]
- Klunk WE, Bacskai BJ, Mathis CA, Kajdasz ST, McLellan ME, Frosch MP, Debnath ML, Holt DP, Wang Y, Hyman BT. Imaging Abeta plaques in living transgenic mice with multiphoton microscopy and methoxy-X04, a systemically administered Congo red derivative. J Neuropathol Exp Neurol. 2002;61:797–805. doi: 10.1093/jnen/61.9.797. [DOI] [PubMed] [Google Scholar]
- Knobloch M, Mansuy IM. Dendritic spine loss and synaptic alterations in Alzheimer’s disease. Mol Neurobiol. 2008;37:73–82. doi: 10.1007/s12035-008-8018-z. [DOI] [PubMed] [Google Scholar]
- Lai CS, Franke TF, Gan WB. Opposite effects of fear conditioning and extinction on dendritic spine remodelling. Nature. 2012;483:87–91. doi: 10.1038/nature10792. [DOI] [PubMed] [Google Scholar]
- Lambert MP, Barlow AK, Chromy BA, Edwards C, Freed R, Liosatos M, Morgan TE, Rozovsky I, Trommer B, Viola KL, Wals P, Zhang C, Finch CE, Krafft GA, Klein WL. Diffusible, nonfibrillar ligands derived from Abeta1-42 are potent central nervous system neurotoxins. Proc Natl Acad Sci U S A. 1998;95:6448–53. doi: 10.1073/pnas.95.11.6448. [DOI] [PMC free article] [PubMed] [Google Scholar]
- Lee VM, Kenyon TK, Trojanowski JQ. Transgenic animal models of tauopathies. Biochim Biophys Acta. 2005;1739:251–9. doi: 10.1016/j.bbadis.2004.06.014. [DOI] [PubMed] [Google Scholar]
- Liu Y, Yoo MJ, Savonenko A, Stirling W, Price DL, Borchelt DR, Mamounas L, Lyons WE, Blue ME, Lee MK. Amyloid pathology is associated with progressive monoaminergic neurodegeneration in a transgenic mouse model of Alzheimer’s disease. J Neurosci. 2008;28:13805–14. doi: 10.1523/JNEUROSCI.4218-08.2008. [DOI] [PMC free article] [PubMed] [Google Scholar]
- Luebke JI, Weaver CM, Rocher AB, Rodriguez A, Crimins JL, Dickstein DL, Wearne SL, Hof PR. Dendritic vulnerability in neurodegenerative disease: insights from analyses of cortical pyramidal neurons in transgenic mouse models. Brain Struct Funct. 2010;214:181–99. doi: 10.1007/s00429-010-0244-2. [DOI] [PMC free article] [PubMed] [Google Scholar]
- Merino-Serrais P, Knafo S, Alonso-Nanclares L, Fernaud-Espinosa I, DeFelipe J. Layer-specific alterations to CA1 dendritic spines in a mouse model of Alzheimer’s disease. Hippocampus. 2011;21:1037–44. doi: 10.1002/hipo.20861. [DOI] [PubMed] [Google Scholar]
- Meyer-Luehmann M, Spires-Jones TL, Prada C, Garcia-Alloza M, de Calignon A, Rozkalne A, Koenigsknecht-Talboo J, Holtzman DM, Bacskai BJ, Hyman BT. Rapid appearance and local toxicity of amyloid-beta plaques in a mouse model of Alzheimer’s disease. Nature. 2008;451:720–4. doi: 10.1038/nature06616. [DOI] [PMC free article] [PubMed] [Google Scholar]
- Morris JC, Price JL. Pathologic correlates of nondemented aging, mild cognitive impairment, and early-stage Alzheimer’s disease. J Mol Neurosci. 2001;17:101–18. doi: 10.1385/jmn:17:2:101. [DOI] [PubMed] [Google Scholar]
- Morrison JH, Hof PR. Life and death of neurons in the aging cerebral cortex. Int Rev Neurobiol. 2007;81:41–57. doi: 10.1016/S0074-7742(06)81004-4. [DOI] [PubMed] [Google Scholar]
- Noguchi J, Nagaoka A, Watanabe S, Ellis-Davies GC, Kitamura K, Kano M, Matsuzaki M, Kasai H. In vivo two-photon uncaging of glutamate revealing the structure-function relationships of dendritic spines in the neocortex of adult mice. J Physiol. 2011;589:2447–57. doi: 10.1113/jphysiol.2011.207100. [DOI] [PMC free article] [PubMed] [Google Scholar]
- Oakley H, Cole SL, Logan S, Maus E, Shao P, Craft J, Guillozet-Bongaarts A, Ohno M, Disterhoft J, Van Eldik L, Berry R, Vassar R. Intraneuronal beta-amyloid aggregates, neurodegeneration, and neuron loss in transgenic mice with five familial Alzheimer’s disease mutations: potential factors in amyloid plaque formation. J Neurosci. 2006;26:10129–40. doi: 10.1523/JNEUROSCI.1202-06.2006. [DOI] [PMC free article] [PubMed] [Google Scholar]
- Ohno M, Cole SL, Yasvoina M, Zhao J, Citron M, Berry R, Disterhoft JF, Vassar R. BACE1 gene deletion prevents neuron loss and memory deficits in 5XFAD APP/PS1 transgenic mice. Neurobiol Dis. 2007;26:134–45. doi: 10.1016/j.nbd.2006.12.008. [DOI] [PMC free article] [PubMed] [Google Scholar]
- Ossenkoppele R, Tolboom N, Foster-Dingley JC, Adriaanse SF, Boellaard R, Yaqub M, Windhorst AD, Barkhof F, Lammertsma AA, Scheltens P, van der Flier WM, van Berckel BN. Longitudinal imaging of Alzheimer pathology using [11C]PIB, [18F]FDDNP and [18F]FDG PET. Eur J Nucl Med Mol Imaging. 2012;39:990–1000. doi: 10.1007/s00259-012-2102-3. [DOI] [PubMed] [Google Scholar]
- Pan F, Gan WB. Two-photon imaging of dendritic spine development in the mouse cortex. Dev Neurobiol. 2008;68:771–8. doi: 10.1002/dneu.20630. [DOI] [PubMed] [Google Scholar]
- Paulson JB, Ramsden M, Forster C, Sherman MA, McGowan E, Ashe KH. Amyloid plaque and neurofibrillary tangle pathology in a regulatable mouse model of Alzheimer’s disease. Am J Pathol. 2008;173:762–72. doi: 10.2353/ajpath.2008.080175. [DOI] [PMC free article] [PubMed] [Google Scholar]
- Price JL, Morris JC. Tangles and plaques in nondemented aging and “preclinical” Alzheimer’s disease. Ann Neurol. 1999;45:358–68. doi: 10.1002/1531-8249(199903)45:3<358::aid-ana12>3.0.co;2-x. [DOI] [PubMed] [Google Scholar]
- Price JL, Ko AI, Wade MJ, Tsou SK, McKeel DW, Morris JC. Neuron number in the entorhinal cortex and CA1 in preclinical Alzheimer disease. Arch Neurol. 2001;58:1395–402. doi: 10.1001/archneur.58.9.1395. [DOI] [PubMed] [Google Scholar]
- Rodriguez A, Ehlenberger DB, Dickstein DL, Hof PR, Wearne SL. Automated three-dimensional detection and shape classification of dendritic spines from fluorescence microscopy images. PLoS One. 2008;3:e1997. doi: 10.1371/journal.pone.0001997. [DOI] [PMC free article] [PubMed] [Google Scholar]
- Shankar GM, Bloodgood BL, Townsend M, Walsh DM, Selkoe DJ, Sabatini BL. Natural oligomers of the Alzheimer amyloid-beta protein induce reversible synapse loss by modulating an NMDA-type glutamate receptor-dependent signaling pathway. J Neurosci. 2007;27:2866–75. doi: 10.1523/JNEUROSCI.4970-06.2007. [DOI] [PMC free article] [PubMed] [Google Scholar]
- Shrestha BR, Vitolo OV, Joshi P, Lordkipanidze T, Shelanski M, Dunaevsky A. Amyloid beta peptide adversely affects spine number and motility in hippocampal neurons. Mol Cell Neurosci. 2006;33:274–82. doi: 10.1016/j.mcn.2006.07.011. [DOI] [PubMed] [Google Scholar]
- Snyder EM, Nong Y, Almeida CG, Paul S, Moran T, Choi EY, Nairn AC, Salter MW, Lombroso PJ, Gouras GK, Greengard P. Regulation of NMDA receptor trafficking by amyloid-beta. Nat Neurosci. 2005;8:1051–8. doi: 10.1038/nn1503. [DOI] [PubMed] [Google Scholar]
- Spires TL, Grote HE, Garry S, Cordery PM, Van Dellen A, Blakemore C, Hannan AJ. Dendritic spine pathology and deficits in experience-dependent dendritic plasticity in R6/1 Huntington’s disease transgenic mice. Eur J Neurosci. 2004;19:2799–807. doi: 10.1111/j.0953-816X.2004.03374.x. [DOI] [PubMed] [Google Scholar]
- Spires TL, Meyer-Luehmann M, Stern EA, McLean PJ, Skoch J, Nguyen PT, Bacskai BJ, Hyman BT. Dendritic spine abnormalities in amyloid precursor protein transgenic mice demonstrated by gene transfer and intravital multiphoton microscopy. J Neurosci. 2005;25:7278–87. doi: 10.1523/JNEUROSCI.1879-05.2005. [DOI] [PMC free article] [PubMed] [Google Scholar]
- Trachtenberg JT, Chen BE, Knott GW, Feng G, Sanes JR, Welker E, Svoboda K. Long-term in vivo imaging of experience-dependent synaptic plasticity in adult cortex. Nature. 2002;420:788–94. doi: 10.1038/nature01273. [DOI] [PubMed] [Google Scholar]
- Tsai J, Grutzendler J, Duff K, Gan WB. Fibrillar amyloid deposition leads to local synaptic abnormalities and breakage of neuronal branches. Nat Neurosci. 2004;7:1181–3. doi: 10.1038/nn1335. [DOI] [PubMed] [Google Scholar]
- Tsuchiya K, Takahashi M, Shiotsu H, Akiyama H, Haga C, Watabiki S, Taki K, Nakano I, Ikeda K. Sporadic amyotrophic lateral sclerosis with circumscribed temporal atrophy: a report of an autopsy case without dementia and with ubiquitinated intraneuronal inclusions. Neuropathology. 2002;22:308–16. doi: 10.1046/j.1440-1789.2002.00451.x. [DOI] [PubMed] [Google Scholar]
- Vassar R, Bennett BD, Babu-Khan S, Kahn S, Mendiaz EA, Denis P, Teplow DB, Ross S, Amarante P, Loeloff R, Luo Y, Fisher S, Fuller J, Edenson S, Lile J, Jarosinski MA, Biere AL, Curran E, Burgess T, Louis JC, Collins F, Treanor J, Rogers G, Citron M. Beta-secretase cleavage of Alzheimer’s amyloid precursor protein by the transmembrane aspartic protease BACE. Science. 1999;286:735–41. doi: 10.1126/science.286.5440.735. [DOI] [PubMed] [Google Scholar]
- Wearne SL, Rodriguez A, Ehlenberger DB, Rocher AB, Henderson SC, Hof PR. New techniques for imaging, digitization and analysis of three-dimensional neural morphology on multiple scales. Neuroscience. 2005;136:661–80. doi: 10.1016/j.neuroscience.2005.05.053. [DOI] [PubMed] [Google Scholar]
- Yan P, Bero AW, Cirrito JR, Xiao Q, Hu X, Wang Y, Gonzales E, Holtzman DM, Lee JM. Characterizing the appearance and growth of amyloid plaques in APP/PS1 mice. J Neurosci. 2009;29:10706–14. doi: 10.1523/JNEUROSCI.2637-09.2009. [DOI] [PMC free article] [PubMed] [Google Scholar]
- Yu G, Nishimura M, Arawaka S, Levitan D, Zhang L, Tandon A, Song YQ, Rogaeva E, Chen F, Kawarai T, Supala A, Levesque L, Yu H, Yang DS, Holmes E, Milman P, Liang Y, Zhang DM, Xu DH, Sato C, Rogaev E, Smith M, Janus C, Zhang Y, Aebersold R, Farrer LS, Sorbi S, Bruni A, Fraser P, St George-Hyslop P. Nicastrin modulates presenilin-mediated notch/glp-1 signal transduction and betaAPP processing. Nature. 2000;407:48–54. doi: 10.1038/35024009. [DOI] [PubMed] [Google Scholar]
- Zhang Q, Yang G, Li W, Fan Z, Sun A, Luo J, Ke ZJ. Thiamine deficiency increases beta-secretase activity and accumulation of beta-amyloid peptides. Neurobiol Aging. 2011;32:42–53. doi: 10.1016/j.neurobiolaging.2009.01.005. [DOI] [PubMed] [Google Scholar]
- Zhang XM, Cai Y, Xiong K, Cai H, Luo XG, Feng JC, Clough RW, Struble RG, Patrylo PR, Yan XX. Beta-secretase-1 elevation in transgenic mouse models of Alzheimer’s disease is associated with synaptic/axonal pathology and amyloidogenesis: implications for neuritic plaque development. Eur J Neurosci. 2009;30:2271–83. doi: 10.1111/j.1460-9568.2009.07017.x. [DOI] [PMC free article] [PubMed] [Google Scholar]
- Zhao J, Fu Y, Yasvoina M, Shao P, Hitt B, O’Connor T, Logan S, Maus E, Citron M, Berry R, Binder L, Vassar R. Beta-site amyloid precursor protein cleaving enzyme 1 levels become elevated in neurons around amyloid plaques: implications for Alzheimer’s disease pathogenesis. J Neurosci. 2007;27:3639–49. doi: 10.1523/JNEUROSCI.4396-06.2007. [DOI] [PMC free article] [PubMed] [Google Scholar]
- Zuo Y, Yang G, Kwon E, Gan WB. Long-term sensory deprivation prevents dendritic spine loss in primary somatosensory cortex. Nature. 2005;436:261–5. doi: 10.1038/nature03715. [DOI] [PubMed] [Google Scholar]