Fig. 4.

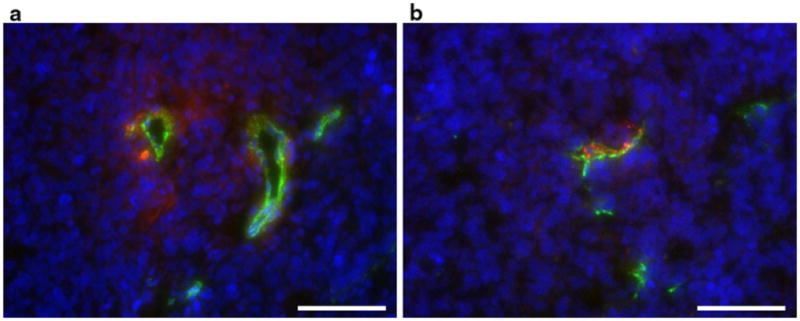
Histology. Tumor tissue containing CTRL (a) and RGD (b) nanoemulsion. Particles are shown in red, endothelial cells in green (CD31) and cell nuclei in blue (DAPI stain). The bars represent 100 μm

Histology. Tumor tissue containing CTRL (a) and RGD (b) nanoemulsion. Particles are shown in red, endothelial cells in green (CD31) and cell nuclei in blue (DAPI stain). The bars represent 100 μm