

Abstract
Background
Preclinical data demonstrate that gamma-aminobutyric acid (GABA) interneurons initiate connectivity in the developing brain.
Objectives
The goal of this study was to compare GABA concentration and its relationship to functional connectivity in the brains of term and preterm infants at term equivalent age.
Methods
Infants received both MRS and fMRI scans at term equivalent age. Whole brain functional connectivity MRI data using intrinsic connectivity distribution (ICD) maps were compared to identify areas with differences in resting state functional connectivity between the preterm and term control groups. MR spectroscopy measured concentrations of GABA, glutamate, N-acetyl-aspartate (NAA) and choline, and NAA/choline was calculated for comparison between the two groups.
Results
Preterm infants had lower right frontal GABA and glutamate concentrations than term controls and showed a significantly different relationship between connectivity and GABA concentration in the right frontal lobe. Preterm infants had a positive correlation between GABA concentration and connectivity, while term controls demonstrated a negative correlation between these two developmentally-regulated parameters.
Conclusion
These results suggest that regional GABA concentrations are associated with normal and altered neonatal resting state connectivity.
Keywords: preterm, magnetic resonance imaging, resting state functional connectivity, gamma-aminobutyric acid, magnetic resonance spectroscopy, intrinsic connectivity distribution
Introduction
A major focus of perinatal care is the development of strategies to prevent adverse outcomes in the prematurely-born, yet the fundamental alterations in brain development responsible for these changes remain poorly understood.[1] Advanced magnetic resonance imaging (MRI) strategies provide important information about the impact of preterm birth on brain development, and functional connectivity studies demonstrate alterations in neural circuitry in preterm subjects compared to term controls in the neonatal period, at school age and during young adulthood.[2]
Preclinical data suggest that early gamma-aminobutyric acid (GABA) signaling is necessary for the proper development of neural networks.[3] Because GABA interneurons undergo a protracted phase of development across the second and third trimesters of gestation,[4] they may be susceptible to insults associated with prenatal stress and/or preterm birth. In a preclinical model of prenatal stress, the density of GABA-progenitor cells are decreased in the cortical plate secondary to a delay in migration.[5] Likewise, preclinical and postmortem studies of prematurely-born subjects with presumed hypoxic injury demonstrate loss of GABA interneurons.[6,7]
Evidence from prior studies has shown that there are longitudinal changes in connectivity during the putative third trimester of gestation[8] and significant differences in connectivity between preterm neonates and term controls at term equivalent age, but the cellular mechanisms responsible for these changes remain largely unknown.[8,9]
Since our previous studies demonstrate regional decreases in resting state intrinsic connectivity in preterm adolescents compared with term controls and the endogenous resting concentration of GABA may be measured using edited magnetic resonance spectroscopy (MRS),[10,11] in this pilot study we tested the hypothesis that regional GABA concentration would predict connectivity in the prematurely-born.
Methods
This study was approved by the Yale University institutional review board; parent(s) provided written consent.
Subjects
Preterm neonates with a birth weight (BW) between 500-1500 grams and healthy term controls born between 37 and 41 weeks' postmenstrual age (PMA) were eligible for the pilot protocol and prospectively enrolled between 9-01-10 and 10-31-13. All were inborn and appropriate for gestational age (AGA). Exclusion criteria included evidence of congenital infections, congenital malformations and/or chromosomal disorders, seizures, Grade 3 or 4 intraventricular hemorrhage (IVH), periventricular leukomalacia or focal abnormalities on a MRI.
GABA-edited MR spectra
Subjects were scanned without sedation using a feed-and-wrap protocol in a 3 T Siemens (Erlangen, Germany) TIM Trio MR system with a 32-channel parallel receiver head coil. GABA-edited spectra were acquired using the MEGA-PRESS method[12] from a 2×3×3 cm3 region of interest localized over the R frontal region based on prior studies demonstrating decreased resting state connectivity in that region correlated with lower executive functioning scores.[13] Figure 1 shows the composite location of all individuals' GABA voxel. (TR=1500ms, TE=68ms, Flip angle=90°, Bandwidth=1200 Hz).
Figure 1.
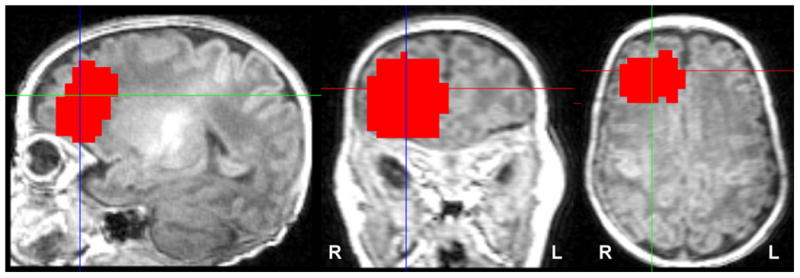
Location of GABA voxel. GABA spectra were collected from a single 2×3×3 cm3 region of interest localized over the R frontal region. The red area shows a composite of all individuals' regions overlaid on common space template. Images are displayed in radiological convention.
Separate 5 minute scans without water suppression were acquired in the same volume and with the same parameters to allow normalization.
Analysis of the GABA-edited spectra
Spectra were processed with three-hertz Gaussian exponential line broadening and a high-pass water filter was applied. The edited GABA signal at 3 ppm and unsuppressed PRESS water signal were integrated, and concentrations calculated from the ratio in institutional units. Differences in underlying macromolecules were assessed by fitting the coedited 0.9 ppm macromolecule peak which is stoichiometric with the co-edited 3.0 ppm macromolecule resonance.[14] Data were corrected for their water spectra and gray matter volume within the designated voxel (ie, “GABA/H20/gray matter volume”) and are reported as GABA units/mm3.
Spectra were collected for glutamate, N-acetylaspartate (NAA) and choline as previously described.[14].
fMRI imaging parameters, preprocessing and registration to a common space
MRS measurements were followed by a high-resolution 3D acquisition, a T1-weighted anatomical scan and acquisition of resting state functional connectivity data as described.[15]
Localizer images were acquired for prescribing the functional image volumes, aligning the seventh or eighth slice parallel to the plane transecting the anterior and posterior commissures. T1-weighted 2D anatomical images were collected (TR=300ms, TE=2.47ms, FoV=220mm, matrix size=256×256, slice thickness=4mm, Flip Angle=60°, Bandwidth=300Hz/pixel with 25 slices) with 25 AC-PC aligned axial-oblique slices in addition to 3D anatomical scans using Magnetization Prepared Rapid Gradient Echo (MPRAGE) (176 contiguous sagittal slices, slice thickness=1mm, matrix size=256×256, FoV=256mm, TR=2530ms, TE=2.77, Flip Angle=7°, Bandwidth=179Hz/pixel). After these structural images, acquisition of functional data began in the same slice locations as the axial-oblique T1-weighted data. Functional images were collected using an echo-planar image gradient echo pulse sequence (TR=1500ms, TE=27ms, FoV=220mm, matrix size=64×64, slice thickness=4mm, Flip Angle=60°, Bandwidth=2520Hz/pixel, 25 slices). Functional runs consisted of 186 volumes (approximately 5 min scan length) after the first 6 volumes were removed to allow the magnetization to reach the steady-state. All subjects had at least two functional runs.
fMRI Analysis
Data analyses were performed as previously described.[15] Briefly, data were converted from Digital Imaging and Communication in Medicine format to analyze format using XMedCon (http://xmedcon.sourceforge.net/). Images were slice-time-corrected and motion-corrected using SPM5 (http://www.fil.ion.ucl.ac.uk/spm/software/spm5/). All further analysis was performed using BioImage Suite.[16] Several covariates of no interest were regressed from the data including linear and quadratic drift, six rigid-body motion parameters, mean cerebral-spinal-fluid (CSF) signal, mean white-matter signal, and overall global signal. The data were temporally smoothed with a zero mean unit variance Gaussian filter (approximate cutoff frequency=0.12Hz). A gray-matter mask was applied to the data so only voxels in the gray matter were used in the calculation.
After preprocessing, the functional connectivity of each voxel as measured by the intrinsic connectivity distribution (ICD) was calculated for each individual subject as described previously.[15] Similar to most voxel-based connectivity measures,[17] ICD involves correlating the time course for any voxel “x” with every other time course in the brain and then summarizing these correlations using a network theory measure. Specifically, ICD models the entire distribution of the network measure of degree eliminating the need to specify a connection threshold. As global mean regression makes the signs of the correlation ambiguous, we only focus on the positive correlation.[18] A histogram of these positive correlations was constructed to estimate the distribution of connections to the current voxel. This distribution of connections was converted to a survival function and the survival function was fitted with a stretched exponential with unknown variance, α. As alpha controls the spread of the distribution, a larger alpha indicates a greater number of high correlation connections. Finally, this process is repeated for all voxels in the gray matter resulting in a parametric image of the alpha parameter for each subject.
To interrogate relative differences in connectivity, each subject's map was normalized by subtracting the mean across all voxels and dividing by the standard deviation across all voxels. This z-score-like normalization does not change the underlying connectivity pattern but allows for investigation of relative differences in connectivity in the presence of large global differences in connectivity. Finally, all single subject results were spatially smoothed with a 6mm Gaussian filter and warped to a common space through the concatenation of a series of linear and non-linear registrations as previously described.[19]
As motion has been shown to confound connectivity studies[20], the average frame-to-frame displacement of each resting-state scan was computed. The metric combines both translational and rotational movement into a single number for each subject summarizing their motion. To minimize confounds, blocks of data with motion greater than 0.1mm were removed. For preterm infants, an average of 31.4 frames was removed. For term controls, an average of 44.8 frames was removed. For the final analysis, the average frame-to-frame displacement was 0.045mm±0.015 for the preterm infants and 0.058mm±0.036 for the term controls. There were no significant differences in the number of frames removed from analysis, number of frames used for analysis, or for motion when preterm infants were compared to term controls (p=0.78, p=0.62, and p=0.26, respectively).
Statistical analyses
Demographic data and neurotransmitter concentrations were analyzed using Student's t-test and Fisher's exact test. Cook's distance (Cook's D) was employed to identify potentially influential outliers. P values < 0.05 were considered significant. Analyses were performed using SPSS 19.0.
To assess the relationship between GABA concentration and ICD data for each group, a voxel-wise Pearson correlation analysis between ICD in the R frontal lobe and GABA concentration was performed for only voxels in the R frontal lobe. Correlations were converted using the Fisher transformation and were compared using a t-test. Results are shown at a voxel-level threshold of p<0.05 family-wise error (FWE) correction as determined by AFNI's AlphaSim program.
Results
Forty five neonates (20 preterm and 25 term) participated in this pilot protocol. MRS data are available for 18 preterm (90%) and 21 term (84%) neonates, while fMRI data are available for 12 preterm and 16 term neonates. Subjects excluded from the analysis are shown in Figure 2.
Figure 2.
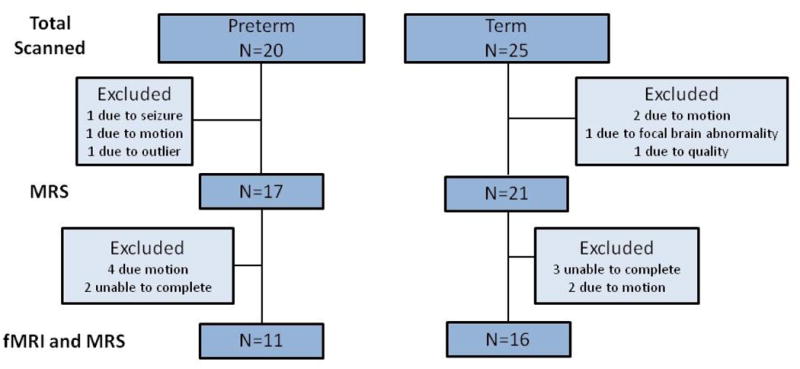
Chart of usable MRS and fMRI data. This flow chart shows total subjects scanned and number of subjects excluded.
An additional preterm subject was found to be an outlier for the ICD analyses (subject Cook's D 0.365; model Cook's D 0.0386) and was also omitted from the analyses.
The characteristics of the study infants are shown in Table 1. There were no significant differences in mean PMA at scan, gender or race between the preterm and term neonates.
Table 1. Characteristics of study subjectsa.
| Preterm (n=17) |
Term (n=21) |
p-value | |
|---|---|---|---|
| Postmenstrual age at birth (weeks) | 27 ± 1.8 | 40 ± 1 | < 0.001 |
| Birth weight (grams) | 970 ± 280 | 3450 ± 460 | < 0.001 |
| Postmenstrual age at scan (weeks) | 42.6 ± 1.0 | 42.5 ± 1.8 | 0.71 |
| Male gender | 4 (24%) | 11 (52%) | 0.1 |
| Non-white | 10 (59%) | 8 (38%) | 0.19 |
| Intraventricular hemorrhageb | 3 (18%) | ||
| Bronchopulmonary dysplasia | 7 (39%) | ||
| Retinopathy of prematurity | 7 (41%) | ||
| Necrotizing enterocolitis | 1 (6%) | ||
| Late-onset sepsis | 1 (6%) |
values are mean ± SD;
4 neonates had germinal matrix hemorrhage
Preterm subjects had lower regional GABA and glutamate concentrations than term controls (p=0.049 and 0.005, respectively), but there was no significant difference in the NAA/choline ratio (Table 2). There were regions of large ICD detected in previously identified hub regions in term infants (Figure 3A).[21] However, these hub regions were less detectable in preterm infants (Figure 3B). ICD was decreased in the preterm infants compared to term controls in Brodmann areas (BA) R BA9, R BA44, R BA45, R BA47, L BA47, anterior cingulate and insula (p<0.05) (Figure 3C).
Table 2. Comparison of MR Spectroscopy data between groups.
| Preterm (n=17) |
Term (n=21) |
p-value | |
|---|---|---|---|
| Gray matter volume in MRS voxel (mm3) | 9.8 ± 1.3 | 8.7 ± 1.9 | 0.03 |
| GABA concentrationa | 0.013 ± 0.004 | 0.016 ± 0.004 | 0.049 |
| Glutamate concentrationa | 0.031 ± 0.008 | 0.042 ± 0.01 | 0.005 |
| NAA/choline | 1.14 ± 0.39 | 1.12 ± 0.18 | 0.79 |
GABA and glutamate are corrected for the water spectrum and for gray matter volume
Figure 3.
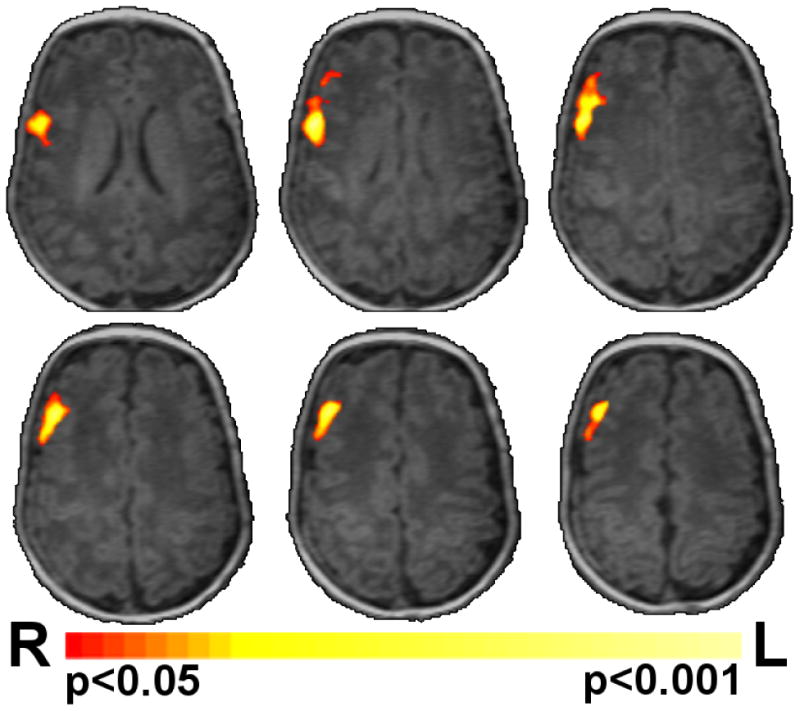
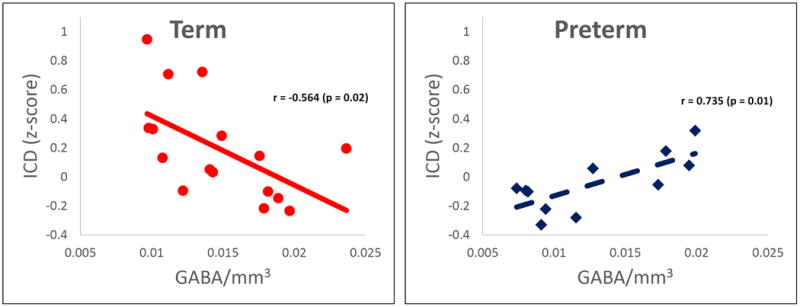
Correlation of connectivity and GABA. A) Preterm infants showed a significantly (p<0.05 corrected) different relationship between connectivity and GABA in the right frontal lobe when compared to term controls (Figure 3A). This region of significantly different correlations between the experimental groups is shown in red/yellow colors on a template brain. B) Scatter plots of the data from this region are shown in Panels B and C. Term controls showed a negative correlation between connectivity and GABA (Figure 3B), whereas preterm infants showed a positive correlation between connectivity and GABA (Figure 3C). Images are displayed in radiological convention.
As shown in Figure 3A, preterm infants showed a significantly different relationship between ICD and GABA in R BA9, BA44 and BA6 when compared to term control neonates (p<0.05 corrected). ICD values for this region for the preterm and term controls were -0.047 and 0.192, respectively (p=0.03). Scatter plots of the data from this ROI demonstrated a negative correlation between connectivity and GABA concentration (r=-0.564, p=0.02) for the term control subjects (Figure 3B). In contrast, a positive correlation was found between ICD and GABA for the preterm neonates (r=0.735, p=0.01), as shown in Figure 3C.
Similar analyses were performed for resting state ICD and birth weight, postmenstrual age at scan, glutamate/mm3, and the NAA/choline ratio; no significant correlations were found.
Discussion
These preliminary data are, to the best of our knowledge, the first to demonstrate that regional GABA concentrations are significantly correlated to resting state connectivity in the prematurely-born. Consistent with preclinical data, the preterm infants in our study had lower R frontal GABA and glutamate concentrations than term controls. In addition, preterm infants showed a significantly different relationship between connectivity and GABA concentration in the right frontal lobe when compared to term controls. Preterm infants had a positive correlation between R frontal GABA concentration and ICD in R BA9, BA44 and BA6, while term controls demonstrated a negative correlation between these two developmentally-regulated parameters in this region. These regions subserve both language and executive function and may contribute to the cognitive and behavioral difficulties reported in preterm subjects at school age and adolescence. Finally, we found no group difference in NAA/choline, a reported marker for neuronal number.
Previous voxel-by-voxel and seed-based studies of resting state connectivity elegantly demonstrate the emergence of resting state connectivity throughout the putative ex-utero third trimester of gestation and show differential patterns in preterm neonates compared to term controls at term equivalent age.[8,9] Although MRS measurements of NAA suggest that clinical events may alter microstructural thalamocortical connectivity,[23] and preterm infants with the highest severity of illness scores demonstrate the most deficits in resting state connectivity,[24] the mechanisms responsible for these findings remain unclear.
GABA is the major inhibitory neurotransmitter in the brains of older infants, children and adults, but in fetuses and newborn infants, activation of chloride-permeable GABAA receptors results in excitatory phenomena. This early excitation depends on elevated intracellular Cl- concentrations and is mediated by the Na+-K+-2Cl- co-transporter (NKCC1), a developmentally regulated protein reported to be in abundance at 40 weeks PMA. The developmental switch in GABA from excitatory to inhibitory reportedly occurs in the weeks following term delivery, consistent with a decline in NKCC1 expression and increases in the Cl--extruding K+-Cl- co-transporter, KCC2. The negative correlation between ICD and R frontal GABA demonstrated by the control subjects in this study mimics that found in adults,[25-27] suggesting a delay in maturation in the prematurely-born.[28]
The strengths of this translational pilot study are the ability to measure GABA in vivo in infants, and the demonstration of different relationships between this neurotransmitter and ICD in the right frontal lobe in preterm neonates and control subjects at term equivalent age. Limitations include subject number, lack of a control region and the inability to specifically identify the cellular location of GABA. The majority of GABA is located in two pools with very different functions in cortical neurons -- the cytoplasm and presynaptic vesicles. Our pilot studies were only capable of detecting total GABA within the prescribed localized region, and thus we cannot differentiate these. Finally, although voxel-based methods such as ICD eliminate the need of a priori information to define ROIs, these measures lose any spatial information about the connectivity changes to a specific voxel. Further analyses are needed to specify which regions are responsible for the changes in connectivity we report. Advances in MRS technology such as chemical shift imaging, the adaptation of ultra-high field MR for use in neonates and the investigation of preclinical models will most certainly increase our knowledge about the many roles GABA plays in cerebral maturation.[27,29,30]
The cellular mechanisms driving connectivity in the developing brain continue to be explored. Our pilot data suggest not only alterations in neural networks in preterm neonates compared to term controls at term equivalent age, but also demonstrate for the first time that GABA concentrations are lower in infants born preterm. Changes in GABA concentrations may contribute primarily to alterations in functional connectivity in preterm infants, and secondarily to the development of neurodevelopmental disorders in the future.
Acknowledgments
We are indebted to our medical, nursing and research colleagues and the infants and their parents who agreed to take part in this study. We are also grateful to Deborah Hirtz, M.D., and Flora Vaccarino, M.D., for scientific expertise, and to Hedwig A. Sarofin R.T.R., M.R., A.R.R.T. and Terry L. Hickey, R.T.R., N.M., M.R. for technical expertise.
Supported by NIH NS074022 and T32 HD07094
Abbreviations
- AGA
Appropriate for gestational age
- BW
Birth weight
- BA
Brodmann area
- fMRI
Functional magnetic resonance imaging
- GABA
Gamma-aminobutyric acid
- ICD
Intrinsic connectivity distribution
- IVH
Intraventricular hemorrhage
- MRI
Magnetic resonance imaging
- MRS
Magnetic resonance spectroscopy
- NAA
N-acetylaspartate
- PMA
Postmenstrual age
References
- 1.Volpe JJ. Brain injury in premature infants: A complex amalgam of destructive and developmental disturbances. Lancet Neurol. 2009;8:110–124. doi: 10.1016/S1474-4422(08)70294-1. [DOI] [PMC free article] [PubMed] [Google Scholar]
- 2.Ment LR, Constable RT. Injury and recovery in the developing brain: Evidence from functional MRI studies of prematurely born children. Nat Clin Pract Neurol. 2007;3:558–571. doi: 10.1038/ncpneuro0616. [DOI] [PMC free article] [PubMed] [Google Scholar]
- 3.Petanjek Z, Kostovic I, Esclapez M. Primate-specific origins and migration of cortical GABAergic neurons. Front Neuroanat. 2009;3:26. doi: 10.3389/neuro.05.026.2009. [DOI] [PMC free article] [PubMed] [Google Scholar]
- 4.Xu G, Broadbelt KG, Haynes RL, Folkerth RD, Borenstein NS, Belliveau RA, Trachtenberg FL, Volpe JJ, Kinney HC. Late development of the GABAergic system in the human cerebral cortex and white matter. J Neuropathol Exp Neurol. 2011;70:841–858. doi: 10.1097/NEN.0b013e31822f471c. [DOI] [PMC free article] [PubMed] [Google Scholar]
- 5.Stevens HE, Su T, Yanagawa Y, Vaccarino FM. Prenatal stress delays inhibitory neuron progenitor migration in the developing neocortex. Psychoneuroendocrinology. 2013;38:509–521. doi: 10.1016/j.psyneuen.2012.07.011. [DOI] [PMC free article] [PubMed] [Google Scholar]
- 6.Robinson S, Li Q, Dechant A, Cohen ML. Neonatal loss of gamma-aminobutyric acid pathway expression after human perinatal brain injury. J Neurosurg. 2006;104:396–408. doi: 10.3171/ped.2006.104.6.396. [DOI] [PMC free article] [PubMed] [Google Scholar]
- 7.Mallard EC, Waldvogel HJ, Williams CE, Faull RL, Gluckman PD. Repeated asphyxia causes loss of striatal projection neurons in the fetal sheep brain. Neuroscience. 1995;65:827–836. doi: 10.1016/0306-4522(94)00504-x. [DOI] [PubMed] [Google Scholar]
- 8.Smyser CD, Inder TE, Shimony JS, Hill JE, Degnan AJ, Snyder AZ, Neil JJ. Longitudinal analysis of neural network development in preterm infants. Cereb Cortex. 2010;20:2852–2862. doi: 10.1093/cercor/bhq035. [DOI] [PMC free article] [PubMed] [Google Scholar]
- 9.Doria V, Beckmann CF, Arichi T, Merchant N, Groppo M, Turkheimer FE, Counsell SJ, Murgasova M, Aljabar P, Nunes RG, Larkman DJ, Rees G, Edwards AD. Emergence of resting state networks in the preterm human brain. Proc Natl Acad Sci U S A. 2010;107:20015–20020. doi: 10.1073/pnas.1007921107. [DOI] [PMC free article] [PubMed] [Google Scholar]
- 10.Muthukumaraswamy SD, Edden RA, Jones DK, Swettenham JB, Singh KD. Resting GABA concentration predicts peak gamma frequency and fMRI amplitude in response to visual stimulation in humans. Proc Natl Acad Sci U S A. 2009;106:8356–8361. doi: 10.1073/pnas.0900728106. [DOI] [PMC free article] [PubMed] [Google Scholar]
- 11.Lubsen J, Vohr B, Myers E, Hampson M, Lacadie C, Schneider KC, Katz KH, Constable RT, Ment LR. Microstructural and functional connectivity in the developing preterm brain. Semin Perinatol. 2011;35:34–43. doi: 10.1053/j.semperi.2010.10.006. [DOI] [PMC free article] [PubMed] [Google Scholar]
- 12.Bogner W, Gruber S, Doelken M, Stadlbauer A, Ganslandt O, Boettcher U, Trattnig S, Doerfler A, Stefan H, Hammen T. In vivo quantification of intracerebral GABA by single-voxel (1)H-MRS-how reproducible are the results? Eur J Radiol. 2010;73:526–531. doi: 10.1016/j.ejrad.2009.01.014. [DOI] [PubMed] [Google Scholar]
- 13.Lubsen JR, Mullen KM, Vohr BR, Katz KH, Schneider KC, Lacadie C, Constable RT, Ment LR. Long-term alterations in interhemispheric microstructural connectivity in preterm subjects attributable to low grade intraventricular hemorrhage. PAS Abstracts. 2010;130 [Google Scholar]
- 14.Behar KL, Rothman DL, Spencer DD, Petroff OA. Analysis of macromolecule resonances in 1H NMR spectra of human brain. Magn Reson Med. 1994;32:294–302. doi: 10.1002/mrm.1910320304. [DOI] [PubMed] [Google Scholar]
- 15.Scheinost D, Benjamin J, Lacadie CM, Vohr B, Schneider KC, Ment LR, Papademetris X, Constable RT. The intrinsic connectivity distribution: A novel contrast measure reflecting voxel level functional connectivity. Neuroimage. 2012;62:1510–1519. doi: 10.1016/j.neuroimage.2012.05.073. [DOI] [PMC free article] [PubMed] [Google Scholar]
- 16.Joshi A, Scheinost D, Okuda H, Belhachemi D, Murphy I, Staib LH, Papademetris X. Unified framework for development, deployment and robust testing of neuroimaging algorithms. Neuroinformatics. 2011;9:69–84. doi: 10.1007/s12021-010-9092-8. [DOI] [PMC free article] [PubMed] [Google Scholar]
- 17.Cole MW, Pathak S, Schneider W. Identifying the brain's most globally connected regions. Neuroimage. 2010;49:3132–3148. doi: 10.1016/j.neuroimage.2009.11.001. [DOI] [PubMed] [Google Scholar]
- 18.Buckner RL, Sepulcre J, Talukdar T, Krienen FM, Liu H, Hedden T, Andrews-Hanna JR, Sperling RA, Johnson KA. Cortical hubs revealed by intrinsic functional connectivity: Mapping, assessment of stability, and relation to alzheimer's disease. J Neurosci. 2009;29:1860–1873. doi: 10.1523/JNEUROSCI.5062-08.2009. [DOI] [PMC free article] [PubMed] [Google Scholar]
- 19.Papademetris X, Jackowski A, Schultz R, Staib L, Duncan J, Barillot C, Haynor D, Hellier P. Integrated intensity and point-feature nonrigid registration. In: Barillot C, Haynor DR, Falcao e Cunha J, Hellier P, editors. Medical image computing and computer-assisted intervention-MICCAI 2004. Vol. 3216. Springer; 2004. pp. 763–770. [DOI] [PMC free article] [PubMed] [Google Scholar]
- 20.Van Dijk KR, Sabuncu MR, Buckner RL. The influence of head motion on intrinsic functional connectivity MRI. Neuroimage. 2012;59:431–438. doi: 10.1016/j.neuroimage.2011.07.044. [DOI] [PMC free article] [PubMed] [Google Scholar]
- 21.Fransson P, Aden U, Blennow M, Lagercrantz H. The functional architecture of the infant brain as revealed by resting-state fMRI. Cereb Cortex. 2011;21:145–154. doi: 10.1093/cercor/bhq071. [DOI] [PubMed] [Google Scholar]
- 22.Malik S, Vinukonda G, Vose LR, Diamond D, Bhimavarapu BB, Hu F, Zia MT, Hevner R, Zecevic N, Ballabh P. Neurogenesis continues in the third trimester of pregnancy and is suppressed by premature birth. J Neurosci. 2013;33:411–423. doi: 10.1523/JNEUROSCI.4445-12.2013. [DOI] [PMC free article] [PubMed] [Google Scholar]
- 23.Brummelte S, Grunau RE, Chau V, Poskitt KJ, Brant R, Vinall J, Gover A, Synnes AR, Miller SP. Procedural pain and brain development in premature newborns. Ann Neurol. 2012;71:385–396. doi: 10.1002/ana.22267. [DOI] [PMC free article] [PubMed] [Google Scholar]
- 24.Smith GC, Gutovich J, Smyser C, Pineda R, Newnham C, Tjoeng TH, Vavasseur C, Wallendorf M, Neil J, Inder T. Neonatal intensive care unit stress is associated with brain development in preterm infants. Ann Neurol. 2011;70:541–549. doi: 10.1002/ana.22545. [DOI] [PMC free article] [PubMed] [Google Scholar]
- 25.Donahue MJ, Near J, Blicher JU, Jezzard P. Baseline GABA concentration and fMRI response. Neuroimage. 2010;53:392–398. doi: 10.1016/j.neuroimage.2010.07.017. [DOI] [PubMed] [Google Scholar]
- 26.Muthukumaraswamy SD, Evans CJ, Edden RA, Wise RG, Singh KD. Individual variability in the shape and amplitude of the bold-HRF correlates with endogenous GABAergic inhibition. Hum Brain Mapp. 2012;33:455–465. doi: 10.1002/hbm.21223. [DOI] [PMC free article] [PubMed] [Google Scholar]
- 27.Kapogiannis D, Reiter DA, Willette AA, Mattson MP. Posteromedial cortex glutamate and GABA predict intrinsic functional connectivity of the default mode network. Neuroimage. 2013;64:112–119. doi: 10.1016/j.neuroimage.2012.09.029. [DOI] [PMC free article] [PubMed] [Google Scholar]
- 28.Robinson S, Mikolaenko I, Thompson I, Cohen ML, Goyal M. Loss of cation-chloride cotransporter expression in preterm infants with white matter lesions: Implications for the pathogenesis of epilepsy. J Neuropathol Exp Neurol. 2010 doi: 10.1097/NEN.0b013e3181dd25bc. [DOI] [PMC free article] [PubMed] [Google Scholar]
- 29.Stagg CJ, Bachtiar V, Johansen-Berg H. What are we measuring with GABA magnetic resonance spectroscopy? Commun Integr Biol. 2011;4:573–575. doi: 10.4161/cib.4.5.16213. [DOI] [PMC free article] [PubMed] [Google Scholar]
- 30.Hyder F, Patel AB, Gjedde A, Rothman DL, Behar KL, Shulman RG. Neuronal-glial glucose oxidation and glutamatergic-GABAergic function. J Cereb Blood Flow Metab. 2006;26:865–877. doi: 10.1038/sj.jcbfm.9600263. [DOI] [PubMed] [Google Scholar]