I. INTRODUCTION
Breast cancer is the most common cancer and the second leading cause of cancer death in women in Western countries [1]. Imaging is a crucial part of a patient’s workup, and dynamic contrast-enhanced MRI (DCE-MRI) of the breast is a promising modality due to its ability to characterize the kinetic and morphological behavior of breast lesions [2–7].
However, interpretation of breast DCE-MRI exams may be hindered by inter- and intra-observer variability, time-demanding methods, and limited clinical reading guidelines [8–11]. Computer-aided diagnosis (CADx) aims to improve the assessment of breast lesions by generating quantitative markers to characterize lesions, in particular diagnostic characterization in differentiating malignant and benign lesions [12–19]. In addition to determining whether the breast lesion is malignant or benign, clinicians aim to assess the prognostic nature of malignant lesion during their decision making process for recommending a specific therapeutic protocol. One of the important prognostic markers is the histological grade of a malignant breast tumor. Tumors are graded on a scale of 1 to 3 based on gland formation, nuclear atypia, and mitotic activity of the malignant cells according to the Scarff-Bloom-Richardson (SBR) system. High grade cancerous tissue exhibits limited to no tubule formation, markedly enlarged cell nuclei that are at least 3 times larger than normal cell nuclei, and numerous mitotic bodies indicative of high mitotic activity. The higher the numeric grade, the more ‘poorly differentiated’ are the cells within the tumor and the worse the prognosis [20–23]. Tabar reported that in a dataset of 1973 breast tumors, the 14-year survival rate for ductal Grade 1 was 87% compared to 58% for ductal Grade 3 [20].
Bayesian artificial neural networks (BANN) are a well-known estimation tool used in breast MRI CADx for feature selection [24] and classification [25, 26]. A BANN adequately estimates a mapping function from an input space to a set of a posteriori class membership probabilities. These probabilities are one-to-one transformations of the likelihood ratios which are the optimal decision variables used by the so-called ideal observer [27, 28]. Computerized prognostic characterization with respect to invasion and lymph node status using two-class BANNs has been investigated [29]. Since tumor grade consists of three classes, it follows that distinguishing grades 1, 2, and 3 is a three-way classification task. Thus, three-class BANNs may be applicable. Studies of N-class classification have been done with malignant, benign, and false-positive computer detections in mammography [30, 31].
To our knowledge, previous research has not explored breast MRI CADx as a biomarker for tumor grade. Thus, our study is novel in exploring computer-extracted morphological and kinetic features from DCE-MRI in their ability to distinguish between invasive ductal carcinoma (IDC) lesions of Grade 1, Grade 2, and Grade 3. Additionally we evaluated the performance of three-class BANN feature selection and classification method in automatically distinguishing these three tumor grades. Our overall purpose was to determine whether our CADx algorithm could be extended from diagnosis to prognosis with the ultimate goal of generating MRI-based prognostic markers for breast lesions.
II MATERIALS AND METHODS
A. Image Database
The study was an IRB-approved, HIPAA-compliant study in which the requirement for informed consent was waived. In a review of 600 consecutive MR examinations conducted at the University of Chicago Medical Center (UCMC) between April 2002 and October 2005, a total of 170 malignant lesions were found including 26 IDC Grade 1 lesions, 86 IDC Grade 2 lesions, 58 IDC Grade 3 lesions in 158 female patients (mean age, 56.8 yrs ± 12.9; range, 29–88 years). Lesions of mixed histological type (e.g. IDC and DCIS) or different histological type (e.g. invasive lobular carcinoma (ILC), mucinous carcinoma) were excluded. Each lesion was analyzed and reported by experienced pathologists, and evaluated at a multidisciplinary breast cancer management conference.
The patients were scanned in prone position using a standard double breast coil. Images were acquired using a T1-weighted 3D spoiled gradient recalled (SPGR) sequence with no fat suppression (7.7/4.2 [repetition time msec/echo time msec], 30° flip angle) on a 1.5T whole-body MRI system (GE Medical Systems, Milwaukee, WI). After precontrast series was taken, a fixed 20cc dose of gadolinium-diethylenetriamine penta-acetic acid (Gd-DTPA) contrast agent was given intravenously followed by a 20mL saline flush. Three to five postcontrast series were acquired at 68-second intervals. Each series had 60 coronal slices, and slice thickness ranged 2–5mm depending on breast size. Each slice was a matrix of 256 × 256 pixels with in-plane resolution of 1.4×1.4 mm2.
B. Methods of Analyses
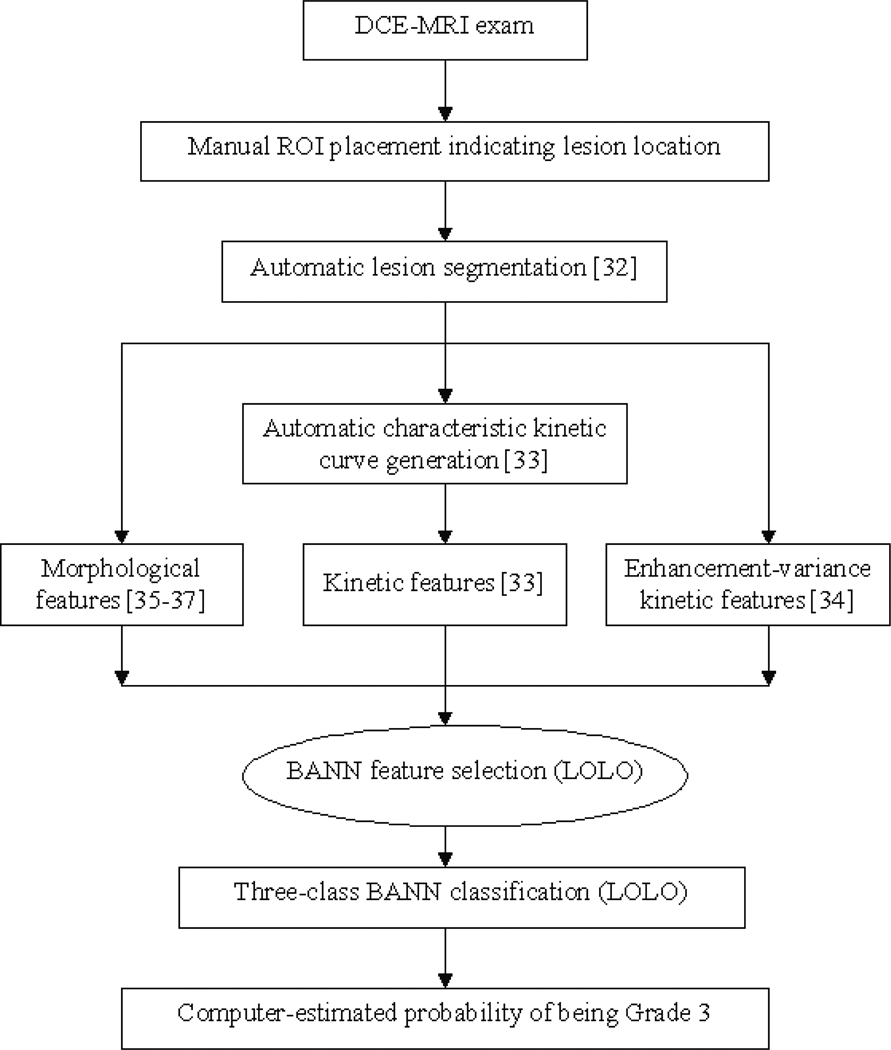
Our computerized analysis, outlined in Figure 1, was performed on the breast DCE-MRI exams. The identification of lesion location was the only manual step; lesion segmentation, feature extraction, and classification were performed automatically in real-time. In the 3-D segmentation of each lesion, a fuzzy c-means clustering method (FCM) used the contrast enhancement of the lesion over time to generate a membership map that categorized each image voxel as lesion or non-lesion. Additional processing steps including connected-component labeling and hole-filling were employed to generate the final lesion segmentation [32].
Figure 1.
Scheme of automated analysis of breast lesions using DCE-MRI; BANN=Bayesian artificial neural network, LOLO=leave-one-lesion-out
Several categories of features were then extracted. Kinetic features describe the degree of uptake and washout of contrast over time. FCM was utilized to cluster the different kinetic time course curves within the lesion, and the FCM-category kinetic curve with highest initial enhancement (i.e., the characteristic kinetic curve) was used to generate the kinetic features [33]. Enhancement-variance kinetic features, which track the change in the spatial variance of enhancement within the lesion over time, were also generated [34].
Mathematical texture descriptors were calculated using the 3-D gray-level co-occurrence matrix (GLCM) method. The GLCM is based on second-order statistics and summarizes how often one gray level will appear in a specified spatial relationship to another gray level in the image. The GLCM-based features quantified different texture characteristics of the lesion including heterogeneity, ‘smoothness’, and correlation [35, 36].
Geometric features (size or volume, sphericity, and irregularity) were based on the lesion segmentation outline. Sphericity describes the compliance of the lesion to a sphere while irregularity quantifies the roughness of the lesion surface [37]. The final feature category, spiculation, consisted of margin sharpness, variance of margin sharpness, and radial gradient index (RGI) [37]. RGI assesses how well the image structures in a lesion radiate from the lesion center [37]. Detailed descriptions of lesion features can be found in the references [33–37].
The following discrimination tasks of breast lesions were evaluated: Grade 1 vs. Grade 3 lesions, Grade 2 vs. Grade 3, and Grade 1 vs. Grade 2. Since the prognostic task of distinguishing Grade 1 from higher-grade lesions is also important, we evaluated the Grade 1 vs. Grades 2 and 3 lesions task.
For the next steps in our automatic analysis, feature selection and classification, BANN were utilized. A review of the derivation of the three-class BANN decision variables can be found in the Appendix.
Feature selection is necessary to eliminate redundant or weak features. In stepwise feature selection, features are iteratively added or removed from a group of selected features based on the Wilks lambda criterion [38]. The Wilks lambda criterion [39] was modified to the three-class problem by using:
| (1) |
where uj, vj, and wj are the output from the BANN for the Grade 1 lesions, Grade 2 lesions, and Grade 3 lesions, respectively, and u̅, v̅, w̅, and a are the mean output for Grade 1 lesions, Grade 2 lesions, Grade 3 lesions, and all lesions, respectively. The number of Grade 1 lesions, Grade 2 lesions, and Grade 3 lesions are Nu, Nv, and Nw, respectively. The end result of the stepwise feature selection was a feature histogram showing the frequency at which each feature was selected during the iterations. A cut-off threshold was set empirically at 50% of the highest feature frequency, and features whose frequencies were larger than the threshold were chosen for the Grade 3 vs. Grade 2 vs. Grade 1 classification task.
The selected lesion features were then merged by a BANN classifier to yield the probability of being a Grade 3 and probability of being a Grade 2 lesion. The leave-one-lesion-out (LOLO) cross-validation method was used in the performance evaluation. In this method, one lesion was removed from the dataset as the test case, the BANN was trained on the remaining cases (i.e., the training dataset), and the test case was run through the trained BANN. This process was repeated for all lesions. Since a fully general three-class ROC analysis is still under investigation, we used two-class ROC analysis with the ROCKIT software package [40–42]. The index of performance was the area under the maximum likelihood-fitted binormal ROC curve (AUC), and the standard error and 95% confidence intervals were calculated.
III. RESULTS
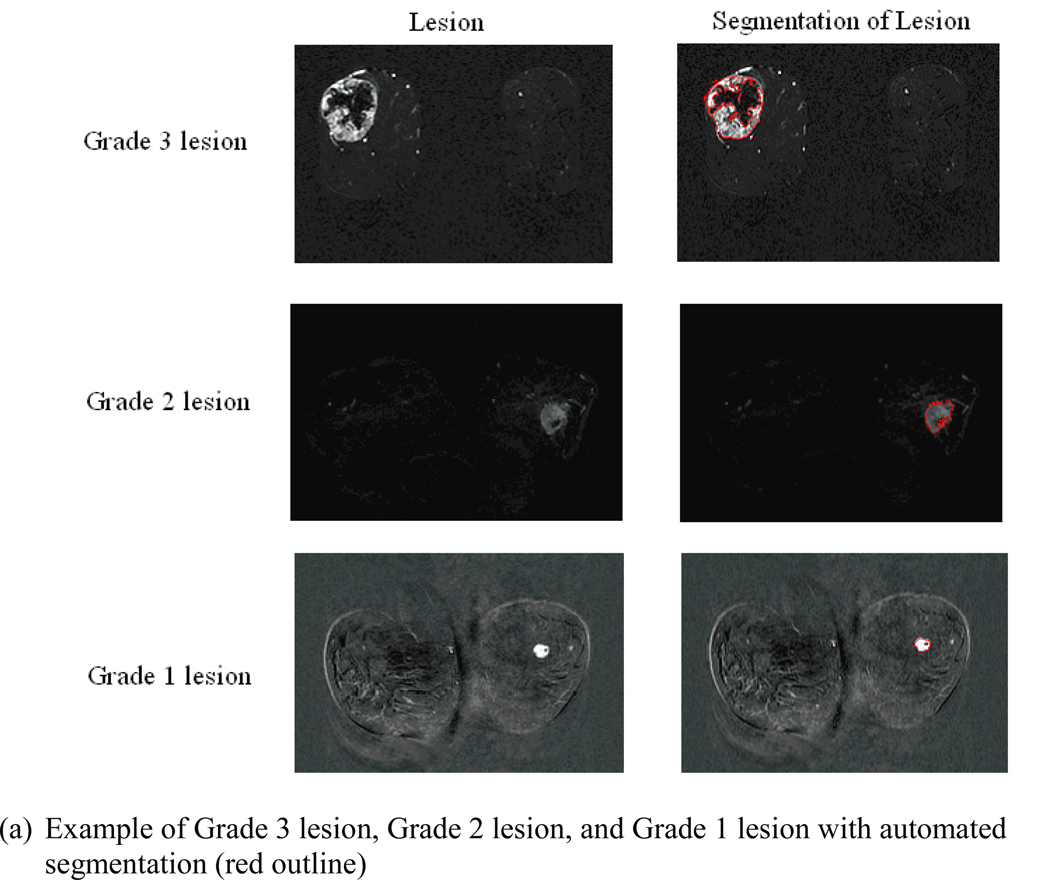
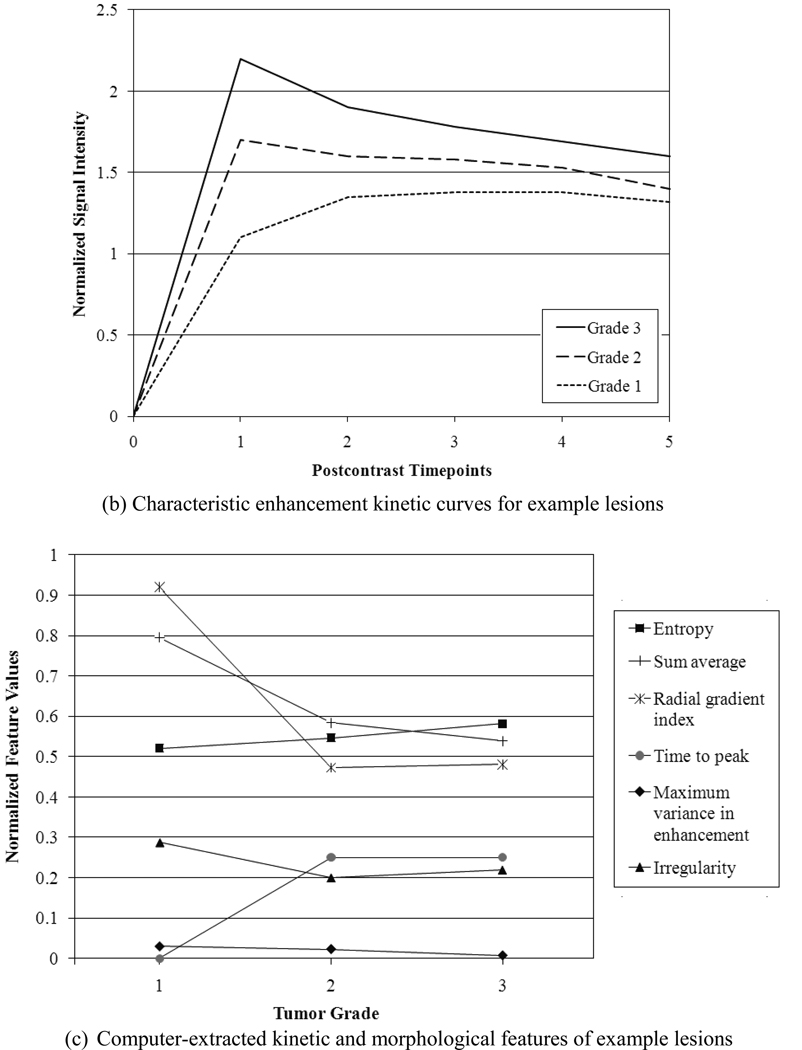
Figure 2 shows the segmentation, characteristic kinetic curves, and normalized feature values of example Grade 1, Grade 2, and Grade 3 lesions from the study database. From Figure 2c, it is apparent that the certain features ascend or descend from Grade 1 to Grade 3, appearing to follow the ordered nature of the tumor grades.
Figure 2.
(a) Segmentation, (b) kinetic curves, and (c) kinetic and morphologic feature values for an example Grade 3 lesion, Grade 2 lesion, and Grade 1 lesion. Detailed descriptions of lesion features can be found in the references [33–37].
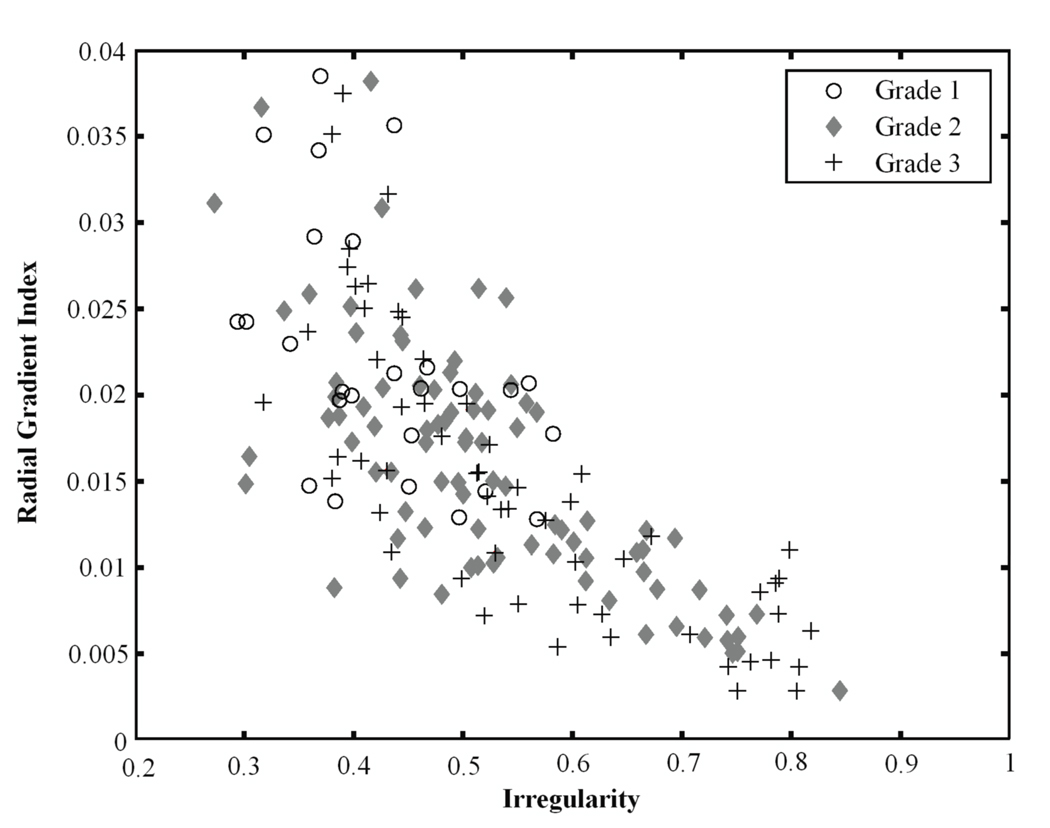
Figures 3–5 show several kinetic and morphological features for the different grades of lesions. Irregularity describes the deviation of the 3D lesion surface from a sphere surface and is usually large for malignant lesions since they are known to have spiculated surfaces. The radial gradient index indicates how well the enhancement structures in a volume extend in a radial pattern originating from the center of the volume, and it is usually small for malignant lesions. As Figure 3 shows, the Grade 3 lesions tend to have higher irregularity values and lower radial gradient index values than the Grade 1 lesions, reflecting the more aggressive nature of Grade 3 lesions.
Figure 3.
Relationship between irregularity and radial gradient index for Grade 3 lesions, Grade 2 lesions, and Grade 1 lesions.
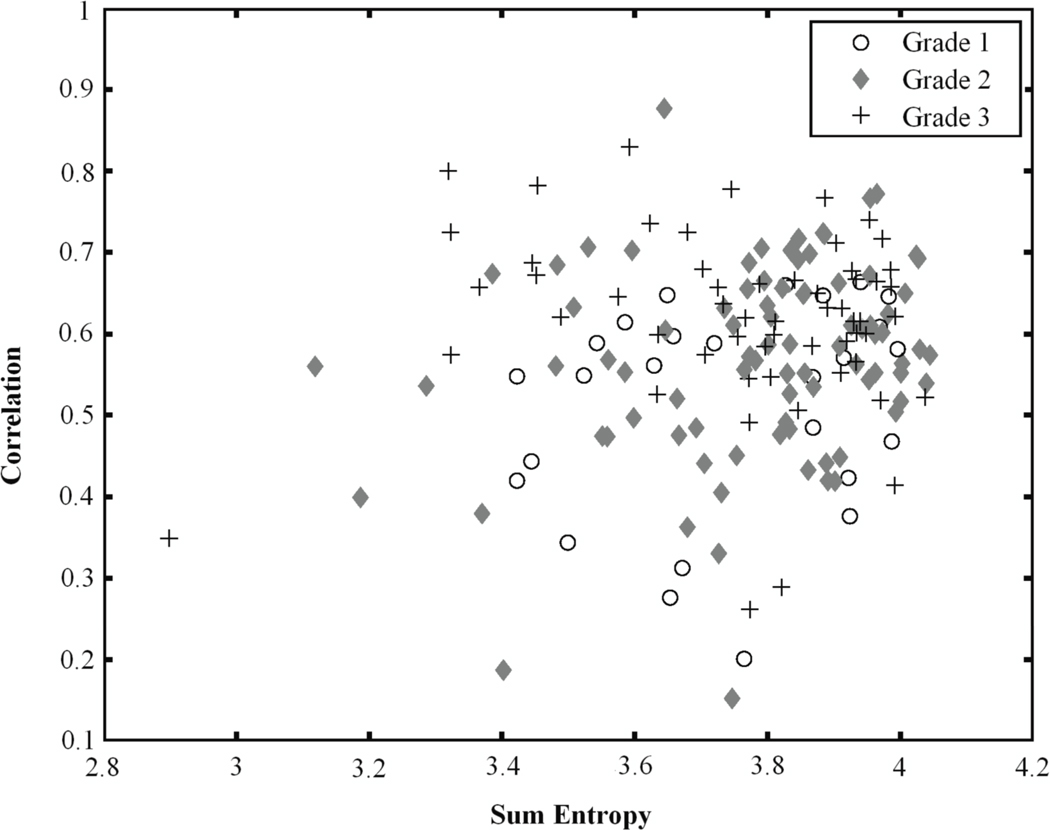
Figure 5.
Relationship between sum entropy and correlation for Grade 3 lesions, Grade 2 lesions, and Grade 1 lesions.
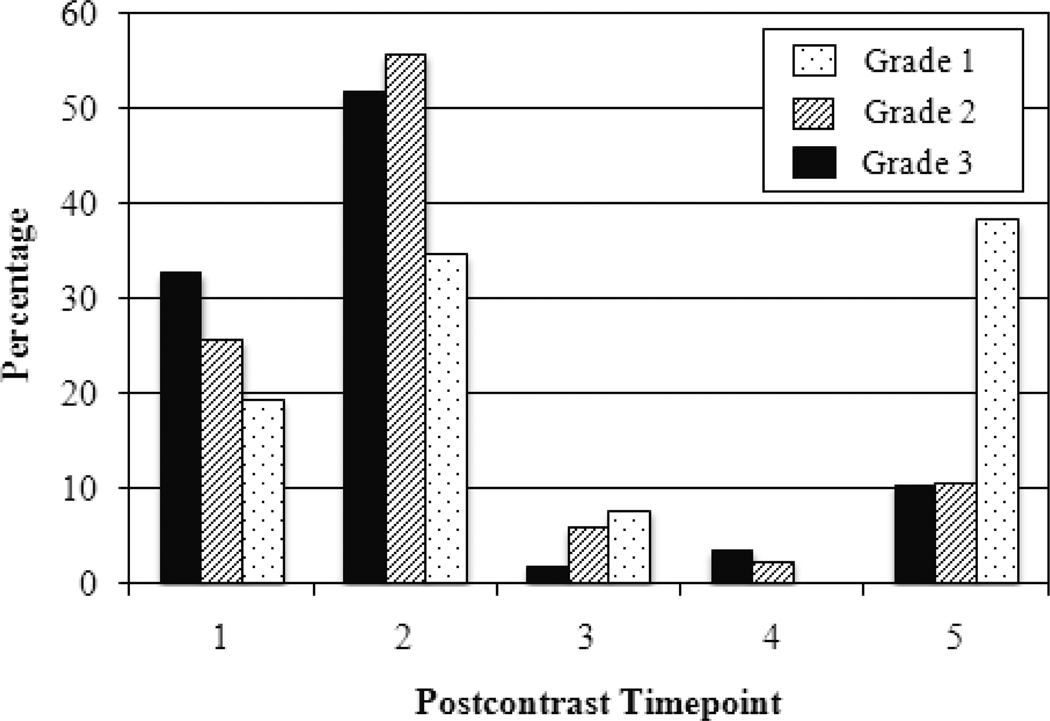
With respect to kinetics, time to peak is the postcontrast timepoint at which maximum enhancement occurs. Malignant lesions tend to peak early while benign lesions exhibit persistent enhancement with time to peak at the last postcontrast timepoint [6]. As expected, Figure 4 shows that the majority of Grade 2 and Grade 3 lesions peak at the 1st or 2nd postcontrast timepoint. However, Grade 1 lesions seemed to peak at the 5th postcontrast timepoint (39%) compared to the 1st postcontrast timepoint (19%) or the 2nd postcontrast timepoint (35%).
Figure 4.
Distribution of time to peak for Grade 3 lesions, Grade 2 lesions, and Grade 1 lesions.
Figure 5 illustrates the relationship of correlation and sum entropy. Both features are morphological features; correlation is a measure of linear structures within the lesion while sum entropy is a measure of the randomness of the sum of gray-levels of neighboring voxels. Both features typically have large values for malignant lesions. Figure 5 shows that Grade 3 lesions are more likely to have higher correlation and sum entropy values than Grade 1 lesions.
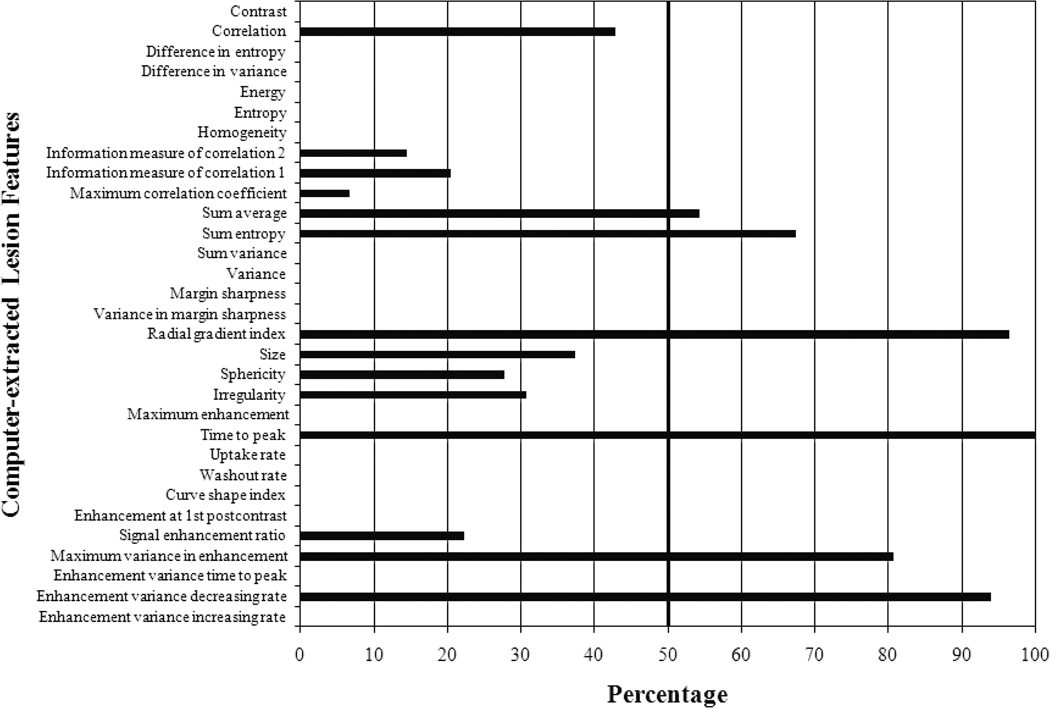
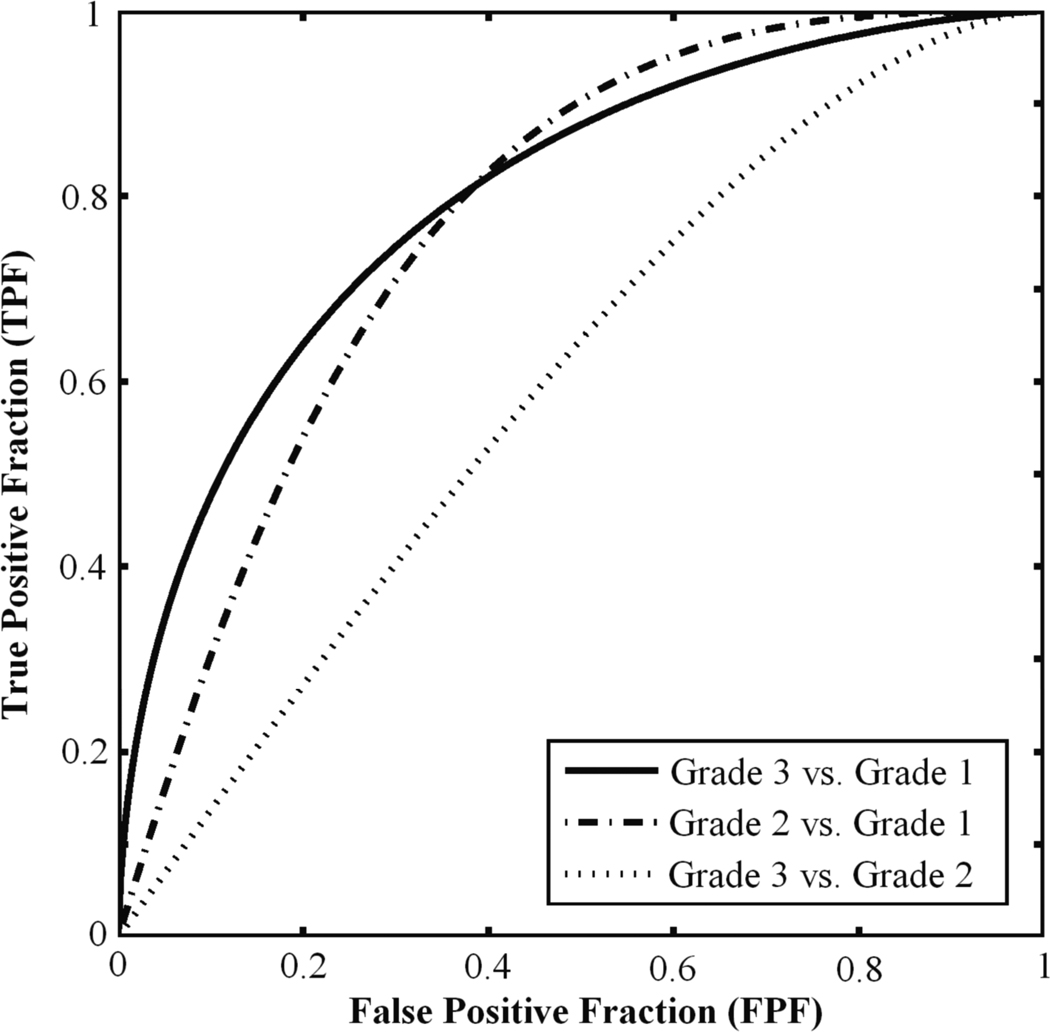
The histogram from three-class BANN feature selection is shown in Figure 6. We achieved AUC values of 0.80±0.05, 0.78±0.05, and 0.62±0.05 for Grade 1 vs. Grade 3, Grade 1 vs. Grade 2, and Grade 2 vs. Grade 3 classification tasks, respectively (Table 1). The corresponding ROC curves are depicted in Figure 7. Varying the threshold used in the feature selection from 40% to 80% had minimal effect on the classification performance.
Figure 6.
Computer-selected lesion features from stepwise three-class BANN feature selection using three-class Wilks cost function for differentiating Grade 3, Grade 2, and Grade 1 lesions (N=170 lesions). The cut-off threshold is set at 50% of the most selected feature (time to peak) as indicated by the vertical bold line. Detailed descriptions of lesion features can be found in the references [33–37].
Table 1.
Performance of three-class BANN feature selection and classification for the Grade 1 vs. Grade 3, Grade 1 vs. Grade 2, and Grade 2 vs. Grade 3 classification tasks in terms of AUC ± SE (standard error) and confidence intervals (C.I.).
| Classification Task | AUC ± SE | 95% C.I. |
|---|---|---|
| Grade 1 vs. Grade 3 | 0.80±0.05 | [0.70, 0.90] |
| Grade 1 vs. Grade 2 | 0.78±0.05 | [0.68, 0.88] |
| Grade 2 vs. Grade 3 | 0.62±0.05 | [0.52, 0.72] |
Figure 7.
ROC curves illustrating the three-class BANN performance levels in the Grade 1 vs. Grade 3, Grade 1 vs. Grade 2, and Grade 2 vs. Grade 3 classification tasks.
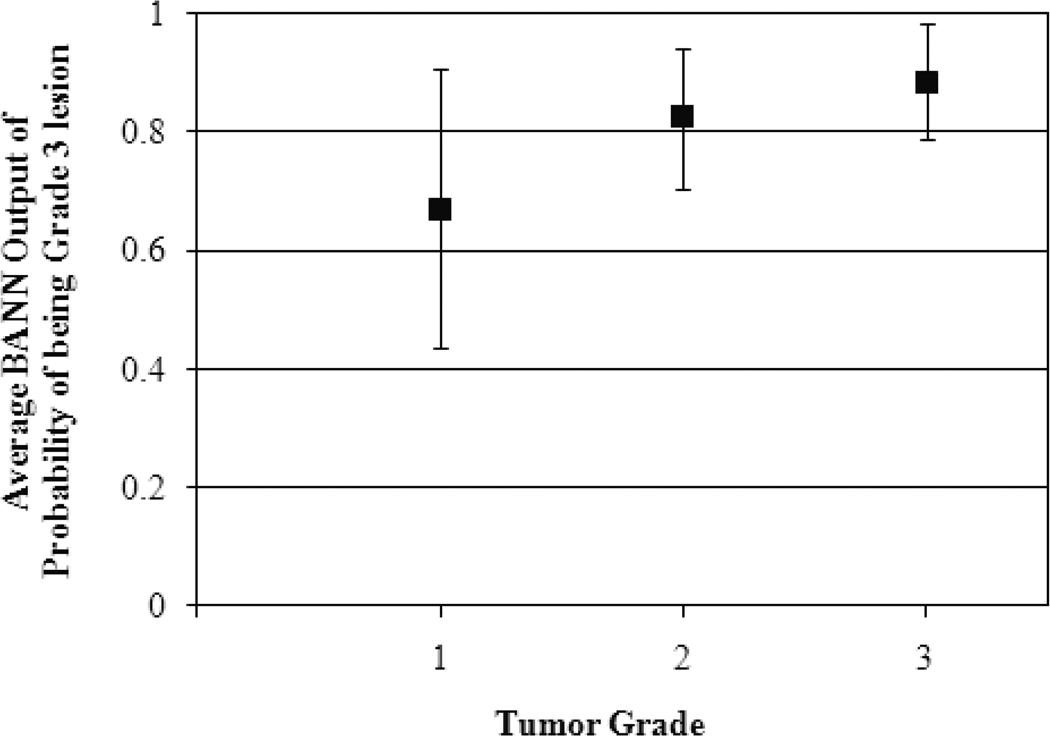
Additionally, we obtained an AUC value of 0.78±0.05 for the Grade 1 vs. Grades 2 and 3 classification task. The average BANN output of probability of being Grade 3 lesion (Eq. 8 in Appendix) was 0.67±0.24, 0.82±0.12, and 0.89±0.10 for Grade 1, Grade 2, and Grade 3 lesions, respectively (Figure 8); however we failed to show any statistical significant difference.
Figure 8.
Average output of probability of being Grade 3 lesion from three-class BANN for Grade 1, Grade 2, and Grade 3 lesions.
IV. DISCUSSION
We achieved similar AUC values ranging from 0.78±0.05 to 0.80±0.05 for the Grade 1 vs. Grade 3, Grade 1 vs. Grade 2 and Grade 1 vs. Grades 2 and 3 classification tasks. The performances are comparable to earlier studies assessing the diagnostic [33, 34, 36] and prognostic [29] performances of DCE-MRI CADx, indicating that automatic analysis can characterize of low grade and high grade lesions on DCE-MRI. The Grade 2 vs. Grade 3 classification task performed at a substantially lower level with an AUC value of 0.62±0.05, signifying that perhaps there is less of a difference in terms of morphology and kinetics between these two types of lesions as compared to Grade 1 lesions.
Since Grade 2 is an intermediate grade between Grade 1 and Grade 3, we assessed whether BANN classifiers could adhere to the ordered nature of the tumor grade characteristic. As seen in Figure 8, the average BANN output of probability of being Grade 3 lesion for Grade 2 lesions fell between that of Grade 1 and Grade 3 lesions, indicating that the BANN may be capable of capturing the ordered nature of specific lesion characteristics. The feature values in Figure 2c appear to corroborate this observation.
Angiogenesis, as measured by microvessel counts and density, is strongly associated with tumor grade [43–45]. Since contrast enhancement patterns are associated with angiogenesis, studies have found a strong relationship between MRI contrast enhancement and tumor grades [46, 47]. Thus, it is reasonable that global kinetic features such as time to peak were selected for tumor grade differentiation. Rim enhancement is also frequently found in high grade tumors [48–50] as seen in the example Grade 3 lesion in Figure 2a. Rim enhancement can be described by texture features such as sum average as well as enhancement-variance kinetics features which offer detailed kinetic characterization by tracking how the spatial variance in the lesion changes over time. From an examination of the corresponding BI-RADS descriptors [51] of the lesions, Grade 3 indeed showed a greater tendency to exhibit rim enhancement (28% of Grade 3 vs. 11% of Grade 1 lesions). Szabo et al. also found a strong association between heterogeneous internal enhancement and tumor grade [48]. Looking at the corresponding BIRADS descriptors, more Grade 3 lesions showed heterogeneous enhancement (40% compared to 29% for Grade 1) while more Grade 1 lesions showed homogeneous enhancement (50% compared to 29% for Grade 3). Thus, it is understandable that features such as sum average, maximum enhancement-variance, and increasing rate of enhancement-variance features were selected.
Although some tasks used in clinical radiology such as, send to biopsy or not, are related to binary classification tasks, i.e., malignant vs. benign, radiologists also perform multi-class classification tasks such as assessing DCIS, papillomas, and atypical ductal hyperplasia. Therefore, extending two-class to three-class BANNs in CADx and quantitative image analysis schemes could be applied to such classification tasks with the goal of potentially improving DCE-MRI CADx performance.
As mentioned earlier, we have already investigated the computerized characterization of two other important prognostic markers – invasion and lymph node metastasis – as MRI-based markers [29]. For future research, we hope to merge these prognostic factors with the tumor grade markers to generate an overall MRI-based prognostic index for describing overall lesion aggressiveness. In addition, by combining prognostic markers with therapy response, we can potentially generate predictive MRI-based markers for therapy assessment.
It is important to note that the size of the lesion is a well-established prognostic factor for tumors [52]. The single AUC value for lesion volume for the Grade 1 vs. Grade 3 task was 0.69±0.05. However, size was not selected during feature selection, demonstrating that the computer-extracted kinetic and morphological lesion features from MR images may provide more useful discriminatory information than size alone. Many prognostic studies seem to use only 2-D measurements of tumor sizes [20, 21, 23] whereas our workstation outputs lesion size as a 3-D volume. DCE-MRI may be more useful in giving a more complete assessment of tumor size and thus, more robust prognostic output.
Selected features such as radial gradient index and enhancement-variance increasing rate might be difficult or time-consuming for a radiologist to assess visually; however, a computer can calculate these feature values efficiently using established mathematical equations and software. Hence one of the motivations of automated analysis is to provide the radiologist with objective indices for interpreting images in a timely manner.
Although our preliminary results are promising, there are several limitations to the study. It is important to note that although N-class BANN classifiers have been developed and are available to implement, a general three-class ROC analysis is still under investigation. We were limited to using two-class ROC analysis to evaluate the performance of the three-class BANN. Thus, the AUC values obtained may not truly reflect the classification performance of the three-class BANN.
Feature selection was stable across the LOLO iterations for features selection and classification with minimal bias. Yet, we note that validation on an independent data set is necessary for an unbiased evaluation. We did not include cases from outside institutions, and we focused only on IDC lesions and did not investigate grades of other types of breast lesions such as ductal carcinoma in situ (DCIS) and invasive lobular carcinomas (ILC) lesions due to an insufficient number of cases. These are topics of ongoing research.
In conclusion, we believe this study shows the potential for (1) applying three-class BANN feature selection and classification to DCE-MRI quantitative image analysis (CADx) and (2) expanding the role of DCE-MRI CADx from diagnostic classification tasks (i.e., differentiating malignant and benign lesions) to the prognostic classification task of distinguishing different grades of malignant lesions. Quantitative image analysis shows promise in aiding radiologists in characterizing the prognostic nature of breast lesions.
Acknowledgements
The authors are grateful to Weijie Chen, Ph.D. for his help with the DCE-MRI database and breast CADx workstation. This work is supported in parts by NIH R33-113800 and P50-CA125183, an NIH Medical Scientist Training Program (MSTP) grant, DOE grant DE-FG02-08ER6478, NIH S10 RR021039 and P30 CA14599, and DOD grant W81XWH-10-1-0216.
Appendix: Three-class Bayesian artificial neural networks
Previous studies have shown that a BANN can adequately estimate the ideal observer decision function [27, 28]. It is assumed that data comes from a distribution of the following form:
| (2) |
Where p(x⃗|πi) is the conditional probability density of an observation x⃗ being drawn from the ith class, N is the number of classes, and p(πi) is the a priori class probability of the ith class; boldface type denotes random variables. The BANN estimates the a posteriori class probabilities p (πi|x⃗), which are related to the likelihood ratios (LRi):
| (3) |
where i is in the range of [1, N-1].
In the N=3 case [30, 31], i.e., Grade 1 (G1) vs. Grade 2 (G2) vs. Grade 3 (G3) lesions discrimination task in which the Nth class is the Grade 1 lesions, the a posteriori probabilities are related to the likelihood ratios:
| (4) |
| (5) |
| (6) |
We can then use the three-class BANN output for the task of separating Grade 3 and Grade 1 lesions. The a posteriori probability of being a Grade 3 lesion given that we are only considering Grade 3 and Grade 1 lesions is given by:
| (7) |
The output of the three-class BANN has two components, w⃗ and v⃗, which are estimates of p(πG3| x⃗) (Eq. 4) and p(πG2| x⃗) (Eq. 5), respectively. The estimate of p(πG1| x⃗) u⃗, can be estimated by (1-w⃗-v⃗) as given in Eq. 6. The estimated decision variable for the specific task of distinguishing Grade 3 from Grade 1 lesions, y, can then be constructed:
| (8) |
The same method can be used for the Grade 2 vs. Grade 3 and Grade 1 vs. Grade 2 tasks.
For the Grade 1 vs. Grades 2 and 3 classification task, the following equation holds since the classes were mutually exclusive:
| (9) |
For the BANN implementation, the error function is an information-based distance metric and the regularization term is a multivariate normal function.53
Footnotes
PACS classification
87.19.lf, 87.57.N, 87.61.Jc, 87.61.Qr, 87.61.Tg
M.L.G. is a stockholder in R2 Technology/Hologic and receives royalties from Hologic, GE Medical Systems, MEDIAN Technologies, Riverain Medical, Mitsubishi and Toshiba. It is the University of Chicago Conflict of Interest Policy that investigators disclose publicly actual or potential significant financial interest that would reasonably appear to be directly and significantly affected by the research activities.
References
- 1.Jemal A, Siegel R, Xu J, Ward E. Cancer statistics, 2010. Cancer J Clin. 2010;60:277–300. doi: 10.3322/caac.20073. [DOI] [PubMed] [Google Scholar]
- 2.Bluemke DA, Gatsonis CA, Chen MH, et al. Magnetic resonance imaging of the breast prior to biopsy. JAMA. 2004;292:2735–2742. doi: 10.1001/jama.292.22.2735. [DOI] [PubMed] [Google Scholar]
- 3.DeMartini W, Lehman C, Partridge S. Breast MRI for cancer detection and characterization: a review of evidence-based clinical applications. Acad Radiol. 2008;15:408–416. doi: 10.1016/j.acra.2007.11.006. [DOI] [PubMed] [Google Scholar]
- 4.Pengel KE, Loo CE, Teertstra HJ, Muller SH, Wesseling J, Peterse JL, Bartelink H, Rutgers EJ, Guilhuijs KG. The impact of preoperative MRI on breast-conserving surgery of invasive cancer: a comparative cohort study. Breast Cancer Res Treat. 2009;116:161–169. doi: 10.1007/s10549-008-0182-3. [DOI] [PubMed] [Google Scholar]
- 5.Johansen R, Jensen LR, Rydland J, Goa PE, Kvistad KA, Bathen TF, Axelson DE, Lundgren S, Gribbestad IS. Predicting survival and early clinical response to primary chemotherapy for patients with locally advanced breast cancer using DCE-MRI. JRMI. 2009;29:1300–1307. doi: 10.1002/jmri.21778. [DOI] [PubMed] [Google Scholar]
- 6.Kuhl CK, Mielcareck P, Klaschik S, Leutner C, Wardelmann E, Sleseke J, Schild HH. Dynamic breast MR imaging: are signal intensity time course data useful for differential diagnosis of enhancing lesions? Radiology. 1999;211:101–110. doi: 10.1148/radiology.211.1.r99ap38101. [DOI] [PubMed] [Google Scholar]
- 7.Schnall MD, et al. Diagnostic architectural and dynamic features at breast MR imaging: multicenter study. Radiology. 2006;238:42–53. doi: 10.1148/radiol.2381042117. [DOI] [PubMed] [Google Scholar]
- 8.Mussurakis S, Buckley DL, Coady AM, Turnbull LW, Horsman A. Observer variability in the interpretation of contrast enhanced MRI of the breast. British J of Rad. 1996;69:1009–1016. doi: 10.1259/0007-1285-69-827-1009. [DOI] [PubMed] [Google Scholar]
- 9.Ballon DJ, Trenta LRL, Hadar O, Abramson A, Dershaw DD. Observer variability and applicability of BIRADS terminology for breast MR imaging: Invasive carcinomas as focal masses. AJR. 2001;177:551–557. doi: 10.2214/ajr.177.3.1770551. [DOI] [PubMed] [Google Scholar]
- 10.Stoutjesdijk MJ, Futterer JJ, Boetes C, van Die LE, Jager G, Barentsz JO. Variability in the description of morphologic and contrast enhancement characteristics of breast lesions on magnetic resonance imaging. Invest Radiol. 2005;40:355–362. doi: 10.1097/01.rli.0000163741.16718.3e. [DOI] [PubMed] [Google Scholar]
- 11.Kim SJ, Morris EA, Liberman L, Ballon DJ, La Trenta LR, Hadar O, Abramson A, Dershaw DD. Observer variability and applicability of BI-RADS terminology for breast MR imaging: invasive carcinomas as focal masses. AJR. 2001;177:551–557. doi: 10.2214/ajr.177.3.1770551. [DOI] [PubMed] [Google Scholar]
- 12.Birdwell R, Ikeda D, O’Shaughnessy K, Sickles E. Mammographic characteristics of 115 missed cancers later detected with screening mammography and the potential utility of computer-aided detection. Radiology. 2001;219:192–202. doi: 10.1148/radiology.219.1.r01ap16192. [DOI] [PubMed] [Google Scholar]
- 13.Jiang Y, Nishikawa RM, Schmidt RA, Toledano AY, Doi K. Potential of computer-aided diagnosis to reduce variability in radiologists’ interpretations of mammograms depicting microcalcifications. Radiology. 2001;220:787–794. doi: 10.1148/radiol.220001257. [DOI] [PubMed] [Google Scholar]
- 14.Giger ML, Chan H-P, Boone J. Anniversary paper: History and status of CAD and quantitative image analysis: The role of Medical Physics and AAPM. Med Phys. 2008;35:5799–5820. doi: 10.1118/1.3013555. [DOI] [PMC free article] [PubMed] [Google Scholar]
- 15.Shimauchi A, Giger ML, Bhooshan N, Lan L, Pesce LL, Lee JK, Abe H, Newstead GM. Reader Study for the Evaluation of Radiologists’ Interpretation of Breast MRI using a CAD Breast MRI workstation. Radiology. 2011;258:696–704. doi: 10.1148/radiol.10100409. [DOI] [PubMed] [Google Scholar]
- 16.Nattkemper TW, Arnrich B, Lichte O, Timm W, Degenhard A, Pointon L, Hayes C, Leach MO. Evaluation of radiological features for breast tumour classification in clinical screening with machine learning methods. Artificial Intelligence in Med. 2005;34:29–139. doi: 10.1016/j.artmed.2004.09.001. [DOI] [PubMed] [Google Scholar]
- 17.Behrens S, Laue H, Althaus M, Boehler T, Kuemmerlen B, Hahn HK, Peitgen HO. Computer assistance for MR based diagnosis of breast cancer: Present and future challenges. Comp Med Img and Graphics. 2007;31:236–247. doi: 10.1016/j.compmedimag.2007.02.007. [DOI] [PubMed] [Google Scholar]
- 18.Meinel LA, Stolpen AH, Berbaum KS, Fajardo LL, Reinhardt JM. Breast MRI lesion classification: Improved performance of human readers with a backpropagation neural network computer-aided diagnosis (CAD) system. JMRI. 2007;25:89–95. doi: 10.1002/jmri.20794. [DOI] [PubMed] [Google Scholar]
- 19.Liney GP, Sreenvias M, Gibbs P, Garcia-Alvarez R, Turnbull LW. Breast lesion analysis of shape technique: semi-automated vs. manual morphological description. JMRI. 2006;23:493–498. doi: 10.1002/jmri.20541. [DOI] [PubMed] [Google Scholar]
- 20.Tabar L, Fagerberg G, Chen HH, Duffy SW, Gad A. Tumour development, histology and grade of breast acancers: prognosis and progression. Int J. Cancer. 1996;66:413–419. doi: 10.1002/(SICI)1097-0215(19960516)66:4<413::AID-IJC1>3.0.CO;2-Z. [DOI] [PubMed] [Google Scholar]
- 21.Warwick J, Tabar JL, Vitak B, Duffy S. Time-Dependent Effects on Survival in Breast Cancer: Results of 20 Years of Follow-Up from the Swedish Two-County Study. Cancer. 2004;100:1331–1336. doi: 10.1002/cncr.20140. [DOI] [PubMed] [Google Scholar]
- 22.Elston CW, Ellis IO. Pathological prognostic factors in breast cancer. I. The value of histological grade in breast cancer: experience from a large study with long-term follow-up. Histopathology. 2002;(41 Supplement):154–161. 25th Anniversary. [PubMed] [Google Scholar]
- 23.Soerjomataram I, Louwman M, Ribot J, Roukema J, Coebergh JW. An overview of prognostic factors for long-term survivors of breast cancer. Breast Cancer Res Treat. 2008;107:309–330. doi: 10.1007/s10549-007-9556-1. [DOI] [PMC free article] [PubMed] [Google Scholar]
- 24.Verikas A, Bacauskiene M. Feature selection with neural networks. Pattern Recognition Letters. 2002;23:1323–1335. [Google Scholar]
- 25.Abdolmaleki P, Buadu LD, Murayama S, Murakami J, Hashiguchi N, Yabuuchi H, Masuda K. Neural network analysis of breast cancer from MRI findings. Radiat Med. 1997;15:283–293. [PubMed] [Google Scholar]
- 26.Arbach L, Stolpen A, Reinhardt JM. Classification of Breast MRI Lesions Using A Backpropagation Neural Network (BNN) ISBI. 2004:253–256. [Google Scholar]
- 27.Kupinski MA, Edwards DC, Giger ML, Metz CE. Ideal observer approximation using Bayesian classification neural networks. IEEE Trans. Med. Imag. 2001;20:886–899. doi: 10.1109/42.952727. [DOI] [PubMed] [Google Scholar]
- 28.Van Trees HL. Detection, Estimation and Modulation Theory: Part I. New York: John Wiley & Sons; 1968. [Google Scholar]
- 29.Bhooshan N, Giger ML, Jansen SA, Li H, Lan L, Newstead GM. Cancerous Breast Lesions on Dynamic Contrast-enhanced MR Images: Computerized Characterization for Image-based Prognostic Markers. Radiology. 2010;254:680–690. doi: 10.1148/radiol.09090838. [DOI] [PMC free article] [PubMed] [Google Scholar]
- 30.Edwards D, Metz CE, Nishikawa RM. Estimation for three-class ideal observer decision functions with a Bayesian artificial neural network. Proc. SPIE. 2002;4686:1–12. [Google Scholar]
- 31.Edwards D, Lan L, Metz CE, Giger ML, Nishikawa RM. Estimating three-class ideal observer decision variables for computerized detection and classification of mammographic mass lesions. Med Phys. 2004;31:81–90. doi: 10.1118/1.1631912. [DOI] [PubMed] [Google Scholar]
- 32.Chen W, Giger ML, Bick U. A fuzzy c-means (FCM) based approach for computerized segmentation of breast lesions in dynamic contrast-enhanced MR images. Acad Radiol. 2006;13:63–72. doi: 10.1016/j.acra.2005.08.035. [DOI] [PubMed] [Google Scholar]
- 33.Chen W, Giger ML, Bick U, Newstead GM. Automatic identification and classification of characteristic kinetic curves of breast lesions on DCE-MRI. Med Phys. 2006;33:2878–2887. doi: 10.1118/1.2210568. [DOI] [PubMed] [Google Scholar]
- 34.Chen W, Giger ML, Lan L, Bick U. Computerized interpretation of breast MRI: Investigation of enhancement-variance dynamics. Medical Physics. 2004;31:1076–1082. doi: 10.1118/1.1695652. [DOI] [PubMed] [Google Scholar]
- 35.Gibbs P, Turnbull LW. Textural analysis of contrast-enhanced MR images of the breast. Magnetic Resonance in Medicine. 2003;50:92–98. doi: 10.1002/mrm.10496. [DOI] [PubMed] [Google Scholar]
- 36.Chen W, Giger ML, Li H, Bick U, Newstead GM. Volumetric texture analysis of breast lesions on contrast-enhanced magnetic resonance images. Magnetic Resonance in Medicine. 2007;58:562–571. doi: 10.1002/mrm.21347. [DOI] [PubMed] [Google Scholar]
- 37.Gilhuijs K, Giger ML, Bick U. Automated analysis of breast lesions in three dimensions using dynamic magnetic resonance imaging. Medical Physics. 1998;25:1647–1654. doi: 10.1118/1.598345. [DOI] [PubMed] [Google Scholar]
- 38.Johnson RA, Wichern DW. Applied Multivariate Statistical Analysis. 3rd ed. Englewood Cliffs, NJ: Prentice-Hall; 1992. [Google Scholar]
- 39.Huberty CJ. Applied Discriminant Analysis. New York: John Wiley and Sons; 1994. [Google Scholar]
- 40.Metz CE. Some practical issues of experimental design and data analysis in radiological ROC studies. Invest Radiol. 1989;24:234–245. doi: 10.1097/00004424-198903000-00012. [DOI] [PubMed] [Google Scholar]
- 41.Metz CE, Herman BA, Roe CA. Statistical comparison of two ROC-curve estimates obtained from partially-paired datasets. Med Decision Making. 1998;18:110–121. doi: 10.1177/0272989X9801800118. [DOI] [PubMed] [Google Scholar]
- 42.Metz CE. ROCKIT (computer program), version 0.9b. 1998 Available from http://www-radiology.uchicago.edu/krl/roc_soft.htm.
- 43.Folkman J, Watson K, Ingber D, Hanahan D. Induction of angiogenesis during the transition from hyperplasia to neoplasia. Nature. 1989;339:58–61. doi: 10.1038/339058a0. [DOI] [PubMed] [Google Scholar]
- 44.Hansen S, Grabau DA, Sorensen FB, Bak M, Vach W, Rose C. Vascular grading of angiogenesis: prognostic significance in breast cancer. Br J Cancer. 2000;82:339–347. doi: 10.1054/bjoc.1999.0924. [DOI] [PMC free article] [PubMed] [Google Scholar]
- 45.Weidner N, Semple JP, Welch WR, Folkman J. Tumor angiogenesis and metastasis--correlation in invasive breast carcinoma. NEJM. 1991;324:1–8. doi: 10.1056/NEJM199101033240101. [DOI] [PubMed] [Google Scholar]
- 46.Mussurakis S, Buckley DL, Horsman A. Dynamic MR imaging of invasive breast cancer: correlation with tumour grade and other histological factors. Br J Radiol. 1997;70:446–451. doi: 10.1259/bjr.70.833.9227224. [DOI] [PubMed] [Google Scholar]
- 47.Bone B, Aspelin P, Bronge L, Veress B. Contrast-enhanced MR imaging as a prognostic indicator of breast cancer. Acta Radiol. 1998;98:279–284. doi: 10.1080/02841859809172195. [DOI] [PubMed] [Google Scholar]
- 48.Szabo BK, Aspelin P, Kristoffersen Wiberg M, Tot T, Bone B. Invasive breast cancer: correlation of dynamic MR features with prognostic factors. Eur Radiol. 2003;13:2425–2435. doi: 10.1007/s00330-003-2000-y. [DOI] [PubMed] [Google Scholar]
- 49.Teifke A, Behr O, Schmidt M, Victor A, Vomweg TW, Thelen M, Lehr HA. Dynamic MR imaging of breast lesions: correlation with microvessel distribution pattern and histologic characteristics of prognosis. Radiology. 2006;239:351–360. doi: 10.1148/radiol.2392050205. [DOI] [PubMed] [Google Scholar]
- 50.Jinguji M, Kajiya Y, Kamimura K, Nakajo M, Sagara Y, Takahama T, Ando M, Rai Y, Ohi Y, Yoshida H. Rim enhancement of breast cancers on contrast-enhanced MR imaging: relationship with prognostic factors. Breast Cancer. 2006;13:64–73. doi: 10.2325/jbcs.13.64. [DOI] [PubMed] [Google Scholar]
- 51.Breast Imaging Reporting and Data System Atlas (BI-RADS Atlas) Reston, VA: American College of Radiology; 2003. [Google Scholar]
- 52.Carter C, Allen C, Henson D. Relation of tumor size, lymph node status, and survival in 24,740 breast cancer cases. Cancer. 1989;63:181–187. doi: 10.1002/1097-0142(19890101)63:1<181::aid-cncr2820630129>3.0.co;2-h. [DOI] [PubMed] [Google Scholar]
- 53.MacKay DJS. Ph.D. thesis. Pasadena, California: California Institute of Technology; 1992. Bayesian Methods for Adaptive Models. [Google Scholar]


