

Abstract
Context:
Assam's main lifeline, the Brahmaputra river, braided nature created numerous sand bars and islands known as chars/sapories. They are home to more than 3 million people. Over 90% of the cultivated land on the river islands is flood-prone; the flood leaves the islands completely separated from mainland, preventing access to health infrastructure and services. Aims: To assess the nutritional status of under 5 children residing in the char areas of Dibrugarh district and to identify the factors influencing their nutritional status.
Settings and Design:
A community-based cross-sectional study conducted in the riverine areas of Dibrugarh district of Assam.
Materials and Methods:
Nutritional status was assessed using anthropometry. Undernutrition was classified using World Health Organization (WHO) recommended Z- score system. Data collection was done by house to house visit of all chars using proportionate allocation.
Statistical Analysis Used:
Rates, ratios, proportions, and chi-square test.
Results:
Overall prevalence of underweight, stunting, and wasting was 29%, 30.4%, and 21.6%, respectively. Prevalence of underweight and stunting was less than the prevalence of underweight (36.4%) and stunting (46.5%) in Assam, but the prevalence of wasting was more than that of Assam (13.7%) as observed in National Family Health Survey-3. Significant association was observed between the prevalence of undernutrition and socioeconomic status, literacy status of parents, infant, and young child feeding practices and size of the family (P < 0.05).
Conclusions:
Special focus is needed for nutritional improvement of under 5 living in char areas to prevent preventable morbidities and to achieve optimum development.
Keywords: Assam, dibrugarh, nutritional status, riverine area, WHOs Z score
Introduction
Children constitute a large and “vulnerable” or special risk group, as 50% of all deaths were occurring during the first 5 years of life in the developing world.(1) The preschoolers have to cope with the killer triad of diarrheal diseases, respiratory tract infections, and malnutrition, resulting in high morbidity and mortality.(2,3) Ignoring undernutrition puts the long-term health and development of population at risk.
Despite global efforts for improving maternal and child health and specific efforts like Integrated Child Development Services Scheme, malnutrition among children remains a significant problem in India constituting 48%, 43%, and 20% of children under 5 years of age stunted, underweight, and wasted, respectively. The proportion of children who are severely undernourished is also notable-24%, severely stunted and 16%, severely underweight,(4) Mortality rates of under 5 children is 2.5 times higher among moderately underweight and 5 times higher in severely underweight.(5)
Assam's main lifeline is the Brahmaputra river, known for its catastrophic flooding. The river is of braided nature giving rise to numerous sand bars and islands known as chars/sapories. They are home to more than 3 million people. Over 90% of the cultivated land on the river islands is flood-prone. The flood leaves the islands completely separated from the mainland, thereby preventing access to health infrastructure and services.(6) Therefore, the present study was conducted to assess the nutritional status of under 5 children residing in the char areas of Dibrugarh district and to identify the factors influencing their nutritional status.
Materials and Methods
Dibrugarh district is located in the eastern corner of Assam, by the south bank of the mighty river Brahmaputra. A community-based cross-sectional study was conducted in char areas of Dibrugarh district of Assam, during 2011-12. The study was approved by institutional ethical committee of Assam Medical College, Dibrugarh. Human subject recruitment was done following ethical approval. Written informed consent was obtained from the mothers/respondents.
Considering the prevalence of underweight among under 5 children in Assam as 36 % [National Family Health Survey (NFHS-3)] and taking 10% of “P” as allowable error the sample size was calculated to be 485, which was rounded up to 500. The sample size for the study was calculated by using the formula- n = 4pq/[d2 + 4pq/N], where d = allowable error, N = Estimated population of under 5 children in the char areas of Dibrugarh District = 1458.
Study procedure
All 14 chars in Dibrugarh district were included and children aged 0-5 years residing in the study area were enrolled by consecutive sampling by house to house visit after proportionate allocation. The first household was selected randomly, and then all consecutive houses were visited till the required numbers of children were obtained. From the selected household one child in the age group 0-5 years was selected randomly and included in the study. The mothers/caregiver of the sampled population of under 5 children willing to participate were interviewed by using predesigned and pretested proforma. Information on selected sociodemographic characteristics: age of children, caste, religion, family size, socioeconomic status (SES), educational status of parents; infant feeding practices: initiation of breastfeeding, feeding of colostrum, prelacteal feed, exclusive breast feeding up to 6 months, complementary feeding, and so on were collected.
The weight and height/length of the selected child was recorded and converted into three summary indices of nutritional status: weight for age, height for age, and weight for height. According to WHO criterion based on standard deviation (SD) units, children who were more than two SDs below the reference median were considered undernourished, that is, underweight, stunted, and wasted. Every effort was made to get high order of accuracy in measurements by employing standardized methods and equipments which was standardized from time to time to ensure uniformity of measurements. Modified Prasad's classification adjusted with current income levels was used to determine the SES. The data were compiled and statistical analysis was done using percentage and chi-square test.
Results
Out of the 500 children, 206 (41.2%) were boys and 294 (58.8%) were girls. Majority was from nuclear family 305 (61.0%). All were Hindu by religion.
Overall prevalence of underweight, stunting, and wasting was found to be 29%, 30.4%, and 21.6%, respectively. Severe underweight, stunting, and wasting (<-3 SD) was found in 10.6%, 7.0%, and 8.6%, respectively. Prevalence of underweight and stunting was more common among the older age group. Prevalence of underweight was highest (63.8%) in the age group 48-60 months, followed by 43.5% in the age group 24-36 months and 32.4% in 12-24 months of age. Stunting was also highest (58.6%) among the children aged 48-60 months, followed by 57.3% in the age group 36-48 months. Wasting was found to be most prevalent (42.4%) in the age group 24-36 months, followed by 27.6% and 26.7% in the age group 48-60 months and 12-24 months, respectively. The difference in prevalence of all kinds of malnutrition, that is, underweight, stunting, and wasting in the various age groups were found to be statistically significant (P < 0.05).
Prevalence of all kinds of undernutrition was more common among the boys than the girls which were found to be statistically significant [Table 1].
Table 1.
Prevalence of under nutrition according to some sociodemographic variables
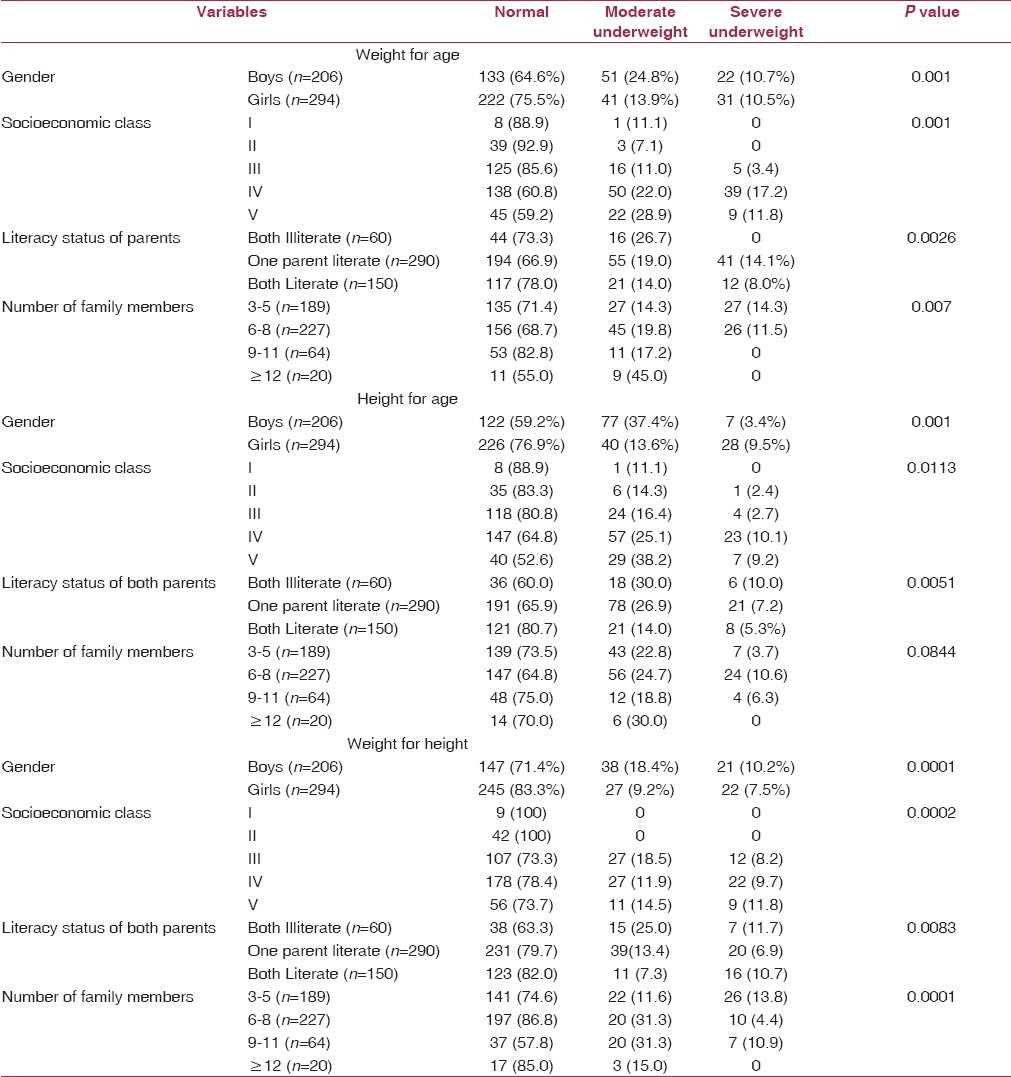
Prevalence of underweight was more (30.3%) among the children belonging to joint families than that of nuclear families (29.2%), whereas prevalence of stunting was more (32.1%) among the children belonging to nuclear families than joint families (27.7%). However, the difference was statistically insignificant. Significant association was found between the prevalence of wasting and type of family. Wasting was more prevalent (29.7%) in the joint families than the nuclear families (16.4%).
All kinds of undernutrition were more prevalent among the socioeconomic classes IV and V [Table 1].
Significant association was observed between the literacy status of parents and prevalence of all kinds of undernutrition. Underweight was found to be highest (33.6%) among the children whose mothers were illiterate. Prevalence of underweight decreased as the level of education of the mothers increased. Only 4.8% of the children were moderately underweight, where mothers were educated up to high school.
Prevalence of underweight was found to be less (22.0%) when both the parents were literate in comparison to the prevalence (33.1%) when only one parent was literate. Prevalence of stunting and wasting was also least among the children whose both parents were literate in comparison to those whose one parent was literate or both the parents were illiterate [Table 1].
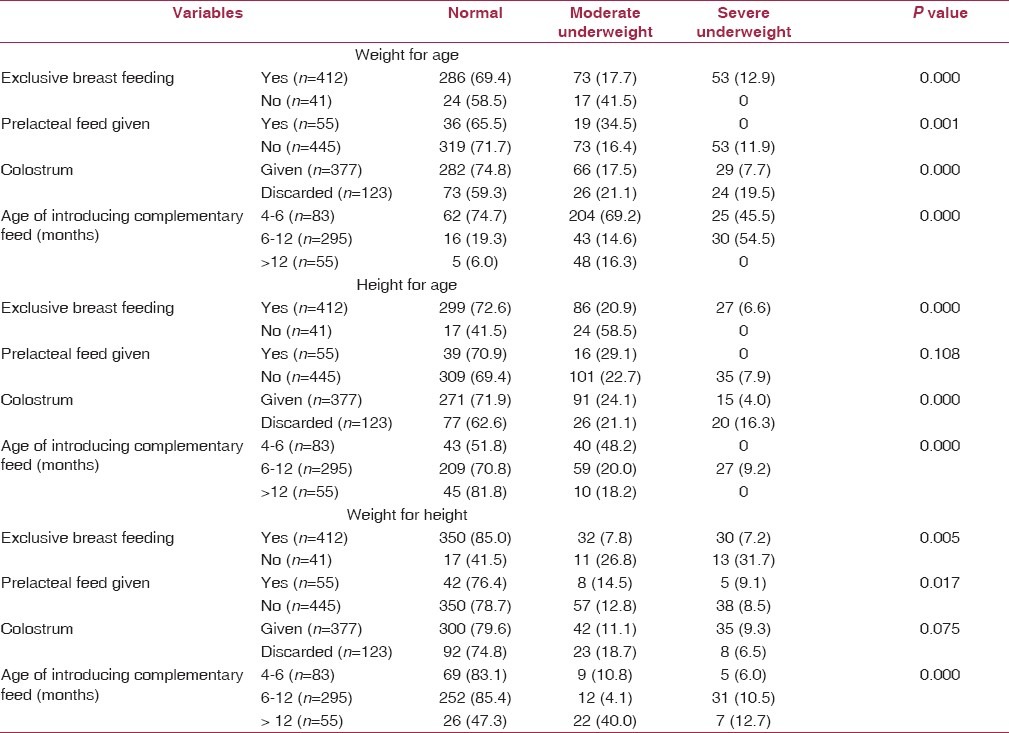
Significant associations were observed between nutritional status and infant feeding practices [Table 2].
Table 2.
Prevalence of under nutrition according to infant feeding practices
Discussion
Overall prevalence of underweight and stunting (29.0% and 30.4%) in the present study was less than the prevalence of underweight (36.4%) and stunting (46.5%) in Assam as observed in NFHS-3. Under National Rural Health Mission (NRHM) new initiatives like provision of boat clinic services has been started in the char areas of Dibrugarh district which provides periodic health check-up, immunization, nutrition, and health education and other maternal and child health (MCH) services through qualified doctors, nurses, and other community mobilizers. These efforts may be related to the less prevalence of underweight and stunting observed in this study. Other possible reasons may be availability of fresh vegetables, fish, meat, milk, and milk products in the char areas. But, the prevalence of wasting (21.6%) was more than that of NFHS-3 (13.7%).(4) The relatively high prevalence of wasting observed among the children in the present study is indicative of a state of acute malnutrition which may be attributed to recent food deprivation and/or the higher prevalence of infectious diseases among the study population. The chars are very frequently affected by flood. During this period, there is acute crisis of food and safe water which leads to starvation and increased prevalence of infectious diseases mainly water borne diseases. Prevalence of all kinds of undernutrition was less among the younger age group. Less prevalence of malnutrition observed in the present study among the younger age groups may be because of better health care accessibility and utilization for gradual improvement of coverage of NRHM over the years. Boys were found more likely than girls to be undernourished. Other studies have also reported more prevalence of malnutrition among boys than girls.(7,8,9) According to NFHS-3 (2005-06), overall girls, and boys were equally undernourished.(4) Highest prevalence of underweight (45.0%) was found among the children belonging to families consisting of more than 12 members. Wasting was also found to be highest (42.2%) among the children from larger (9-11 members) families [Table 1]. Significant association (P < 0.05) was observed between the prevalence of underweight and wasting with the family size. This finding is in agreement with a study conducted in West Bengal.(10) Household size and composition can have different effects. What usually matters is the dependency ratio. If there are many young children they compete for resources. Therefore, children of higher birth order being particularly vulnerable.(11) In the present study, overall prevalence of malnutrition was found to be significantly higher among the children belonging to lower socioeconomic classes (IV and V). Many studies done in India have shown that prevalence of malnutrition among under 5 children is substantially higher in lower social classes as well as among the poorer section of the community.(4,7,12) The present study reveals the fact that literacy of both the parents is associated significantly with the prevalence of undernutrition among the under 5 children. This may be due to the fact that in the rural areas of Assam, father is the sole decision maker for the family and also educated parents adopts better childcare practices.
Infant-feeding practices constitute a major component of child caring practices apart from sociocultural, economic, and demographic factors. Somehow, these practices constitute one of the most neglected determinants of young child malnutrition in spite of their important role in growth pattern of children. Recent studies have recognized the link between malnutrition and child feeding practices.(7,13) Initiation of breast feeding within 1 h and feeding of colostrum in the present study was found to be 69.0% and 75.4%. Exclusive breastfeeding (0-6 months) practice was not so common in the study area. Though 90.9% received exclusive breast feeding, 73.7% were given prolonged exclusive breast feeding. A total of 11% of the children received prelacteal feed and only 68.1% of children received complementary feeding during 6-12 months of age.
Exclusive breast feeding, feeding of colostrum, prelacteal feeding, and time of initiation of complementary feeding was found to be significantly associated with the prevalence of underweight among the under 5 children (P < 0.05). Prevalence of stunting was significantly higher among the children who were not exclusively breastfed, deprived from colostrum feeding, and delayed initiation of breast feeding and complementary feeding. Wasting was found to be significantly associated with exclusive breast feeding and time of introduction of complementary feeding. Rasania and Sachdev(14) found significant association of breast feeding and prevalence of underweight and stunting. Faulty complementary feeding practices compounded by nutritionally inadequate, and frequently contaminated, foods often introduced too early (in developing and developed countries) or too late (in developing countries) remain a major cause of malnutrition.(15)
The findings of the present study can be explained by the fact that wasting is usually due to recent food deprivation and/or post flood acute illnesses but underweight and stunting reflect the long-term nutritional experience of the population. Infant and young child feeding practices have some long-term beneficial effects in improving the nutritional status of children.(7) So, more impact of infant-feeding practices on underweight and stunting but not on wasting was observed in the present study. Appropriate evidence-based feeding practices are essential for attaining and maintaining proper nutrition and health. Keeping improved infant and young child feeding high on the public health agenda is crucial to consolidating gains made during the past 2 decades.
Some short-, medium-, and long-term planning is needed to address the problem of undernutrition among the under 5 children residing in the study area. Special focus is needed during the flood when the water sources may get grossly contaminated. Availability of safe water needs to be ensured. Further operational and action research need to be carried out to understand more precisely the factors, affecting the nutritional status of the children residing in the study area and take interventions accordingly.
Footnotes
Source of Support: Nil
Conflict of Interest: None declared.
References
- 1.Park K. Chapter 10; Preventive Medicine in Obstetrics, Paediatrics and Geriatrics. 21st ed. Parks textbook of preventive and social medicine; p. 481. [Google Scholar]
- 2.Ramani KV, Mavalankar D, Joshi S, Malek I, Puvar T, Kumar H. Why should 5000; children die in India every day. Major causes of death and managerial challenges? Vikalpa. 2010;35:9–19. [Google Scholar]
- 3.Bhutta ZA, Ahmed T, Black RE, Cousens S, Dewey K, Giugliani E, et al. Maternal and Child Undernutrition Study Group. What works? Interventions for maternal and child undernutrition and survival. Lancet. 2008;371:417–40. doi: 10.1016/S0140-6736(07)61693-6. [DOI] [PubMed] [Google Scholar]
- 4.National Family Health Survey (NFHS-3), India, 2005-06. Mumbai: 2008. International Institute for Population Sciences (IIPS) and Macro International. [Google Scholar]
- 5.World health organization. Life in the 21st century: A vision for all. Geneva: WHO; [Last accessed on 2012 Sept 12]. World health report 1998. Available from: www.who.int/whr/1998/en/whr98_en.pdf . [Google Scholar]
- 6.Delivering essential services to socially excluded communities. New Delhi: UNICEF India; UNICEF 2011. Briefing paper series: Innovations, lessons and good practices. [Google Scholar]
- 7.Kumar D, Goel NK, Mittal PC, Misra P. Influence of infant-feeding practices on nutritional status of under five children. Indian J Pediatr. 2006;73:417–21. doi: 10.1007/BF02758565. [DOI] [PubMed] [Google Scholar]
- 8.Bisai S, Ghosh T, Bose K. Prevalence of underweight, stunting and wasting among urban poor children aged 1-5 years of west Bengal, India. Intern J Curr Res. 2010;6:39–44. [Google Scholar]
- 9.Mittal A, Singh J, Ahluwalia SK. Effects of maternal factors on nutritional status of 1-5 year old children in urban slum population. Indian J Community Med. 2007;32:264–7. [Google Scholar]
- 10.Ray SK, Haldar A, Biswas B, Misra R, Kumad S. Epidemiology of undernutrition. Indian J Pediatr. 2001;68:1025–30. doi: 10.1007/BF02722348. [DOI] [PubMed] [Google Scholar]
- 11.Charmarbagwala R, Ranger M, Waddington H, White H. The determinants of child health and nutrition: A meta-analysis; Department of Economics, University of Maryland and Operations Evaluation Department, World Bank. [Last accessed on 2012 Jul 13]. Available from: siteresources.worldbank.org/INTEDS14 .
- 12.Sachdeva S, Amir A, Ansari MA, Khalique N, Khan Z, Alam S. Potentially modifiable micro-environmental and co-morbid factors associated with severe wasting and stunting in children below 3 years of age in Aligarh district. Indian J Community Med. 2010;35:353–5. doi: 10.4103/0970-0218.66889. [DOI] [PMC free article] [PubMed] [Google Scholar]
- 13.Kapur D, Sharma S, Agarwal KN. Dietary intake and growth pattern of children 9-36 months of age in an urban slum in Delhi. Indian Pediatr. 2005;42:351–6. [PubMed] [Google Scholar]
- 14.Rasania SK, Sachdev TR. Nutritional status and feeding practices of children attending MCH Centre. Indian J Community Med. 2001;XXVI:145–50. [Google Scholar]
- 15.World Health Organization; Fifty-Third World Health Assembly, Provisional agenda item 12.4, A53/7. Infant and young child nutrition, Report by the Director-General. 2000 Mar 3; [Google Scholar]