

Abstract
Heparanase has been implicated in cancer but its contribution to the early stages of cancer development is uncertain. In this study, we utilized non-transformed human MCF10A mammary epithelial cells and two genetic mouse models (Hpa-transgenic and knockout mice) to explore heparanase function at early stages of tumor development. Heparanase overexpression resulted in significantly enlarged asymmetrical acinar structures, indicating increased cell proliferation and decreased organization. This phenotype was enhanced by co-expression of heparanase variants with a mutant H-Ras gene, which was sufficient to enable growth of invasive carcinoma in vivo. These observations were extended in vivo by comparing the response of Hpa-transgenic (Hpa-Tg) mice to a classical two-stage DMBA/TPA protocol for skin carcinogenesis. Hpa-Tg mice overexpressing heparanase were far more sensitive than control mice to DMBA/TPA treatment, exhibiting a 10-fold increase in the number and size of tumor lesions. Conversely, DMBA/TPA-induced tumor formation was greatly attenuated in Hpa-KO mice lacking heparanase, pointing to a critical role of heparanase in skin tumorigenesis. In support of these observations, the heparanase inhibitor PG545 potently suppressed tumor progression in this model system. Taken together, our findings establish that heparanase exerts pro-tumorigenic properties at early stages of tumor initiation, co-operating with Ras to dramatically promote malignant development.
Keywords: Heparanase, Ras, breast, skin, tumorigenesis
Introduction
Heparanase is an endo-β-glucuronidase that cleaves heparan sulfate (HS) side chains presumably at sites of low sulfation, releasing saccharide products with appreciable size (4-7 kDa). Enzymatic degradation of HS leads to disassembly of the extracellular matrix (ECM) and is therefore involved in fundamental biological phenomena associated with tissue remodeling and cell migration, including inflammation, angiogenesis and metastasis (1-4). The clinical significance of the enzyme in tumor progression emerged from a systematic evaluation of heparanase expression in primary human tumors. Immunohistochemistry, in situ hybridization, RT-PCR and real time-PCR analyses revealed that heparanase is up-regulated in essentially all major types of human cancer, namely carcinomas, sarcomas and hematological malignancies (2, 5-7). Notably, increased heparanase levels were most often associated with reduced patients' survival post operation, increased tumor metastasis and higher microvessel density (2, 7, 8), thus critically supporting the intimate involvement of heparanase in tumor progression and encouraging the development of heparanase inhibitors as anti-cancer therapeutics (9, 10). Importantly, heparanase up-regulation in human tumors (i.e., head & neck, tongue, hepatocellular, breast and gastric carcinomas) is associated with tumors larger in size (2, 8). Likewise, heparanase over-expression enhanced (11-14), while local delivery of anti-heparanase siRNA inhibited (15) the progression of tumor xenografts, altogether implying that heparanase function is not limited to tumor metastasis but is also engaged in accelerated growth of the primary lesion (12).
While the clinical significance of heparanase is well documented and anti-heparanase compounds are being tested in clinical trials (16), the role of heparanase in the early stages of tumor development has not been sufficiently explored. Here, we utilized non-transformed human mammary epithelial cell line (breast MCF10A) and genetic (Hpa-Tg/KO mice) approaches to reveal the function of heparanase and its C-terminal domain (8C) reported to mediate signaling properties of heparanase and to promote tumor growth (17), in the early phases of tumor development.
Materials and methods
Antibodies and reagents
Anti-smooth muscle actin (SMA) and anti-actin monoclonal antibodies were purchased from Sigma (St. Louis, MO); Phospho-Akt, phospho-Met, and phospho-Src antibodies were purchased from Cell Signaling (Beverly, MA). Anti-Erk2, anti-phospho-Erk, anti-Src, anti-Akt, anti-E-cadherin, anti-vimentin and anti-Ki67 antibodies were purchased from Santa Cruz Biotechnology (Santa Cruz, CA). Anti-LYVE and anti-FOXO1 antibodies were from Abcam (Cambridge, MA); Anti-V5 epitop tag antibody was from Invitrogen (Carlsbad, CA), and anti-F4/80 was from Serotec. Anti-heparanase polyclonal antibody (#1453) has been described previously (18). Matrigel was purchased from BD (San Jose, CA). The heparanase and angiogenesis inhibitor PG545 was kindly provided by Progen Pharmaceuticals (Brisbane, Australia) (9).
Cells culture, infection, immunoblotting and xeno transplantation
MDA-MB-231 breast carcinoma and A431 epidermoid carcinoma cells were purchased from the American Type Culture Collection (ATCC; Manassas, VA) in August 2013. MCF10A cells were kindly provided by Dr. Yosef Yarden (Weizmann Institute of Science, Rehovot, Israel) in December 2009 and were cultured as described (19). MCF10AT1 cells were kindly provided by Dr. Avraham Raz (Wayne State University, Detroit, MI) (20) in January 2010. Cells were infected with control empty vector (Mock), heparanase or its C-terminal domain (8C) (17) gene constructs, selected with Blasticidin (10μg/ml; Invitrogen), expended and pooled. Immunoblotting was carried out essentially as described (14, 21). For xenotransplantation, cells from exponential cultures of control (Mock) and heparanase/8C- infected MCF10AT1 cells were detached with trypsin/EDTA, washed with PBS and brought to a concentration of 1×10⁸ cells/ml Matrigel. Cell suspension (1×10⁷/0.1 ml) was inoculated subcutaneously at the right flank or orthotopically at third mammary fat pad of 8-weeks old female SCID/Beige mice. Tumor lesions were harvested after 8 (subcutaneous) or 3 (mammary fat pad) months, fixed in 4% paraformaldehyde, and subjected to histological and immunohistochemical analyses.
Formation and imaging of acini-like structures by Matrigel overlay of MCF10A cells was carried out according to established detailed protocol (22). Cell invasion through re-constituted ECM (Matrigel) was carried out essentially as described (23). All cell lines tested negative for mycoplasma; the identity of each cell line was not authenticated in our laboratory.
Mice and skin carcinogenesis model
Heparanase transgenic (Hpa-Tg) mice carrying human heparanase under the beta actin promoter, and heparanase knockout (KO) mice have been described (24, 25). Hpa-Tg and KO mice have been crossed for 10 generations with Balb/C and C57BL/6J mice, respectively, to produce pure genetic background (24, 25). Two-step carcinogenesis model was carried out according to established protocol. Briefly, the back of 8-10 weeks old mice was shaved and treated with a single application of 7, 12-dimethylbenz(a)anthracene (DMBA, Sigma; 50 μg/0.1 ml acetone) followed by application (twice weekly) of 12-otetradecanoylphorbol-13-acetate (TPA, Sigma; 10 μg/0.1 ml acetone). Mice were sacrificed after up to 20 weeks of TPA treatment, tumor lesions and adjacent skin tissue were harvested and fixed in cold 4% paraformaldehyde for histological examination, or were subjected to protein extraction and immunoblotting. In inhibition experiments, control and Hpa-Tg mice were subjected to DMBA/TPA treatment for 15 weeks, when small lesions start to appear in Hpa-Tg mice. The Hpa-Tg mice were then divided randomly into two groups and treated with saline or the heparanase inhibitor PG545 once weekly (400 μg/mouse, ip) for three weeks together with twice weekly administration of TPA. All animal experiments were approved by the Animal Care Committee of the Technion, Haifa, Israel.
Histology and immunohistochemistry
Histological examination and immunostaining of formalin-fixed, paraffin-embedded 5 micron sections was performed essentially as described (26). Alkaline phosphatase detection system (Cell Marque; Rocklin, CA) was utilized to visualize phospho-Akt staining (27). Images were acquired by Nikon ECLIPSE microscope and Digital Sight Camera (Nikon) with objectives 20x or 40x.
Statistics
Data are presented as mean ± SE. Statistical significance was analyzed by two-tailed Student's t test. The value of p<0.05 was considered significant.
Results
Heparanase over expression enhances the development of acini-like structures produced by MCF10A cells and tumor lesions produced by MCF10AT1 cells
In order to investigate the role of heparanase in the early stages of cancer development, we infected non-transformed MCF10A human breast cells with heparanase or its C-terminal domain (8C) gene constructs (Suppl. Fig. S1A) and high level of expression was confirmed by immunoblotting, activity assay and immunofluorescent staining (Suppl. Fig. S1B, C). Akt phosphorylation was not enhanced by heparanase/8C over expression in MCF10A cells grown on tissue culture plastic dishes (Suppl. Fig. S1D, left panels). Plating the cells on reconstituted basement membrane (Matrigel) resulted in substantial increase in Erk phosphorylation by all cell types, as would be expected (Suppl. Fig. S1D, right third panel). In striking contrast, Akt phosphorylation was increased markedly only by MCF10A cells over expression heparanase/8C (Suppl. Fig. S1D, right upper panel), in agreement with previous results relating heparanase and increased Akt phosphorylation (17, 23, 28, 29). Once plated on top, and overlaid with Matrigel, control (Mock) transfected MCF10A cells formed typical spherical acini-like structures composed of a single layer of epithelial cells and a hollow lumen (Fig. 1A, left panel). Notably, MCF10A cells over expressing heparanase or the 8C variant produced significantly bigger acini that appeared disorganized and lacked a lumen (Fig. 1A, middle and right panels).
Figure 1.

Heparanase promotes the formation of disorganized acinar structures by MCF10A cells and tumoriginicity of MCF10AT1 cells. A. Acinar structures formation. Control (Mock), heparanase (Hepa), and 8C-infected MCF10A cells were plated on, and overlaid with Matrigel for 10 days. Formation of three-dimensional acini-like structures was evaluated by fluorescent confocal imaging applying DAPI nuclei counterstaining. B. Tumorigenicity of MCF10AT1 cells. MCF10AT1 cells were infected with control (Mock), heparanase, or 8C gene constructs and inoculated into SCID/beige mouse mammary fat pad (n=6). Xenografts were harvested 12 weeks after cell transplantation and formalin-fixed, paraffin-embedded 5 micron sections were subjected to histological analyses. Shown are representative images of whole sections scanned by 3DHISTECH Pannoramic MIDI System attached to HITACHI HV-F22 color camera (3dhistech kft, Budapest, Hungary). C. Immunostaining. Xenografts produced by MCF10AT1 infected cells were stained with hematoxilin and eosin (left panels), anti- Ki67 (second left panels), anti-smooth muscle of actin (SMA, middle panels), anti-E-cadherin (second right panels), and anti-vimentin (right panels) antibodies. Original magnifications: left and right panels: ×40; middle panels ×10. Quantification of Ki67-positive cells is shown graphically in D. *p=0.01 for Mock vs. heparanase and Mock vs. 8C.
In order to examine these growth-advantage features of heparanase in vivo, we utilized MCF10AT1 cells that acquired the ability for xenograft growth after transfection with T24 HRas (30). MCF10AT1 cells were similarly infected with control or heparanase/8C gene constructs and expression levels comparable to those observed in MCF10A cells were validated (Suppl. Fig. S2A-C, upper panel). Over expression of heparanase or the 8C variant resulted in increased cell migration (Suppl. Fig. S2C, third panel; Suppl. Fig. S2D, left panel) and cell invasion (Suppl. Fig. S2C, fourth panel; Suppl. Fig. S2D, right panel) compared with control cells. Palpable lesions were not detected even 8 months after subcutaneous implantation of the MCF10AT1 cells. Small yet visible lesions were observed, however, after the mice were scarified and the implantation site exposed. Lesions formed by control (Mock) and heparanase- or 8C-over expressing MCF10AT1 cells appeared similar in size (Supp. Fig. S3A). Histological examination revealed structures characterized as atypical hyperplasia and ductal carcinoma in situ (DCIS) in lesions developed by control MCF10AT1 (Suppl. Fig. S3B, Mock), as expected (30, 31). In contrast, lesions developed by MCF10AT1 over expressing heparanase were diagnosed as invasive carcinoma (Suppl. Fig. S3B, upper panels, Hepa).
Implanting the MCF10AT1 cells in the mammary fat pad produced palpable lesions, and yielded noticeable differences. Over- expression of heparanase or its 8C variant resulted in far greater amount of highly cellular lesions (Fig. 1B, middle and right panels). Most importantly, while control cells developed into atypical hyperplasia/DCIS (Fig. 1C, upper left panel, Mock), lesions formed by heparanase- or 8C- over expressing MCF10AT1 cells were diagnosed as invasive carcinoma (Fig. 1C, left panels, arrows). These lesions exhibited higher levels of cell proliferation as indicated by staining for Ki67 (Fig. 1C, second left panels; Fig. 1D), decreased staining for SMA (Fig. 1C, middle panels) and E-cadherin (second right panels), and increased expression of vimentin (right panels) that signifies epithelialmesenchymal transition (EMT). Collectively, these results imply that heparanase and its signaling properties (8C) promote tumor expansion, co-operating with Ras.
Heparanase co-operates with Ras to drive skin cancer
In order to substantiate the cooperation observed between Ras and heparanase, we exposed Hpa-Tg and control Balb/C mice to two-steps DMBA/TPA skin carcinogenesis model because more than 90% of skin cancer initiated by DMBA contained Ha-Ras activating mutations (32). Hpa-Tg mice were far more sensitive to DMBA/TPA treatment. Noticeable lesions were developed by Hpa-Tg mice already after nine weeks of DMBA/TPA treatment whereas control mice did not show tumor lesions at this time (Suppl. Fig. S4A). At termination, 19 weeks after DMBA exposure, Hpa-Tg mice developed a significantly higher number and bigger tumor lesions compared with control mice (Fig. 2A; Suppl. Fig. S4B). Thus, an average of 10.2 tumor lesions were counted per Hpa-Tg mouse compared with 1.6 in control mice (Fig. 2B, left panel; p=1.5×10⁻⁷), exhibiting a combined average tumor weight of 0.63 gram per Hpa-Tg mouse compared with an average of 0.07 gram per control mouse (Fig. 2B, right panel; p=1.5x10⁻⁵). Histologically, lesions developed in control mice were diagnosed as a proliferative, hyperkeratosis process, whereas tumors developed by Hpa-Tg mice were diagnosed as atypical papilloma suspected early squamous cell carcinomas (Suppl. Fig. S5A). Heparanase was highly expressed in the tumor lesion and adjacent skin tissues of Hpa-Tg mice compared with control mouse tissues as indicated by immunoblotting (Fig. 2C) and immunostaining (Fig. 2D, left panels). This high level of heparanase expression was associated with increased cell proliferation as indicated by Ki67 staining in the tumor and skin tissues of Hpa-Tg mice (Fig. 2D, right panels; Fig. 2E), in agreement with accelerated tumor development in Hpa-Tg mice.
Figure 2.

Accelerated tumor development in Hpa-Tg mice exposed to DMBA/TPA skin carcinogenesis treatment. Control Balb/C (n=9) and Hpa-Tg mice (n=10) were exposed to DMBA/TPA treatment as described under 'Materials and Methods' for 19 weeks. At termination, mice were photographed (A), and the number of tumor lesions per mouse was counted and plotted as average number of lesions per mouse (B, left panel); Tumor lesions and adjacent skin tissues were harvested and combined from each mouse to determine tumor weight (B, right panel). Tumor lesions were fixed in 4% PFA for histological evaluation or subjected to protein extraction and immunoblotting analyses. Representative images of the whole tumor and adjacent skin sections are shown in A, right panels. C. Immunoblotting. Skin and tumor lesions were collected from control (Con) and Hpa-Tg (Tg) mice and lysate samples were subjected to immunoblotting applying anti-heparanase antibody, detecting the latent (65 kDa) and active (50 kDa) proteins. D. Immunostaining. Five-micron sections of tumor lesions (Lesion) and adjacent skin tissue (Adj. Skin) of control (Con, upper panels) and Hpa-Tg mice (Tg, lower panels) were subjected to immunostaining applying anti- heparanase (left panels) and anti-Ki67 (right panels) antibodies. Original magnification: ×20. Quantification of Ki67-positive cells is shown graphically in E. *p=0.004 for control vs. Tg lesions.
We next examined the phosphorylation levels of signaling components that are associated with accelerated tumor development in Hpa-Tg mice. Immunostaining for phospho-Erk yielded low reactivity in the skin tissue adjacent to the control tumor lesion (Fig. 3A, upper left panel). In striking contrast, strong phospho-Erk staining was observed in the skin tissue of Hpa-Tg mice (Fig. 3A, lower left panel). Surprisingly, however, low phospho-Erk staining was observed in the tumor lesions developed in control and Hpa-Tg mice (Fig. 3A, right panels), suggesting that Erk phosphorylation is associated with initiation but not the progression of tumors in Hpa-Tg mice. Notably, we found that Met phosphorylation is markedly increased in Hpa-Tg tumor lesions (Fig. 3B, upper and second panels). Likewise, Akt phosphorylation is increased in Hpa-Tg lesions compared with control lesions, localizing primarily to cell junctions and mirroring phospho-Met localization (Fig. 3B, third panels). Increased Akt activity is further revealed by reduced FOXO1 levels in Hpa-Tg tumor lesions (Fig. 3B, fourth levels) because Akt-dependent phosphorylation reduces the DNA-binding activity of FOXO1 and elicits its export from the nucleus to the cytoplasm. Cytoplasmic, Aktphosphorylated FOXO1 interacts with ubiquitin ligases (Skp2, MDM2) and is targeted for proteasomal degradation (33, 34). These results imply that increased Erk phosphorylation in Hpa-Tg skin is associated with tumor initiation while increased Met and Akt phosphorylation contributes to accelerated tumor progression.
Figure 3.

Accelerated tumor development in Hpa-Tg mice is associated with increased Erk, Met, and Akt phosphorylation. A. Phospho-Erk. Five-micron sections of tumor lesions (Lesion) and adjacent skin tissue (Adj. Skin) of control (Con, upper panels) and Hpa-Tg mice (Tg, lower panels) were subjected to immunostaining applying anti- phospho-Erk antibody. B. Tumor lesions of control (Con, left panels) and Hpa-Tg (Tg; right panels) mice were similarly stained with anti-phospho-Met (upper and second panels), anti-phospho-Akt (third panels), and anti-FOXO1 (lower panels) antibodies. Original magnification: upper and lower panels ×20; middle panels ×40.
Tumor development is severely attenuated in heparanase-KO mice
In order to further reveal the role of heparanase in tumor initiation and progression we next applied the DMBA/TPA protocol in heparanase knockout (Hpa-KO) and control C57/BL6 mice. Tumor formation appeared faster in the background of C57/BL6 compared with Balb/C mice, with lower incidence. By 19 weeks control C57/BL6 mice developed 4.25 tumor lesions in average per mouse (Fig. 4A, Con; Suppl. Fig. S4C). In striking contrast, Hpa-KO mice failed to develop noticeable lesions; in two out of eight Hpa-KO mice very small dysplastic lesions were observed (Fig. 4A, KO, arrow; Suppl. Fig. S4C, arrows) (p=3.8x10⁻⁶). Histological examination nonetheless identified the lesions developed in control and Hpa-KO mice as papilloma suspected early squamous cell carcinoma (Suppl. Fig. S5B). Surprisingly, phospho-Erk staining similar in magnitude was detected in the skin and tumor lesion of control and Hpa-KO mice (not shown). In contrast, phospho-Akt and phospho-Met staining were markedly reduced in the skin and tumor lesions, respectively, of Hpa-KO mice compared with control mice (Fig. 4C, left and middle panels) while FOXO1 levels were increased (Fig. 4C, right panels), further implying reduced Akt activity in Hpa-KO lesions. Moreover, the phosphorylation of Src in tumor extracts correlated with heparanase levels. Thus, a four-fold increase in Src phosphorylation was quantified in lesions developed in Hpa-Tg compared with control mice (Fig. 4D, left panels) whereas a marked decrease in Src phosphorylation was observed in the very small lesions developed by Hpa-KO mice (Fig. 4D, right panels), in agreement with previous results relating heparanase and Src phosphorylation (14, 21, 35).
Figure 4.

Tumor development is severely attenuated in Hpa-KO mice. Control C57/BL6 (n=8) and Hpa-KO mice (n=8) were exposed to DMBA/TPA treatment as described under 'Materials and Methods' for 19 weeks. At termination, mice were photographed (A), and the number of tumor lesions per mouse was counted and plotted as average number of lesions per mouse (B). Representative images of the whole sections of tumor lesions developed by control (Con) and Hpa-KO (KO) mice scanned by 3DHISTECH Pannoramic MIDI System attached to HITACHI HV-F22 color camera are shown in A, right panels. Tumor lesions and adjacent skin tissues were fixed in 4% PFA for histological evaluation or subjected to protein extraction and immunoblotting analyses. C. Immunostaining. Five-micron sections of tumor lesions (middle and right panels) and adjacent skin tissue (left panels) of control (Con, upper panels) and Hpa-KO (KO, lower panels) mice were subjected to immunostaining applying anti- phospho-Akt (pAkt, left panels), anti-phospho-Met (pMet, middle panels), and anti-FOXO1 (right panels) antibodies. Original magnification: left and middle panels ×40; right panel ×20. D. Immunoblotting. Extracts of tumor lesions developed by control (Con) or Hpa-Tg (Tg) (left panels) mice, and by control (Con) or Hpa-KO mice (KO) (right panels) were subjected to immunoblotting applying anti-phospho-Src (pSrc, upper panels), anti-Src (middle panels), and anti-actin (lower panels) antibodies.
It should be noted that tumors are developed faster and more aggressively in C57/BL6 than Balb/C mice. Thus, staining for signaling components appears most often stronger in control lesions developed in C57/BL6 (Fig. 4C) than Balb/C mice (Fig. 3B) (i.e., pMet). Rectangles in panel A mark skin tissue away from noticeable tumor lesion.
Tumor development is attenuated by heparanase inhibitor, PG545
In order to better appreciate the pro-tumorigenic function of heparanase in the DMBA/TPA model system and the underlying molecular mechanism, we have next utilized a heparanase inhibitor, PG545 (9). By 15 weeks, when small tumor lesions start to appear (Suppl. Fig. S6A, upper panel), Hpa-Tg mice were divided into two groups and PG545 was administrated once a week at 20 mg/kg (~400μg/mouse, ip) (9) for three weeks. As in previous experiments, Hpa-Tg mice were far more sensitive to DMBA/TPA treatment (Fig. 5A) and developed 13.3 lesions per mouse in average while no tumor lesions were seen in control mice (Fig. 5B). The number and size of tumors was decreased markedly in Hpa-Tg mice treated with PG545, reaching an average of 1.5 lesions per mouse, differences that are statistically highly significant (p=3×10⁻⁴, Fig. 5A, B; Suppl. Fig. 6A), and associating with decreased Akt phosphorylation (Fig. 5C, left panels) and activity as indicated by increased FOXO1 levels (Fig. 5C, right panels). In addition, recruitment of macrophages to the tumor lesions was markedly attenuated by PG545 treatment (Fig. 5D, upper panels) without noticeable change in macrophages content in the underlying skin tissue (Fig. 5D, lower panels). Histological examination diagnosed these lesions as papillomas, and revealed decreased downward epithelial proliferation in Hpa-Tg lesions treated with PG545 compared with untreated Hpa-Tg mice (not shown).
Figure 5.

Decreased tumor development in Hpa-Tg mice treated with PG545. Control Balb/C (n=10) and Hpa-Tg mice (n=14) were exposed to DMBA/TPA treatment as described under 'Materials and Methods'. After 15 weeks, when small tumor lesions became visible, Hpa-Tg mice were divided into two groups receiving PG545 (400μg/mouse, ip, once a week) or saline. Three weeks thereafter the mice were sacrificed and photographed (A), and the number of tumor lesions per mouse was counted and plotted as average number of lesions per mouse (B). C. Immunostaining. Five-micron sections of tumor lesion (Lesion) and skin tissue adjacent to the tumor lesion (Adj. Skin) of control (Con, upper panel), Hpa-Tg mice (Tg, middle panel), and Hpa-Tg mice treated with PG545 (Tg+PG) were subjected to immunostaining applying anti- phospho-Akt (left panels) and anti-FOXO1 (right panels) antibodies. Original magnification: left panels ×40; right panels ×20. D. Macrophages recruitment. Tumor lesions were similarly stained with anti-F4/80 antibody, a marker for macrophages. Note decreased infiltration of macrophages to tumors treated with PG545 without noticeable change in the presence of macrophages in the underlying skin tissue.
Prominent inhibition of tumor development in Hpa-Tg mice treated with PG545 suggests that heparanase enzymatic activity predominates, yet heparanase signaling, executed by the 8C variant, appears sufficient for tumor development by MCF10AT1 cells (Fig. 1B). We hypothesized that PG545 not only inhibits heparanase enzymatic activity but also its signaling capacity. Over expression of heparanase in MDA-MB-231 breast carcinoma cells resulted in a 2-fold increase in Akt phosphorylation (Fig. 6A, Hepa, upper panel). Akt phosphorylation was reduced markedly in cell treated with PG545 (Fig. 6A, +PG, upper panels) in a dose dependent manner (Fig. 6B), while Erk phosphorylation was not affected (Fig. 6A, lower panels). Akt phosphorylation was similarly elevated in A431 epidermoid carcinoma cells following exogenous addition of heparanase (Fig. 6C, left panels), and reduced Akt phosphorylation was observed in A431 cells treated with PG545 (Fig. 6C, right panels), suggesting that this reagent neutralizes both enzymatic and signaling properties of heparanase.
Figure 6.
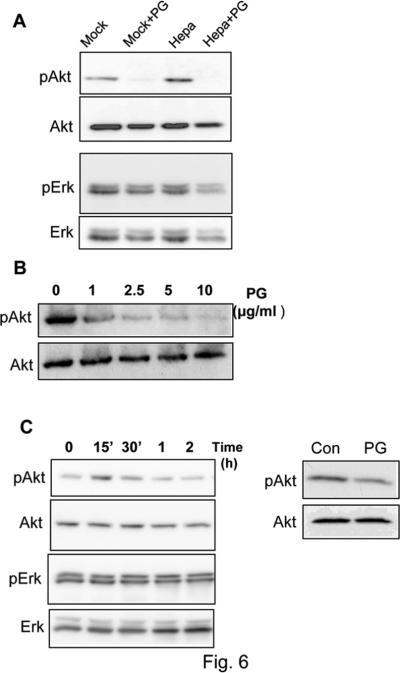
PG545 inhibits Akt phosphorylation. A. MDA-MB-231 breast carcinoma cells were infected with heparanase (Hepa) or an empty vector (Mock) and were left untreated or incubated for 20 h with PG545 (10 μg/ml; +PG). Lysate samples were then subjected to immunoblotting applying anti-phospho-Akt (upper panel), anti-Akt (second panel), anti phospho-Erk (third panel), and anti Erk (fourth panel) antibodies. B. Dose response. MDAMB-231 cells were incubated without (0) or with the indicated concentration of PG545. Lysate samples were then subjected to immunoblotting applying anti-phospho-Akt (upper panel) and anti-Akt (second panel) antibodies. C. Latent heparanase was added to A431 epidermoid carcinoma cells for the time indicated and cell lysates were subjected to immunoblotting applying anti-phospho-Akt (upper panel), anti-Akt (second panel), anti-pErk (third panel) and anti-Erk2 (lower panel) antibodies (left panels). A431 cells were left incubated without (Con) or with PG545 (20 h, 10 μg/ml; PG) and lysate samples were subjected to immunoblotting applying anti-phospho-Akt (upper apnel) and anti-Akt (lower panel) antibodies (right panels).
Discussion
Compelling evidence tie heparanase with human cancer, but the timing of its induction and the significance of heparanase in the early phases of tumor initiation and development are largely obscure. In several examples (i.e., colon and esophagus) (36, 37), heparanase expression is induced already at the very early stages of tumor initiation. Results of the current study suggest that elevated levels of heparanase early on have a prominent impact on tumor expansion and aggressiveness. This is exemplified by bigger, asymmetrical and disorganized (i.e., lacking hollow lumen) acinar structures developed by MCF10A cells over expressing heparanase or the 8C variant (Fig. 1A), and was most evident in MCF10AT1 cells. Over expression of heparanase or the 8C variant in MCF10AT1 cells noticeably enhanced the expansion of tumor xenografts developed in the mammary fat pad (Fig. 1B). These lesions, as well as lesions developed subcutaneously (Suppl. Fig. S3B, upper panel), progress into invasive carcinoma compared with DCIS developed by control lesions (Fig. 1C, left panels; Suppl. Fig. S3B, upper panels). Xenograft expansion by heparanase/8C over expression was associated with increased cell proliferation, marked reduction in the levels of SMA and E-cadherin, and elevation of vimentin expression (Fig. 1C), collectively signifying EMT which is considered a key process in cancer cell metastasis and acquired resistance to apoptosis (38-40). This, and the development of lymphatic vasculature within the tumor lesion (Suppl. Fig. S3B, lower panel), strongly signify a progressive disease. The pro-metastatic function of heparanase thus emerges to uniquely combine cell invasion, activation of EMT program, and increased vascular and lymphatic vessel density that mobilize metastatic cells to distant organs (1, 2). This is accomplished by enzymatic (invasion and ECM remodeling) and nonenzymatic (cell migration, EMT) properties of heparanase, the latter critically exemplified by the 8C variant.
Since MCF10AT1 cells were generated by over expression of active H-Ras in nontumorigenic MCF10A cells, we rationalized that heparanase co-operates with Ras to promote tumor progression. This notion is critically established by utilizing the DMBA/TPA two-step skin carcinogenesis model system. By itself, heparanase does not function as an oncogene and its over expression by essentially all tissues and cell types of the Hpa-Tg mice does not lead to tumor initiation over the life span of a mouse [(25) and data not shown]. However, combining heparanase over expression with Ras activation by applying DMBA/TPA led to a 10-fold increase in the number and size of tumor lesions (Fig. 2A, B; Fig. 5A, B; Suppl. Figs. S4A, B, & S6). Moreover, lesions developed by Hpa-Tg mice appeared more advanced histologically (Suppl. Fig. S5), and exhibited higher proliferative capacity in the tumor lesion and adjacent skin tissue as indicated by Ki67 staining (Fig. 2D, E). As striking was the remarkable decrease in tumor development observed in Hpa-KO mice subjected to the DMBA/TPA treatment (Fig. 4A, B; Suppl. Fig. S4C). Tumor lesions were hardly noticed by gross examination of the Hpa-KO mice (KO; Fig. 4A, arrow). Moreover, histological examination of skin tissue away from noticeable lesions (Fig. 4A, rectangles) revealed tumor initiation in control but not KO mice (Suppl. Fig. S6B), further indicating low tumor incidence in the absence of heparanase. Noteworthy, DMBA alone did not elicit pre-malignant or malignant process in control or Hpa-Tg mice even six months after its administration (Suppl. Fig. S7A, left panels). Similarly, TPA applied without prior DMBA application was not sufficient to drive tumor formation in Hpa-Tg mice (Suppl. Fig. S7A, right panels). This may suggest that heparanase co-operation with Ras is a major driving force in this skin cancer model, yet other mechanisms promoted by TPA cannot be ignored. Most relevant are inflammation induction and protein kinase C (PKC) activation by TPA. The essential contribution of inflammation to tumor development and progression has gained increasing acceptance (41, 42). TPA elicits a strong inflammatory reaction that likely facilitates the development of skin tumors (43). Given the co-operation of heparanase and inflammation in the aggravation of colon cancer (44), it is conceivable that a similar mechanism also occurs in the skin. TPA is also well known for its ability to activate PKC, a group of at least 10 related isoforms that are highly implicated in cancer progression (45, 46). Unlike the transient activation of PKC by the endogenous second messenger diacylglycerol (DAG) owing to its fast metabolism, the action of TPA is sustained, leading to prolonged activation of PKCs. The possible co-operation of heparanase with inflammation and PKCs in this model system is feasible, but awaits further in-depth investigation.
In order to appreciate the molecular mechanism underlying the tumor-promoting function of heparanase we applied immunohistochemical analyses, examining the tumor lesion, immediate adjacent skin, and skin tissue without a noticeable tumor lesion (Fig. 4A, rectangles). Erk phosphorylation was increased in the skin of Hpa-Tg mice treated with TPA alone compared with control mice (Suppl. Fig. 7B, lower panels). Erk phosphorylation was also markedly increased in the skin tissue adjacent to the tumor lesion in Hpa-Tg compared with control mice (Fig. 3A, left panels). Surprisingly, Erk phosphorylation appeared equally low in the tumor lesions developed in Hpa-Tg and control mice (Fig. 3A, right panels), suggesting that Erk phosphorylation is essential for the tumor initiation and promotion phases but to a lesser extent in the later stages of tumor progression in this model (47). Instead, we found that Met phosphorylation is increased in the tumor lesions developed by Hpa-Tg mice compared with control mice (pMet; Fig. 3B, upper two panels), suggesting that this pathway possibly mediates tumor expansion. Furthermore, we found that Akt phosphorylation is increased in lesions developed by Hpa-Tg mice compared with control lesion (pAkt; Fig. 3B, third panels), yet, the result which distinguished most markedly between the two types of lesions was staining for the Akt substrate, FOXO1 (Fig. 3B, lower panel). FOXO1 is a direct substrate of Akt; phosphorylation of FOXO1 by Akt results in exclusion of FOXO1 from the nucleus and its translocation to the cytoplasm where it is subjected to proteasomal degradation following ubiquitination (33, 34). Indeed, whereas FOXO1 is readily detected in lesions developed in control mice, localizing to the cell nuclei, its levels are reduced substantially in tumor lesions developed in Hpa-Tg mice (Fig. 3B), thus indirectly reflecting increased Akt activity by heparanase. This is in agreement with previous results showing decreased FOXO1 levels in tumor xenografts produced by U87 glioma cells over expressing heparanase (27). Met phosphorylation and Akt activity appear most relevant to tumor promotion by heparanase because these signaling pathways are inhibited considerably in lesions developed by Hpa-KO mice (Fig. 4C; Suppl. Fig. S6B). Moreover, Akt phosphorylation was reduced and FOXO1 levels were increased following treatment with the heparanase inhibitor PG545 (Fig. 5C). We also found that PG545 inhibits Akt phosphorylation in vitro (Fig. 6), suggesting that this compound neutralizes both enzymatic activity and signaling properties of heparanase and thus govern its potency in vivo. Inhibition of Akt phosphorylation by PG545 appeared more prominent in breast MDA-MB-231 cells that carry K-Ras mutation compared with A431 cells that expresses normal Ras (48, 49), suggesting that patients that are diagnosed with high levels of heparanase and also carry Ras mutation may benefit the most from PG545 treatment. Studies examining this aspect in breast and skin/melanoma cell lines are currently in progress. We were unable to obtain a reproducible staining for phospho-Src. In immunoblotting, nonetheless, Src phosphorylation is increased 4-folds in tumors developed in Hpa-Tg mice whereas a comparable decrease was observed in lesions developed in Hpa-KO mice (Fig. 4D), collectively positioning Akt and possibly Src phosphorylation as major determinants underlying the pro-tumorigenic capacity of heparanase.
Marked decrease in tumor-associated macrophages following treatment with PG545 (Fig. 5D) is in agreement with previous results in a model of pancreatic cancer (50) and provides additional mechanism for attenuated tumor expansion by heparanase inhibitors.
Co-operation of heparanase and Ras described above in pre-clinical tumor models is likely to be clinically relevant because mutant forms of Ras function as driver oncogenes in approximately one third of human cancers (51). Most recent example is the frequent mutations in KRas, NRas and BRaf identified in sub-clonal myeloma cell populations (52). Heparanase promotes myeloma growth, dissemination, and angiogenesis (53, 54), and heparanase inhibitor (Roneparstat = SST0001) is being tested in phase I clinical trial in myeloma patients. The aggressive phenotype exerted by heparanase in myeloma is largely attributed to increased syndecan-1 expression and shedding because this proteoglycan is considered critical determinant of myeloma cell survival and growth (55-57). Co-operation with Ras may provide another mechanism for the pro-tumorigenic function of heparanase in myeloma and possibly other hematological and solid malignancies carrying Ras mutation (58).
Taken together, our results indicate that heparanase plays a decisive role in tumor development, mediated in part by activation of Erk, Akt, Src, and Met phosphorylation. The heparanase inhibitor PG545 potently attenuates tumor progression in a model system that appears relevant to the development of human cancer (i.e., exposure to carcinogens, acquired mutations, activation of oncogenes), and seems to neutralize both enzymatic and signaling properties of heparanase, lending hope for a favorable outcome in the clinic.
Supplementary Material
Acknowledgments
This study was supported by the Israel Science Foundation (grant 549/06); National Cancer Institute, NIH (grant CA106456); the Israel Cancer Research Fund (ICRF Professorship award); and the Rappaport Family Institute Fund to I. Vlodavsky.
Footnotes
Authors' contribution:
Conception and design: IV, NI
Development of methodology: IB, NI
Acquisition of data: IB, UB, NI
Analysis and interpretation of data: IB, UB, NI, IV, IN
Writing, review, and/or revision of the manuscript: NI, IV, EH
Administrative, technical, or material support: EH, J-PL
Study supervision: IV
Conflict of interest: Edward Hammond is employed by Progen Pharmaceuticals, Brisbane, Queensland, Australia. All other authors have no potential conflict of interest to declare.
References
- 1.Barash U, Cohen-Kaplan V, Dowek I, Sanderson RD, Ilan N, Vlodavsky I. Proteoglycans in health and disease: new concepts for heparanase function in tumor progression and metastasis. FEBS J. 2010;277:3890–903. doi: 10.1111/j.1742-4658.2010.07799.x. [DOI] [PMC free article] [PubMed] [Google Scholar]
- 2.Ilan N, Elkin M, Vlodavsky I. Regulation, function and clinical significance of heparanase in cancer metastasis and angiogenesis. Intl J Biochem & Cell Biol. 2006;38:2018–39. doi: 10.1016/j.biocel.2006.06.004. [DOI] [PubMed] [Google Scholar]
- 3.Parish CR, Freeman C, Hulett MD. Heparanase: a key enzyme involved in cell invasion. Biochim Biophys Acta. 2001;1471:M99–108. doi: 10.1016/s0304-419x(01)00017-8. [DOI] [PubMed] [Google Scholar]
- 4.Vlodavsky I, Friedmann Y. Molecular properties and involvement of heparanase in cancer metastasis and angiogenesis. J Clin Invest. 2001;108:341–7. doi: 10.1172/JCI13662. [DOI] [PMC free article] [PubMed] [Google Scholar]
- 5.Fux L, Ilan N, Sanderson RD, Vlodavsky I. Heparanase: busy at the cell surface. Trends Biochem Sci. 2009;34:511–9. doi: 10.1016/j.tibs.2009.06.005. [DOI] [PMC free article] [PubMed] [Google Scholar]
- 6.Arvatz G, Shafat I, Levy-Adam F, Ilan N, Vlodavsky I. The heparanase system and tumor metastasis: is heparanase the seed and soil? Cancer Metastasis Rev. 2011;30:253–68. doi: 10.1007/s10555-011-9288-x. [DOI] [PubMed] [Google Scholar]
- 7.Vreys V, David G. Mammalian heparanase: what is the message? J Cell Mol Med. 2007;11:427–52. doi: 10.1111/j.1582-4934.2007.00039.x. [DOI] [PMC free article] [PubMed] [Google Scholar]
- 8.Vlodavsky I, Beckhove P, Lerner I, Pisano C, Meirovitz A, Ilan N, et al. Significance of heparanase in cancer and inflammation. Cancer Microenviron. 2012;5:115–32. doi: 10.1007/s12307-011-0082-7. [DOI] [PMC free article] [PubMed] [Google Scholar]
- 9.Dredge K, Hammond E, Handley P, Gonda TJ, Smith MT, Vincent C, et al. PG545, a dual heparanase and angiogenesis inhibitor, induces potent anti-tumour and anti-metastatic efficacy in preclinical models. Br J Cancer. 2011;104:635–42. doi: 10.1038/bjc.2011.11. [DOI] [PMC free article] [PubMed] [Google Scholar]
- 10.Ritchie JP, Ramani VC, Ren Y, Naggi A, Torri G, Casu B, et al. SST0001, a chemically modified heparin, inhibits myeloma growth and angiogenesis via disruption of the heparanase/syndecan-1 axis. Clin Cancer Res. 2011;17:1382–93. doi: 10.1158/1078-0432.CCR-10-2476. [DOI] [PMC free article] [PubMed] [Google Scholar]
- 11.Barash U, Cohen-Kaplan V, Arvatz G, Gingis-Velitski S, Levy-Adam F, Nativ O, et al. A novel human heparanase splice variant, T5, endowed with protumorigenic characteristics. FASEB J. 2010;24:1239–48. doi: 10.1096/fj.09-147074. [DOI] [PMC free article] [PubMed] [Google Scholar]
- 12.Cohen I, Pappo O, Elkin M, San T, Bar-Shavit R, Hazan R, et al. Heparanase promotes growth, angiogenesis and survival of primary breast tumors. Intl J Cancer. 2006;118:1609–17. doi: 10.1002/ijc.21552. [DOI] [PubMed] [Google Scholar]
- 13.Yang Y, Macleod V, Bendre M, Huang Y, Theus AM, Miao HQ, et al. Heparanase promotes the spontaneous metastasis of myeloma cells to bone. Blood. 2005;105:1303–9. doi: 10.1182/blood-2004-06-2141. [DOI] [PubMed] [Google Scholar]
- 14.Zetser A, Bashenko Y, Edovitsky E, Levy-Adam F, Vlodavsky I, Ilan N. Heparanase induces vascular endothelial growth factor expression: correlation with p38 phosphorylation levels and Src activation. Cancer Res. 2006;66:1455–63. doi: 10.1158/0008-5472.CAN-05-1811. [DOI] [PubMed] [Google Scholar]
- 15.Lerner I, Baraz L, Pikarsky E, Meirovitz A, Edovitsky E, Peretz T, et al. Function of heparanase in prostate tumorigenesis: potential for therapy. Clin Cancer Res. 2008;14:668–76. doi: 10.1158/1078-0432.CCR-07-1866. [DOI] [PubMed] [Google Scholar]
- 16.Basche M, Gustafson DL, Holden SN, O'Bryant CL, Gore L, Witta S, et al. A phase I biological and pharmacologic study of the heparanase inhibitor PI-88 in patients with advanced solid tumors. Clin Cancer Res. 2006;12:5471–80. doi: 10.1158/1078-0432.CCR-05-2423. [DOI] [PubMed] [Google Scholar]
- 17.Fux L, Feibish N, Cohen-Kaplan V, Gingis-Velitski S, Feld S, Geffen C, et al. Structure-function approach identifies a COOH-terminal domain that mediates heparanase signaling. Cancer Res. 2009;69:1758–67. doi: 10.1158/0008-5472.CAN-08-1837. [DOI] [PMC free article] [PubMed] [Google Scholar]
- 18.Zetser A, Levy-Adam F, Kaplan V, Gingis-Velitski S, Bashenko Y, Schubert S, et al. Processing and activation of latent heparanase occurs in lysosomes. J Cell Sci. 2004;117:2249–58. doi: 10.1242/jcs.01068. [DOI] [PubMed] [Google Scholar]
- 19.Katz M, Amit I, Citri A, Shay T, Carvalho S, Lavi S, et al. A reciprocal tensin-3-cten switch mediates EGF-driven mammary cell migration. Nature Cell Biol. 2007;9:961–9. doi: 10.1038/ncb1622. [DOI] [PubMed] [Google Scholar]
- 20.Nangia-Makker P, Raz T, Tait L, Shekhar MP, Li H, Balan V, et al. Ocimum gratissimum retards breast cancer growth and progression and is a natural inhibitor of matrix metalloproteases. Cancer Biol & Therapy. 2013:14. doi: 10.4161/cbt.23762. [DOI] [PMC free article] [PubMed] [Google Scholar]
- 21.Cohen-Kaplan V, Doweck I, Naroditsky I, Vlodavsky I, Ilan N. Heparanase augments epidermal growth factor receptor phosphorylation: correlation with head and neck tumor progression. Cancer Res. 2008;68:10077–85. doi: 10.1158/0008-5472.CAN-08-2910. [DOI] [PMC free article] [PubMed] [Google Scholar]
- 22.Debnath J, Muthuswamy SK, Brugge JS. Morphogenesis and oncogenesis of MCF-10A mammary epithelial acini grown in three-dimensional basement membrane cultures. Methods. 2003;30:256–68. doi: 10.1016/s1046-2023(03)00032-x. [DOI] [PubMed] [Google Scholar]
- 23.Gingis-Velitski S, Zetser A, Flugelman MY, Vlodavsky I, Ilan N. Heparanase induces endothelial cell migration via protein kinase B/Akt activation. J Biol Chem. 2004;279:23536–41. doi: 10.1074/jbc.M400554200. [DOI] [PubMed] [Google Scholar]
- 24.Zcharia E, Jia J, Zhang X, Baraz L, Lindahl U, Peretz T, et al. Newly generated heparanase knock-out mice unravel co-regulation of heparanase and matrix metalloproteinases. PloS one. 2009;4:e5181. doi: 10.1371/journal.pone.0005181. [DOI] [PMC free article] [PubMed] [Google Scholar]
- 25.Zcharia E, Metzger S, Chajek-ShaulL T, Aingorn H, Elikn M, Friedmann Y, et al. Transgenic expression of mammalian heparanase uncovers physiological functions of heparan sulfate in tissue morphogenesis, vascularization, and feeding behavior. FASEB J. 2004;18:252–63. doi: 10.1096/fj.03-0572com. [DOI] [PubMed] [Google Scholar]
- 26.Cohen-Kaplan V, Naroditsky I, Zetser A, Ilan N, Vlodavsky I, Doweck I. Heparanase induces VEGF C and facilitates tumor lymphangiogenesis. Intl J Cancer. 2008;123:2566–73. doi: 10.1002/ijc.23898. [DOI] [PMC free article] [PubMed] [Google Scholar]
- 27.Arvatz G, Barash U, Nativ O, Ilan N, Vlodavsky I. Post-transcriptional regulation of heparanase gene expression by a 3′ AU-rich element. FASEB J. 2011;24:4969–76. doi: 10.1096/fj.10-156372. [DOI] [PMC free article] [PubMed] [Google Scholar]
- 28.Ben-Zaken O, Gingis-Velitski S, Vlodavsky I, Ilan N. Heparanase induces Akt phosphorylation via a lipid raft receptor. Biochem Biophys Res Commun. 2007;361:829–34. doi: 10.1016/j.bbrc.2007.06.188. [DOI] [PMC free article] [PubMed] [Google Scholar]
- 29.Riaz A, Ilan N, Vlodavsky I, Li JP, Johansson S. Characterization of Heparanase-induced Phosphatidylinositol 3-Kinase-AKT Activation and Its Integrin Dependence. J Biol Chem. 2013;288:12366–75. doi: 10.1074/jbc.M112.435172. [DOI] [PMC free article] [PubMed] [Google Scholar]
- 30.Miller FR. Xenograft models of premalignant breast disease. J Mammary Gland Biology and Neoplasia. 2000;5:379–91. doi: 10.1023/a:1009577811584. [DOI] [PubMed] [Google Scholar]
- 31.Dawson PJ, Wolman SR, Tait L, Heppner GH, Miller FR. MCF10AT: a model for the evolution of cancer from proliferative breast disease. Am J Pathol. 1996;148:313–9. [PMC free article] [PubMed] [Google Scholar]
- 32.Schwarz M, Munzel PA, Braeuning A. Non-melanoma skin cancer in mouse and man. Arch Toxicol. 2013;87:783–98. doi: 10.1007/s00204-012-0998-9. [DOI] [PubMed] [Google Scholar]
- 33.Vogt PK, Jiang H, Aoki M. Triple layer control: phosphorylation, acetylation and ubiquitination of FOXO proteins. Cell Cycle. 2005;4:908–13. doi: 10.4161/cc.4.7.1796. [DOI] [PubMed] [Google Scholar]
- 34.Aoki M, Jiang H, Vogt PK. Proteasomal degradation of the FoxO1 transcriptional regulator in cells transformed by the P3k and Akt oncoproteins. Proc Natl Acad Sci USA. 2004;101:13613–7. doi: 10.1073/pnas.0405454101. [DOI] [PMC free article] [PubMed] [Google Scholar]
- 35.Cohen-Kaplan V, Jrbashyan J, Yanir Y, Naroditsky I, Ben-Izhak O, Ilan N, et al. Heparanase Induces Signal Transducer and Activator of Transcription (STAT) Protein Phosphorylation: Preclinical and clinical significance in head and neck cancer. J Biol Chem. 2012;287:6668–78. doi: 10.1074/jbc.M111.271346. [DOI] [PMC free article] [PubMed] [Google Scholar]
- 36.Brun R, Naroditsky I, Waterman M, Ben-Izhak O, Groisman G, Ilan N, et al. Heparanase expression by Barrett's epithelium and during esophageal carcinoma progression. Mod Pathol. 2009;22:1548–54. doi: 10.1038/modpathol.2009.115. [DOI] [PubMed] [Google Scholar]
- 37.Friedmann Y, Vlodavsky I, Aingorn H, Aviv A, Peretz T, Pecker I, et al. Expression of heparanase in normal, dysplastic, and neoplastic human colonic mucosa and stroma. Evidence for its role in colonic tumorigenesis. Am J Pathol. 2000;157:1167–75. doi: 10.1016/S0002-9440(10)64632-9. [DOI] [PMC free article] [PubMed] [Google Scholar]
- 38.Chaffer CL, Weinberg RA. A perspective on cancer cell metastasis. Science. 2011;331:1559–64. doi: 10.1126/science.1203543. [DOI] [PubMed] [Google Scholar]
- 39.Nieto MA. Epithelial plasticity: a common theme in embryonic and cancer cells. Science. 2013;342:1234850. doi: 10.1126/science.1234850. [DOI] [PubMed] [Google Scholar]
- 40.Tiwari N, Gheldof A, Tatari M, Christofori G. EMT as the ultimate survival mechanism of cancer cells. Semin Cancer Biol. 2012;22:194–207. doi: 10.1016/j.semcancer.2012.02.013. [DOI] [PubMed] [Google Scholar]
- 41.Grivennikov SI, Greten FR, Karin M. Immunity, inflammation, and cancer. Cell. 2010;140:883–99. doi: 10.1016/j.cell.2010.01.025. [DOI] [PMC free article] [PubMed] [Google Scholar]
- 42.Hanahan D, Weinberg RA. Hallmarks of cancer: the next generation. Cell. 2011;144:646–74. doi: 10.1016/j.cell.2011.02.013. [DOI] [PubMed] [Google Scholar]
- 43.Mueller MM. Inflammation in epithelial skin tumours: old stories and new ideas. Eur J Cancer. 2006;42:735–44. doi: 10.1016/j.ejca.2006.01.014. [DOI] [PubMed] [Google Scholar]
- 44.Lerner I, Hermano E, Zcharia E, Rodkin D, Bulvik R, Doviner V, et al. Heparanase powers a chronic inflammatory circuit that promotes colitis-associated tumorigenesis in mice. J Clin Invest. 2011;121:1709–21. doi: 10.1172/JCI43792. [DOI] [PMC free article] [PubMed] [Google Scholar]
- 45.Bosco R, Melloni E, Celeghini C, Rimondi E, Vaccarezza M, Zauli G. Fine tuning of protein kinase C (PKC) isoforms in cancer: shortening the distance from the laboratory to the bedside. Mini Rev Med Chem. 2011;11:185–99. doi: 10.2174/138955711795049899. [DOI] [PubMed] [Google Scholar]
- 46.Griner EM, Kazanietz MG. Protein kinase C and other diacylglycerol effectors in cancer. Nat Rev Cancer. 2007;7:281–94. doi: 10.1038/nrc2110. [DOI] [PubMed] [Google Scholar]
- 47.Deschenes-Simard X, Kottakis F, Meloche S, Ferbeyre G. ERKs in cancer: friends or foes? Cancer Res. 2014;74:412–9. doi: 10.1158/0008-5472.CAN-13-2381. [DOI] [PubMed] [Google Scholar]
- 48.Hollestelle A, Elstrodt F, Nagel JH, Kallemeijn WW, Schutte M. Phosphatidylinositol-3-OH kinase or RAS pathway mutations in human breast cancer cell lines. Mol Cancer Res. 2007;5:195–201. doi: 10.1158/1541-7786.MCR-06-0263. [DOI] [PubMed] [Google Scholar]
- 49.Ma Y, Guo FC, Wang W, Shi HS, Li D, Wang YS. Kras gene mutation as a predictor of cancer cell responsiveness to metformin. Mol Med Rep. 2013;8:763–8. doi: 10.3892/mmr.2013.1596. [DOI] [PubMed] [Google Scholar]
- 50.Ostapoff KT, Awasthi N, Cenik BK, Hinz S, Dredge K, Schwarz RE, et al. PG545, an angiogenesis and heparanase inhibitor, reduces primary tumor growth and metastasis in experimental pancreatic cancer. Mol Cancer Ther. 2013;12:1190–201. doi: 10.1158/1535-7163.MCT-12-1123. [DOI] [PubMed] [Google Scholar]
- 51.Malumbres M, Barbacid M. RAS oncogenes: the first 30 years. Nat Rev Cancer. 2003;3:459–65. doi: 10.1038/nrc1097. [DOI] [PubMed] [Google Scholar]
- 52.Lohr JG, Stojanov P, Carter SL, Cruz-Gordillo P, Lawrence MS, Auclair D, et al. Widespread genetic heterogeneity in multiple myeloma: implications for targeted therapy. Cancer Cell. 2014;25:91–101. doi: 10.1016/j.ccr.2013.12.015. [DOI] [PMC free article] [PubMed] [Google Scholar]
- 53.Kelly T, Miao H- Q, Yang Y, Navarro E, Kussie P, Huang Y, et al. High heparanase activity in multiple myeloma is associated with elevated microvessel density. Cancer Res. 2003;63:8749–56. [PubMed] [Google Scholar]
- 54.Mahtouk K, Hose D, Raynaud P, Hundemer M, Jourdan M, Jourdan E, et al. Heparanase influences expression and shedding of syndecan-1, and its expression by the bone marrow environment is a bad prognostic factor in multiple myeloma. Blood. 2007;109:4914–23. doi: 10.1182/blood-2006-08-043232. [DOI] [PMC free article] [PubMed] [Google Scholar]
- 55.Iozzo RV, Sanderson RD. Proteoglycans in cancer biology, tumour microenvironment and angiogenesis. J Cell Mol Med. 2011;15:1013–31. doi: 10.1111/j.1582-4934.2010.01236.x. [DOI] [PMC free article] [PubMed] [Google Scholar]
- 56.Ramani VC, Purushothaman A, Stewart MD, Thompson CA, Vlodavsky I, Au JL, et al. The heparanase/syndecan-1 axis in cancer: mechanisms and therapies. FEBS J. 2013;280:2294–2306. doi: 10.1111/febs.12168. [DOI] [PMC free article] [PubMed] [Google Scholar]
- 57.Sanderson RD, Iozzo RV. Targeting heparanase for cancer therapy at the tumor-matrix interface. Matrix Biol. 2012;31:283–4. doi: 10.1016/j.matbio.2012.05.001. [DOI] [PubMed] [Google Scholar]
- 58.Su F, Viros A, Milagre C, Trunzer K, Bollag G, Spleiss O, et al. RAS mutations in cutaneous squamous-cell carcinomas in patients treated with BRAF inhibitors. New England J Med. 2012;366:207–15. doi: 10.1056/NEJMoa1105358. [DOI] [PMC free article] [PubMed] [Google Scholar]
Associated Data
This section collects any data citations, data availability statements, or supplementary materials included in this article.