The exocytosis process is a key factor in determining the biological behavior of engineered nano-carriers in drug delivery, affecting the release rate and half-life of the nano-carriers in cells.[1] Understanding the factors that control exocytosis will contribute to the development of more effective nano-carriers.
The exocytosis rate of nano-carriers is affected by multiple factors including size,[2] shape,[3] and surface functionality.[4] Controllable exocytosis rates of nanomaterials leads to tunable retention times in cells, allowing controllable release of drug inside the cells.[5] In our study, nanoparticles featuring identical size and a common structure were used to probe the role of surface properties on particle clearance. We examined the exocytosis of cationic gold nanoparticles (AuNPs) of identical core size (2 nm diameter) and different surface functionalities. Here, we report that surface functionality is an important factor for determining the exocytosis rate of nano-carriers, as quantified by inductively-coupled plasma mass spectrometry (ICP-MS) in both closed and flow systems.
To address the specific role of surface functionality in exocytosis, we have designed a series of AuNPs with that allow us to explore the effects of specific chemical functionality on exocytosis. The Brust-Schiffrin two-phase synthesis method[6] and the Murray place-exchange method were used to obtain the functionalized AuNPs 1-5,[7] featuring nanoparticles of identical size, and analogous structure (detailed ligand synthesis, gold nanoparticle synthesis, and characterization are available in the Supporting Information).
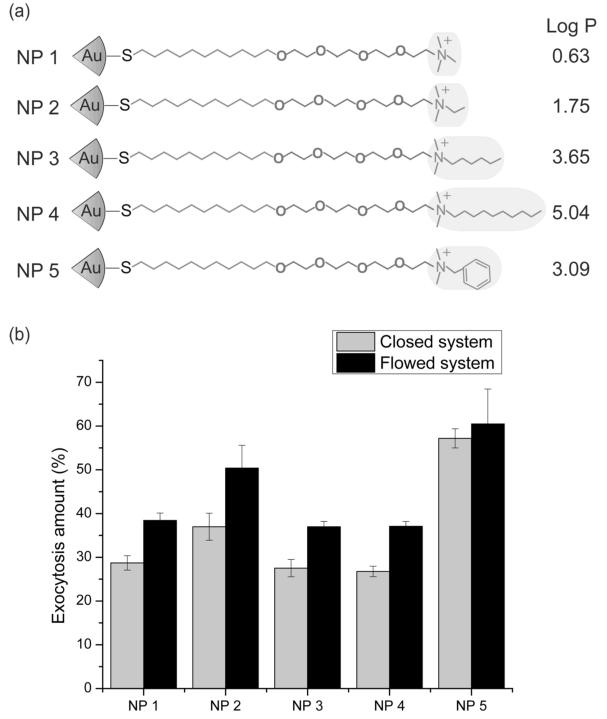
Breast cancer cells (MCF-7) were incubated with media containing NPs (200 nM) shown in Figure 1a for 3 h before removing and replacing with NP-free media. The concentration (200 nM) of NPs used has been shown to not induce cell damage or membrane leakage.[8] NP exocytosis amounts were then determined over a 6 h period using both a closed system and a flow system in which the media were continuously pumped through the cell culture plate and then collected for analysis using inductively-coupled plasma mass spectrometry (ICP-MS) (Figure 1b). The percentage of exocytosed AuNPs was calculated by Equation 1.
| (Equation 1) |
Figure 1.
(a) Structural illustrations of the NPs used in this study and the calculated hydrophobic values (Log P) of the highlighted headgroups. (b) Percentage of NPs exocytosed compared to endocytosed amounts in a closed and flow system after 6 h. The exocytosis amount (%) was determined with Eq. (1) using the amount of gold in the collected cell culture media (indicating the exocytosis amount of AuNPs) and the total endocytosed gold amount after collection of the cells.
In this equation, Exo is the amount of exocytosed AuNPs (ng), and Cell is the amount of AuNPs remaining in the cells (ng). As expected, higher exocytotic efficiency was provided by the dynamic system (Figure 1b).[9] Previous research showed that multiple aspects of NP-biological interaction can be correlated to the hydrophobicity of the NPs using a predicted log P of the head groups as a measure.[10] As shown in Figure 1, there is not an obvious trend in exocytosed gold amount based on ligand hydrophobicity for NP 1, 3, and 4. .In contrast, NP5 with aromatic ligands shows a significant increase in exocytosed gold amount compared to other NPs, suggesting that chemical structure is an important determination of exocytosis.
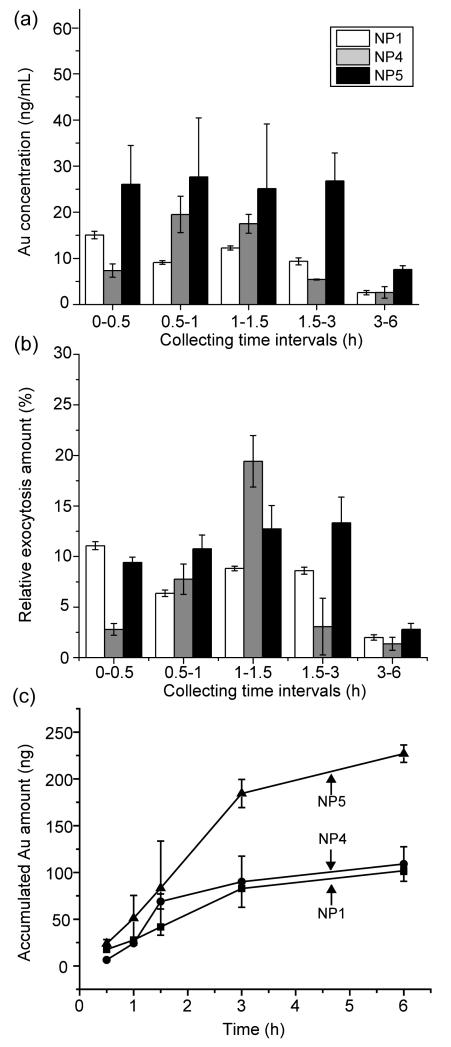
We next explored the kinetics of the exocytosis using a subset of the original particles, We selected NP 1, 4, and 5 (least hydrophobic, most hydrophobic, and aromatic NPs, respectively) to further evaluate the effect of surface functionality (e.g., hydrophobicity or structural functionality) on exocytosis. These NPs were incubated with cells for 3 h and washed using NP-free media three times to remove the NPs attached on the surface of cells. Then, the flow system was employed to measure the extent of exocytosis under dynamic conditions, with the gold amount in the media quantified over time by ICP-MS (Figure 2). The gold concentration in the collected media at different time points was measured (Figure 2a). The amount of excreted AuNPs out of the total uptake amount for each AuNP was determined at different time points with Eq. (1) (Figure 2b). As shown in Figure 2c, most of the AuNPs are exocytosed during the first 3 h with the majority of NP 4 excreted after 1.5 h. NP 5 is exocytosed to the greatest extent, but this NP is also taken up by the cells to a greater extent than NPs 1 or 4. Even so, a higher percentage of NP 5 is excreted than NP 1 or 4 (Figure 1). These results suggest that the aromatic structure of the surface ligand of NP 5 plays an important role in regulating NP cellular exocytosis.
Figure 2.
Exocytosis amount of NPs monitored by ICP-MS in the flow system. (a) Exocytosis rate measured as gold concentration (ng/mL) in the collected cell culture media at different time intervals. (b) The percentage of the NPs measured in the collected media comparing to the total uptake amount of each NP during the 6-h period. (c) Accumulated exocytosis amount of AuNPs (ng) measured during the 6-h period.
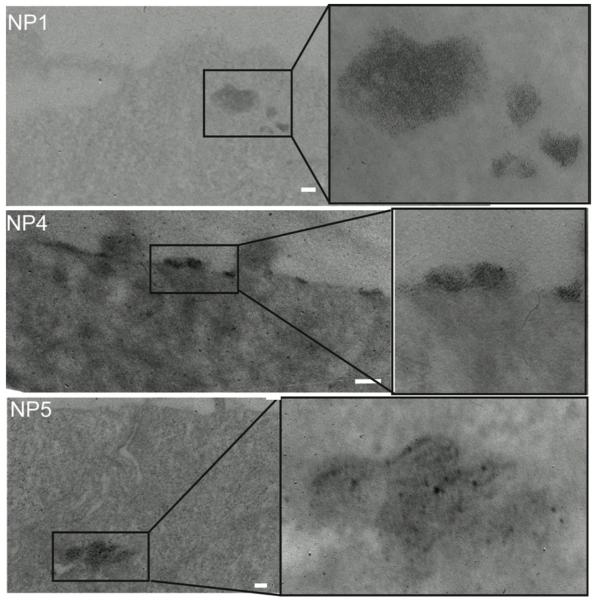
Cellular TEM was used to clarify the fate of AuNPs from the closed and flow systems to better understand the exocytosis process (Figure 3). The cellular TEM images in Figure 3 indicate the existence and aggregation of NPs in endocytotic vesicles after 6 h incubation. Interestingly, the TEM image of NP 4 (the most hydrophobic NP) illustrates that these endocytosed NPs remain in vesicles close to the cellular membrane, while endocytosed NPs 1 and 5 are further from the cellular membrane (Figure 3). It is also worth mentioning that NP 5 is observed by TEM less frequently in the cell than NP 1 and NP 4, which is consistent with the higher exocytosis amount of this NP (Figure 2a and c).
Figure 3.
Cellular TEM images for NP 1, NP 4, and NP 5. Images were taken 6 h after the incubation of NPs and cells and indicate the intracellular behaviors of these NPs after the 6-h exocytosis period in the flow systems. Scale bar, 100 nm.
In summary, we have quantified the exocytosis behavior of NPs with different surface functionalities in both closed and flow systems. These studies indicate that the hydrophobicity does not dramatically affect the exocytosis rate of NPs. We have shown, however, that the surface functionality (e.g., aromatic structure) plays a role in the exocytosis rate of NPs. These findings should lead to better designs for NPs as nano-carriers by enabling more rationale control of the exocytosis process. A deeper understanding of the surface functionality-dependent exocytosis rate of nano-carriers could be employed and tuned for effective payload delivery, enhancing the therapeutic effect of nanomedicines in the future.
Experimental Section
Cell culture
MCF-7 cells (20k/well) were cultured in 24 well plates for 24 h before the exocytosis experiment. The cells were then washed with PBS buffer and incubated with 0.5 mL of 200 nM AuNPs with different functionalities for 3 h. After the 3-h incubation, the cells were washed 3 times with PBS buffer and then the fresh cell culture media without AuNPs was added. The cells were then incubated in the flow system for the measurement of the exocytosis amount of AuNPs.
Flow system design
C-flex tubes (1/32″ID, Cole Parmer) were connected to the lid of the 24 well plates; one tube delivered fresh media into the well, and another tube took the old media containing the AuNPs from the exocytosis into a collecting tube. The media containing the AuNPs were collected at intervals of 30 minutes, 1, 1.5, 3 and 6 h with a rate of 0.07 ml/min (see Figure S2 for the pump speed control). After 6 h, the pump was stopped and the remaining media in the wells was collected. After the collection of media, the cells were washed 3 times with PBS. Then, 200 μL of NP-40 cell lysis buffer was added to each well. All collected cell culture media and lysed cell samples were then further analyzed by the ICP-MS to determine the amount of AuNPs.
Sample preparations and gold quantification by the inductively coupled plasma mass spectrometry (ICP-MS)
After collecting the media from AuNPs contained cells, 0.5 mL of fresh aqua regia (HCl:HNO3 in 3:1 ratio by volume) was added to every media samples to digest the AuNPs for 30 min. All the digested samples were diluted by deionized (DI) water to a final volume of 10 mL. The weight of the original and the diluted solutions were measured.
For the cell samples, 0.5 mL of fresh aqua regia was added to the cell lysate and kept for 30 min. DI water was added into the samples to dilute them to 10 mL. The gold standard solutions (0 ppb, 0.2 ppb, 0.5 ppb, 1 ppb, 2 ppb, 5 ppb, 10 ppb, and 20 ppb) were used for the quantification. Both the standard solutions and the samples solutions were measured by a Perkin-Elmer NexION 300X ICP mass spectrometer.
Cell TEM
The cellular TEM images were obtained using a JEOL 100S electron microscope, and the samples were prepared according to the previous report.[11] Briefly, MCF-7 cells were seeded and incubated on 15-mm-diameter Theramanox coverslips (Nalge Nunc International), and placed in 24-well plates (100,000 cells per well) with 1 ml of serum containing media for 24 h before the experiment. The media was replaced by NPs in serum containing media and incubated for 3 h. The media was exchanged with new media, and the MCF7 cells were washed three times with PBS buffer. The cells were then fixed in 2 % glutaraldehyde with 3.75% sucrose in 0.1 M sodium phosphate buffer (pH 7.0) for 30 min and washed with 0.1 M PBS containing 3.75% sucrose, three times over 30 min. The fixed cells were postfixed in 1% osmium tetroxide with 5% sucrose in 0.05 M sodium phosphate buffer solution (pH 7.0) for 1 hour and then washed with DI water three times. They were dehydrated in a graded series of acetone (10% steps) and embedded in epoxy resin. The resin was polymerized at 70 °C for 12 h. Ultrathin sections (70 nm) were obtained with a Reichert Ultracut E Ultramicrotome then imaged under a JEOL 100S electron microscope.
Supplementary Material
Acknowledgements
N. D. B. L. and Y. X. contributed equally to this work. This research was supported by the NIH (EB014277).
Footnotes
Supporting Information is available from the Wiley Online Library or from the author.
References
- [1].a) Nel A, Xia T, Madler L, Li N. Science. 2006;311:622. doi: 10.1126/science.1114397. [DOI] [PubMed] [Google Scholar]; b) Chithrani DB. Mol. Membr. Biol. 2010;27:299. doi: 10.3109/09687688.2010.507787. [DOI] [PubMed] [Google Scholar]; c) Teeguarden JG, Hinderliter PM, Orr G, Thrall BD, Pounds JG. Toxicol. Sci. 2007;95:300. doi: 10.1093/toxsci/kfl165. [DOI] [PubMed] [Google Scholar]; d) Cho EC, Zhang Y, Cai X, Moran CM, Wang LV, Xia Y. Angew. Chem. Int. Ed. Engl. 2012;125:1190. [Google Scholar]; e) Lison D, Thomassen LC, Rabolli V, Gonzalez L, Napierska D, Seo JW, Kirsch-Volders M, Hoet P, Kirschhock CE, Martens JA. Toxicol. Sci. 2008;104:155. doi: 10.1093/toxsci/kfn072. [DOI] [PubMed] [Google Scholar]
- [2].Jin H, Heller DA, Strano MS. Nano Lett. 2008;8:1577. doi: 10.1021/nl072969s. [DOI] [PubMed] [Google Scholar]
- [3].Wang Y, Wu Q, Sui K, Chen XX, Fang J, Hu X, Wu M, Liu Y. Nanoscale. 2013;5:4737. doi: 10.1039/c3nr00796k. [DOI] [PubMed] [Google Scholar]
- [4].Chithrani BD, Chan WC. Nano Lett. 2007;7:1542. doi: 10.1021/nl070363y. [DOI] [PubMed] [Google Scholar]
- [5].Yanes RE, Tarn D, Hwang AA, Ferris DP, Sherman SP, Thomas CR, Lu J, Pyle AD, Zink JI, Tamanoi F. Small. 2013;9:697. doi: 10.1002/smll.201201811. [DOI] [PMC free article] [PubMed] [Google Scholar]
- [6].a) Kanaras AG, Kamounah FS, Schaumburg K, Kiely CJ, Brust M. Chem Commun. 2002:2294. doi: 10.1039/b207838b. [DOI] [PubMed] [Google Scholar]; b) Brust M, Walker M, Bethell D, Schiffrin DJ, Whyman R. J. Chem. Soc. Chem. Commun. 1994:801. [Google Scholar]
- [7].Templeton AC, Wuelfing WP, Murray RW. Acc. Chem. Res. 2000;33:27. doi: 10.1021/ar9602664. [DOI] [PubMed] [Google Scholar]
- [8].Chompoosor A, Saha K, Ghosh PS, Macarthy DJ, Miranda OR, Zhu ZJ, Arcaro KF, Rotello VM. Small. 2010;6:2246. doi: 10.1002/smll.201000463. [DOI] [PMC free article] [PubMed] [Google Scholar]
- [9].Elliott NT, Yuan F. J. Pharm. Sci. 2011;100:59. doi: 10.1002/jps.22257. [DOI] [PubMed] [Google Scholar]
- [10].Moyano DF, Goldsmith M, Solfiell DJ, Landesman-Milo D, Miranda OR, Peer D, Rotello VM. J. Am. Chem. Soc. 2012;134:3965. doi: 10.1021/ja2108905. [DOI] [PMC free article] [PubMed] [Google Scholar]
- [11].Kim C, Agasti SS, Zhu Z-J, Isaacs L, Rotello VM. Nat. Chem. 2010;2:962. doi: 10.1038/nchem.858. [DOI] [PMC free article] [PubMed] [Google Scholar]
Associated Data
This section collects any data citations, data availability statements, or supplementary materials included in this article.


