Abstract
Background
Metabolic syndrome is now an epidemic in the US population. Intimal hyperplasia remains the principal lesion in the development of restenosis after vessel wall injury. The aim of this study is to characterize the changes induced in wall morphology in the developing intimal hyperplasia within a murine model in the presence of diabetes (type 1) and metabolic syndrome.
Methods
Control (wild-type B6), Diabetic Type 1 (NOD) and Metabolic Syndrome (RCS-10) mice were used. The murine femoral wire injury model was employed in which a micro wire is passed through a branch of the femoral and used to denude the common femoral and iliac arteries. Specimens were perfusion-fixed and sections were stained with H&E and Movat’s stains such that dimensional and compositional morphometry could be performed using an ImagePro system. Additional stains for proliferation and apoptosis were employed.
Results
In control mice, the injured femoral arteries develop intimal hyperplasia, which is maximal at 28 days and remains stable to day 56. Sham-operated vessels do not produce such a response. In diabetic mice, the intimal response increased 5-fold with a 2-fold increase in proteoglycan deposition, while in the metabolic syndrome mice there was a 6-fold increase in the intimal response and a similar increase in proteoglycan deposition. Collagen deposition was different, with a 22-fold increase over control in collagen deposition in diabetes and a 100-fold increase over control in collagen deposition in metabolic syndrome as compared to the control injury mice. Maximal vascular smooth muscle cell (VSMC) proliferation was decreased in both diabetes and metabolic syndrome compared to controls, while early cell apoptosis in both diabetes and metabolic syndrome was sustained over a longer period of time compared to wild-type mice.
Conclusions
These data demonstrate that development of intimal hyperplasia is markedly different in diabetes and metabolic syndrome compared to controls, with an increase in collagen deposition, a reduction in VSMC proliferation and an increase in early VSMC apoptosis. These findings suggest that preventative strategies against restenosis must be tailored for the diabetic and metabolic syndrome patients.
Keywords: vascular smooth muscle, response to injury, metabolic syndrome
INTRODUCTION
Diabetes and metabolic syndrome are considered the disease of the 21st Century. Metabolic syndrome is a pre-diabetic state, which is a constellation of well-defined metabolic risk factors: insulin resistance, atherogenic dyslipidemia, central abdominal obesity, hypertension and development of vascular pro-thrombotic and pro-inflammatory states (1, 2). It is characterized by high plasma levels of free fatty acids in association with high blood glucose levels. These patients present frequently for revascularization due to atherosclerotic occlusive disease (2). The presence of metabolic syndrome can be correlated with increased carotid intima-media thickness in both men (3) and women (4). Metabolic syndrome has also been demonstrated to amplify vascular wall thickness and stiffness (5). Diabetes and insulin resistance have been shown to be independent predictors of early restenosis after coronary stenting (6-9). After controlling for age, sex, previous myocardial infarction, stent length, current smoking, and statin therapy in a population of patients from the GENetic DEterminants of Restenosis (GENDER) study, metabolic syndrome was also associated with a greater target vessel revascularization (TVR) and the combined endpoint of death, myocardial infarction, and target vessel revascularization after percutaneous coronary intervention (10). We recently reported our results with lower extremity intervention in both diabetes and metabolic syndrome and demonstrated poorer anatomic outcomes in the presence of either diabetes or metabolic syndrome (12-15). Animals models of diabetes and metabolic syndrome show changes consistent with an exaggerated intimal hyperplasia response (11). Given these clinical findings, this study is designed to test the hypothesis that both diabetes and metabolic syndrome enhanced intimal hyperplasia through different cellular means. To test this hypothesis we employed the murine femoral wire injury model and examined the changes in vessel morphology and cell kinetics under normal, diabetic and metabolic syndrome conditions.
MATERIALS AND METHODS
Experimental Design
Control (wildtype, B6), diabetic (NOD) and metabolic syndrome (RCS-10) mice were used. The murine femoral wire injury model was employed in which a micro wire is passed through a branch of the femoral and used to denude the common femoral artery. Specimens were perfusion-fixed and sections were stained with Hematoxylin/Eosin (H&E) and Movat’s stains such that morphometry could be performed using an ImagePro system. Animal care and procedures were conducted at Houston Methodist Research Institute in accordance with state and federal laws and under protocols approved by the Houston Methodist Research Institute Animal Care and Use Committee. Animal care complied with the “Guide for the Care and Use of Laboratory Animals” issued by the Institute of Laboratory Animal Resources.
Mouse Strains
Control wild-type mouse: Mice with a C57BL/6J background served as the primary mouse in our control group. NOD mouse: Diabetes in NOD/LtJ mice is characterized by insulitis, a leukocytic infiltrate of the pancreatic islets. Marked decreases in pancreatic insulin content occur in females at about 12 weeks of age and several weeks later in males. Onset of diabetes is marked by moderate glycosuria and by a non-fasting plasma glucose higher than 250 mg/dL. Diabetic mice are hypoinsulinemic and hyperglucagonemic, indicating a selective destruction of pancreatic islet beta cells. NOD/LtJ females are more widely used than males because the onset of IDDM symptoms occurs earlier and with a higher incidence (90-100% by 30 weeks of age). NOD/LtJ males develop IDDM at a frequency of between 40-60% by 30-40 weeks of age.
RCS-10 mouse: In the NONcNZO10/LtJ mouse, the onset of hyperglycemia occurs between 12-16 weeks on a 6% fat diet, with greater than 85% being diabetic by 24 weeks. Males exhibit increased serum triglycerides, moderate to severe liver steatosis and pancreatic islet atrophy similar to NZO/HlLt males. Serum insulin and leptin values are significantly lower than in NZO/HlLt, and are only moderately elevated above those recorded in NON/Lt males.
Blood glucose and lipid level measurement
All mice were monitored weekly for the development of diabetes by blood glucose measurement with blood glucose monitoring system Fast Draw® test strips (J&J LifeScan, U.S.A.). Two consecutive non-fasting glucose measurements >200 mg/dL constituted a diagnosis of diabetes. All mice were monitored twice monthly for high lipid levels by blood lipid level measurement with Cardiochek P.A. analyzer Cardiochek Cholesterol Test Strips (Polymer Technology Systems, U.S.A.). Total cholesterol, high density lipoprotein (HDL) cholesterol, low density lipoprotein (LDL) cholesterol and triglyceride levels were measured. Non-fasting total cholesterol measurements >200 mg/dL, LDL >150 mg/dL or triglyceride levels >200mg/dL are consider higher than normal range.
Femoral wire injury
Endoluminal injury to the common femoral artery was produced by 3 passages of a 0.25-mm-diameter angioplasty guidewire (Advanced Cardiovascular Systems) as previously described (16, 17). Control sham-operated arteries underwent dissection, temporary clamping, arteriotomy, and ligature, without passage of the wire. Non-operated normal femoral arteries were used as additional controls. The vessels were harvested for morphometry and histology.
Morphometry
Following perfusion fixation, each vessel was bisected and central segments from each of these halves were embedded in paraffin and cross sections were cut (10 sections, 100 μm apart). Standard morphometric measurements were performed on histological cross sections stained with H&E and Movat’s stains using SPOT camera system (Diagnostic Instruments, Inc., Sterling Heights, MI). The luminal, intimal and medial areas of each vessel are determined using an ImagePro system (Media Cybernetics, Inc., Rockville, MD). Following determination of dimensions of each vessel, a ratio of the intimal and medial areas (I/M ratio) was calculated.
Determination of Extracellular Matrix (ECM) components
Slides stained with modified Movat’s stain were analyzed using an ImagePro system. The stain shows proteoglycans as blue, collagens as yellow, nuclei as black, muscle as red, fibrin as bright red and elastic fibers as dark purple. The area occupied by each component in a cross section was determined and expressed as a percent of the cross-sectional area.
Determination of in vivo proliferation and apoptosis
Labeling of proliferating VSMC in specimens was performed using the thymidine analogue 5-bromo-2′-deoxyuridine (BrdU; Sigma-Aldrich, St Louis MO; administered by Intraperitoneal injection 24 hours prior to sacrifice, 60 μg/g body weight). The number of BrdU-stained VSMC nuclei was counted and the BrdU labeling index (% of unlabeled cells) calculated on 10 slides (100 μm apart). Labeling of apoptotic VSMC on adjacent sections from each vessel specimens were evaluated using caspase 3 (Cell Signal, Danvers, MA) after processing the tissue according to the manufacturer’s guidelines on 10 slides (100 μm apart). Stained VSMC nuclei were counted and the caspase 3 labeling index (% of unlabeled cells) was calculated.
Data and Statistical Analysis
All data are presented as the mean ± standard error of the mean (s.e.m.) of six observations and statistical differences between groups were tested with a Kruskal-Wallis non-parametric test with post hoc Dunn’s multiple comparison correction, where appropriate. A p-value less than 0.05 was regarded as significant. Non-significant p-values were expressed as p=ns.
RESULTS
Blood sugar and lipids levels
Control wild-type animals had normal levels of glucose and cholesterol and triglycerides. Diabetic mice (NOD) had high levels of glucose and triglycerides; cholesterol was normal. Metabolic syndrome animals (RCS10) had high levels of glucose, cholesterol and triglycerides (Table 1).
Table 1.
| Blood Sugar (mg/dl) |
Cholesterol (mg/dl) |
Triglycerides (mg/dl) |
|
|---|---|---|---|
| Wildtype | 145±20 | 109±18 | 75±23 |
| RCS10 | 382±40** | 226±50* | 448±71** |
| NOD | 343±56** | 130±30 | 316±34 ** |
p<0.05
p<0.01 compared to wildtype
Wall morphology
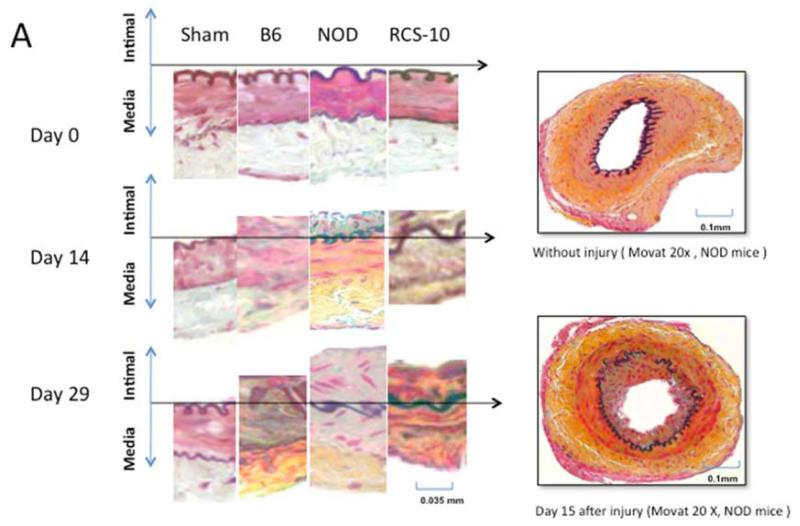
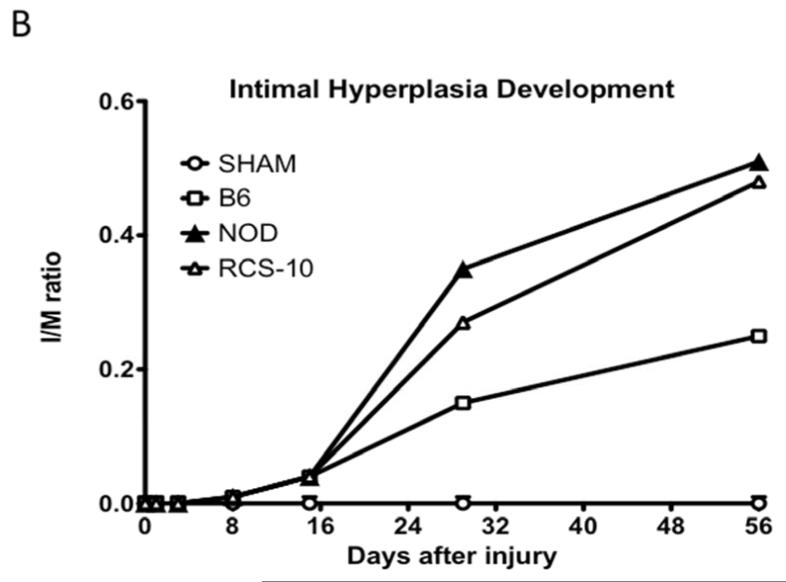
In normal B6 wild-type mice, the injured femoral arteries develop intimal hyperplasia, which is maximal at 28 days and does not change substantially between day 28 and day 56. Sham operated on vessels did not produce such a response. In diabetic mice, the intimal response increased 5-fold, while in the metabolic syndrome mice there was a 6-fold increase in the intimal response (Fig 1).
Figure 1.
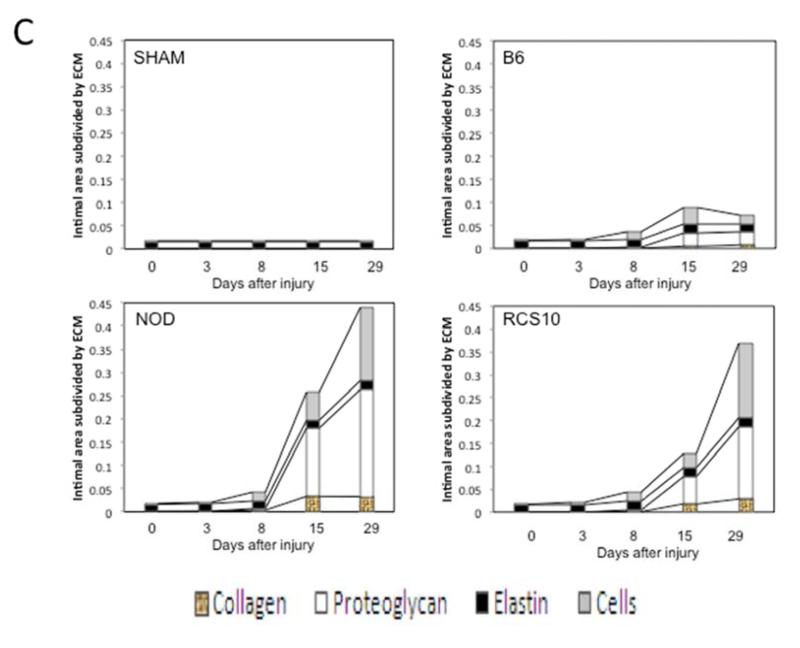
Changes in the intimal hyperplasia response in wire-injured femoral vessels in sham operated (sham), control B6, diabetic (NOD) and metabolic syndrome (RCS-10) groups. (A) shows histological cross sections of the vessel wall stained with Movat’s stain in the left panel and representative full cross-sections of the vessel in the right panel. The stain shows proteoglycans as blue, collagens as yellow, nuclei as black, muscle as red, fibrin as bright red and elastic fibers as dark purple. (B) shows the changes in Intima / Media ratio over the time course of the experiment. Values are the mean± s.e.m. (n=6 per group). (C) shows the comparison of the area of cells, collagen, proteoglycan and elastin in wire-injured femoral vessels in sham, B6, diabetic (NOD) and metabolic syndrome (RCS-10) groups. Values are the mean± s.e.m. (n=6 per group). Statistical differences between groups were tested with a Kruskal-Wallis non-parametric test with post hoc Dunn’s multiple comparison correction, where appropriate.
Extracellular matrix
In normal wild-type mice, the intimal hyperplasia was composed of proteoglycans, collagen and cells. In diabetic mice, associated with the increase in the intimal hyperplasia, there was 2-fold increase in proteoglycan deposition. Collagen deposition in diabetic mice was 22-fold greater than that seen in control animals. In the animals with metabolic syndrome there was a similar 2-fold increase in proteoglycan deposition but a 100-fold increase in collagen depositions compared to the control wild-type injury mice (Fig 1).
Cell kinetics
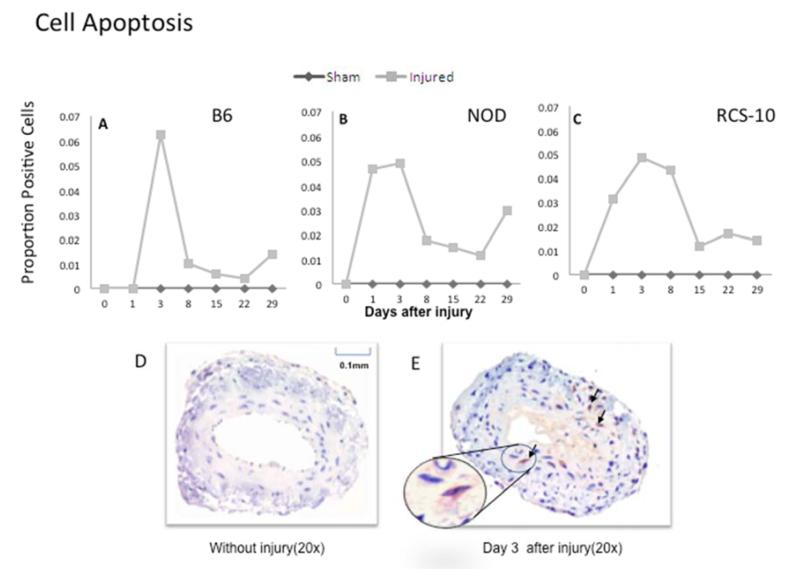
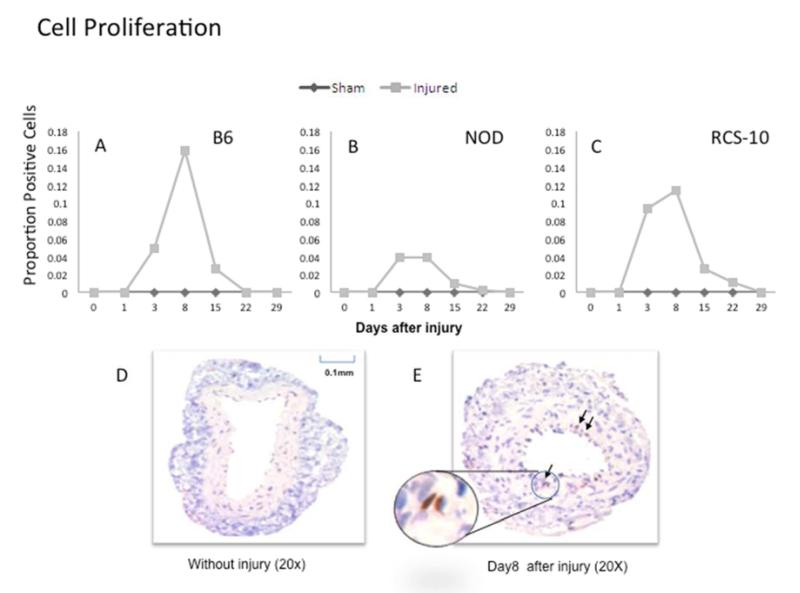
In normal B6 mice, cell apoptosis peaked early within 3 days and cell proliferation peaked at 3-5 days. Maximal cell proliferation was decreased in both diabetes and metabolic syndrome compared to control wild type mice while early cell apoptosis was sustained over a longer period of time over wild type mice in both diabetes and metabolic syndrome (Fig 2).
Figure 2.
Changes in cell apoptosis in wire-injured femoral vessels from the control B6 (A), diabetic (NOD) (B) and metabolic syndrome (RCS-10) (C) groups. Labeling of apoptotic VSMC on adjacent sections from each vessel specimen are evaluated using caspase 3. Values are the mean± s.e.m. proportion of positive cells (n=6 per group). D and E show representational cross-sections of the uninjured vessel in the left panel (D) and an injured vessel in the right panel (E) which also has an inlay demonstrating a positively stained cell. Statistical differences between groups were tested with a Kruskal-Wallis non-parametric test with post hoc Dunn’s multiple comparison correction, where appropriate.
Inflammatory Infiltrate
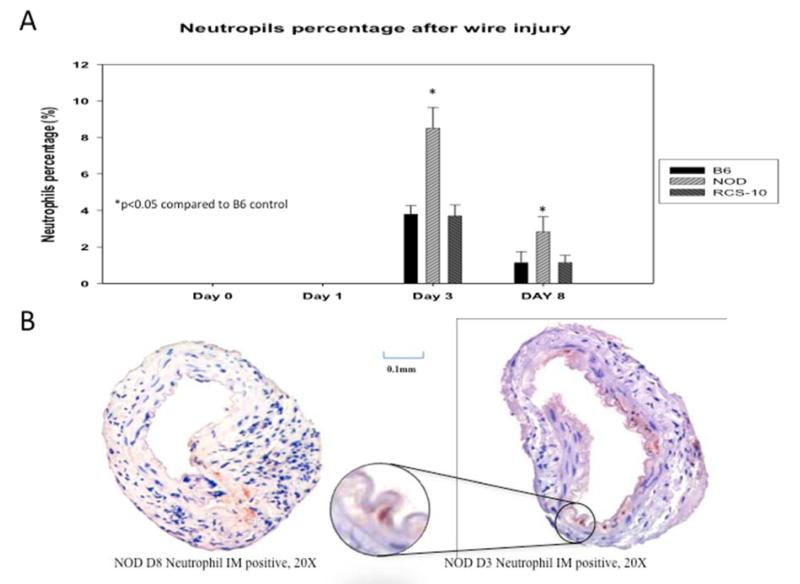
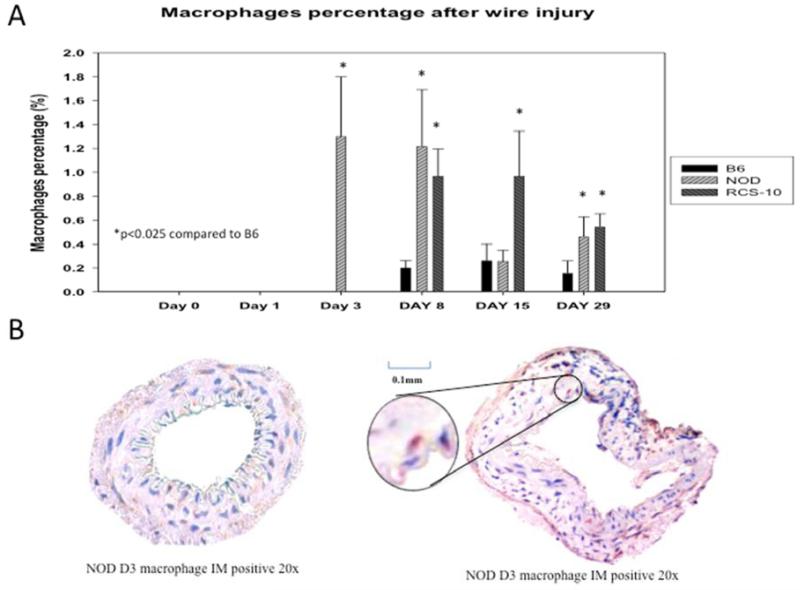
Both neutrophils and macrophages were seen within the vessel wall in the control wild-type animals, with neutrophils peaking at day 3 and macrophages from day 8 to day 29. In diabetic mice, the neutrophil peak was greater but occurred at the same day 3 time point, while in metabolic syndrome the pattern was similar to that of control wild-type mice. The peak neutrophil infiltration in diabetic animals was 2.5-fold over control and metabolic syndrome. In the animals with metabolic syndrome, macrophage infiltration occurred much earlier than in control wild-type mice, beginning at day 3 and continuing until day 15. In comparison, diabetic mice showed an enhanced macrophage infiltration, which was sustained until day 29. The peak macrophage infiltration in metabolic syndrome was 3.3-fold greater than control wild-type mice while macrophage infiltration in diabetic animals was 2.5-fold over control wild-type mice (Fig 3).
Figure 3.
Changes in cell proliferation in wire-injured femoral vessels from the control B6 (A), diabetic (NOD) (B) and metabolic syndrome (RCS-10) (C) groups. Labeling of proliferating VSMC in specimens is performed using the thymidine analogue 5-bromo-2′-deoxyuridine (BrdU). Values are the mean± s.e.m. proportion of positive cells (n=6 per group). D and E show representational cross-sections of the uninjured vessel in the left panel (D) and an injured vessel in the right panel (E) which also has an inlay demonstrating a positively stained cell. Statistical differences between groups were tested with a Kruskal-Wallis non-parametric test with post hoc Dunn’s multiple comparison correction, where appropriate.
DISCUSSION
We had previously demonstrated that under normal circumstances, murine injured femoral arteries developed intimal hyperplasia, which is maximal at 28 days and does not change substantially between day 28 and day 56 (18, 19). Sham operated vessels did not produce such a response (18, 19). Cell apoptosis peaked within 3 days and cell proliferation peaked at 7 days after injury. In contrast, this study has demonstrated that there are substantial changes in the development and the composition of intimal hyperplasia after arterial injury in mice with diabetes and metabolic syndrome. The contribution of acute and chronic inflammation and of connective tissue is enhanced.
In vitro, diabetes appears to enhance vascular smooth muscle cell proliferation and migration through alterations in proteases, integrins, glycoproteins and formation of Advanced Glycation Endproducts (AGEs) (20, 21). In vivo, elevated blood glucose levels have been shown to induce a series of alterations within the vasculature including endothelial dysfunction, cellular proliferation, changes in extracellular matrix conformation and impairment of LDL receptor-mediated uptake decreasing the in vivo clearance of LDL concentrations (22-26). Multiple animal studies of intimal hyperplasia formation induced by balloon-denuding injury in diabetic animal models have demonstrated conflicting data as to the roles of hyperglycemia and hyperinsulinemia (27-32). True diabetic models must be also differentiated by type 1 - lack of insulin - and type 2 - insulin resistance. Studies in type 1 diabetic models (Alloxan-induced diabetic rabbit (33) and BB Wistar diabetic rat (34)) have demonstrated increased intimal thickening after balloon injury compared with non-diabetic animals. Streptozotocin-induced type 1 diabetic Sprague-Dawley rats subjected to aortic stenting developed thicker intimal hyperplasia with decreased lumen area 14 days after stenting compared with controls. (31). In contrast, Park et al. have shown that there was no difference in neointimal area in the streptozotocin (STZ)-treated rats compared with controls, irrespective of insulin administration or dose of STZ (28). The majority of the studies have not used mice as their animal model.
This study in NOD mice, which lack insulin, has demonstrated that compared to non-diabetic wild-type mice, the intimal response after arterial injury in type 1 diabetes is increased 5-fold. In the diabetic NOD mice, the enhanced intimal hyperplastic response was associated with a 2-fold increase in proteoglycan deposition but with a decrease in VSMC proliferation. Apoptosis was sustained for a longer period of time. This produced a relatively acellular intimal hyperplastic response. Moreover, compared to wild-type controls, there was a 22-fold increase in collagen deposition in diabetes and a 100-fold increase in collagen deposition. Persistently elevated serum glucose has been shown to induce an increase in selected matrix gene transcription that persists for weeks after restoration of euglycemia in vivo (35). This results in an increased synthesis of extracellular matrix components such as collagen type IV, fibronectin and laminin. Abnormalities in the synthesis and metabolism of heparan sulfate have also been reported in association with both experimental and human diabetes (36-38). (20, 21)(22-26)(39, 40)
Metabolic syndrome is characterized by hyperinsulinemia due to insulin resistance at the cellular level, high glucose levels, a pro-inflammatory and a prothrombotic state (41). In this study, the intimal response after arterial injury of mice with metabolic syndrome was increased 6-fold over similar wild-type mice but had an increase in proteoglycan deposition equivalent to that seen in the diabetic mice and a lower cell proliferation response to that observed in wild-type mice. Haudenschild et al. reported that following arterial injury there was increased aortic intimal thickening observed in the obese Zucker type 2 diabetic rats compared with the low-dose STZ-treated, insulin-treated Wistar diabetic rats (42). In a report by Park et al. (28), intimal hyperplasia development at 21 days following carotid balloon injury was increased 2-fold in obese Zucker rats (a metabolic syndrome model) compared with lean Zucker rats. In both obese and lean Zucker rats, cell proliferation peaked in the media at 3 days (28). In obese Zucker rats, carotid artery balloon injury was associated with increased intimal thickness and increased VSMC proliferation (43). (43) Furthermore, increased intimal hyperplasia correlated with increased reactive oxygen species (ROS) production, as demonstrated by dihydroethidium staining (39). This study did not demonstrate enhanced cell proliferation in metabolic syndrome. It did show increased cell apoptosis and chronic inflammation, which would be consistent with a heightened pro-inflammatory state. This study confirms for the first time that in metabolic syndrome there is increased intimal hyperplasia and that this is the result of deposition of extracellular matrix with a predominantly collagen, rather than proteoglycan, composition.
Inflammation in the diabetic mice was characterized by an early intense neutrophil response. Diabetic mice also showed an enhanced macrophage infiltration into the wall, which was sustained until day 29. The macrophage response in the wild-type mice was not as intense and subsided around day 15. The pattern of the acute inflammatory infiltrate in the mice with metabolic syndrome was also similar to that of control wild-type mice and much less than the diabetic mice. In contrast, however, the mice with metabolic syndrome demonstrated an earlier and enhanced macrophage infiltration into the wall, which subsided around day 15. In obese Zucker rats, carotid artery balloon injury was associated with increased adhesion molecule expression and inflammatory cell infiltration, compared to controls (43).
Conclusions
These data demonstrate that development of intimal hyperplasia is markedly different in diabetes and metabolic syndrome compared to controls, with an increase in collagen deposition, a reduction in VSMC proliferation and an increase in early VSMC apoptosis. This data would suggest that these lesions are not very amenable to anti-proliferative interventions in the immediate post-injury period and that in later periods the greater composition of extracellular matrix will need alternative strategies to interrupt the wound healing response. These findings would also suggest that preventative strategies against restenosis must be tailored for the diabetic and metabolic syndrome patients.
Figure 4.
Comparison of the neutrophil responses seen in wire-injured femoral vessels from the control B6, diabetic (NOD) and metabolic syndrome (RCS-10) groups (A). Values are the mean± s.e.m. % positive cells (n=6 per group). (B) shows representational cross-sections of the vessels with the right panel having an inlay demonstrating a positively stained cell. Statistical differences between groups were tested with a Kruskal-Wallis non-parametric test with post hoc Dunn’s multiple comparison correction, where appropriate.
Figure 5.
Comparison of the macrophage responses seen in wire-injured femoral vessels from the control B6, diabetic (NOD) and metabolic syndrome (RCS-10) groups (A). Values are the mean± s.e.m. % positive cells (n=6 per group). (B) shows representational cross-sections of the vessels with the right panel having an inlay demonstrating a positively stained cell. Statistical differences between groups were tested with a Kruskal-Wallis non-parametric test with post hoc Dunn’s multiple comparison correction, where appropriate.
ACKNOWLEDGEMENTS
The authors thank Daynene Vykoukal, Ph.D. for critical reading of the manuscript.
Supported by U.S. Public Health Service HL086968 and HL67746
Footnotes
Presentation: Presented at the 6th Academic Surgical Congress, Huntington Beach CA, Feb 2011.
Contribution Statements
By submitting this manuscript, each author certifies that they have made a direct and substantial contribution to the work reported in the manuscript by participating in each of the following three areas: (1) conceiving and designing the study; or collecting the data; or analyzing and interpreting the data; (2) writing the manuscript or providing critical revisions that are important for the intellectual content; and (3) approving the final version of the manuscript. In the table below, we have listed all of the authors and use an “X” to indicate all of the substantive contribution(s) of each author. For more information, see the “Uniform Requirements for Manuscripts Submitted to Biomedical Journals: Writing and Editing for Biomedical Publication” (http://www.icmje.org/index.html), section II.A on Authorship.
| Author Name | Conception and design |
Analysis and interpretation |
Data Collection | Writing the article | Critical revision of the article |
Final approval of the article |
Statistical analysis |
Obtaining funding | Overall Responsibility |
|---|---|---|---|---|---|---|---|---|---|
| Enrico A. Duru | x | x | x | x | x | x | X | ||
| Yuyang Fu | x | x | x | x | x | x | x | ||
| Mark G. Davies | x | x | x | x | x | x | x | x | X |
Publisher's Disclaimer: This is a PDF file of an unedited manuscript that has been accepted for publication. As a service to our customers we are providing this early version of the manuscript. The manuscript will undergo copyediting, typesetting, and review of the resulting proof before it is published in its final citable form. Please note that during the production process errors may be discovered which could affect the content, and all legal disclaimers that apply to the journal pertain.
Disclosure Statement
| Author Name | |
|---|---|
| Enrico A. Duru | Nothing to disclose |
| Yuyang Fu | Nothing to disclose |
| Mark G. Davies | Nothing to disclose |
REFERENCES
- 1.Wyne KL. Free fatty acids and type 2 diabetes mellitus. Am J Med. 2003;115(Suppl 8 A):29S–36S. doi: 10.1016/j.amjmed.2003.09.004. [DOI] [PubMed] [Google Scholar]
- 2.Vykoukal D, Davies MG. The biology of metabolic syndrome. J Vasc Surg. 2011;54:819–31. doi: 10.1016/j.jvs.2011.01.003. [DOI] [PMC free article] [PubMed] [Google Scholar]
- 3.Wallenfeldt K, Hulthe J, Fagerberg B. The metabolic syndrome in middle-aged men according to different definitions and related changes in carotid artery intima-media thickness (IMT) during 3 years of follow-up. Journal of Internal Medicine. 2005;258:28–37. doi: 10.1111/j.1365-2796.2005.01511.x. [DOI] [PubMed] [Google Scholar]
- 4.Iannuzzi A, De Michele M, Bond MG, Sacchetti L, Fortunato G, Salvatore F, et al. Carotid Artery Remodeling in Middle-Aged Women With the Metabolic Syndrome (from the “Progetto ATENA” Study) Am J Cardiol. 2005;96:1162–65. doi: 10.1016/j.amjcard.2005.06.048. [DOI] [PubMed] [Google Scholar]
- 5.Scuteri A, Najjar SS, Muller DC, Andres R, Hougaku H, Metter EJ, et al. Metabolic Syndrome Amplifies the Age-Associated Increases in Vascular Thickness and Stiffness. JACC. 2004;43(8):1388–95. doi: 10.1016/j.jacc.2003.10.061. [DOI] [PubMed] [Google Scholar]
- 6.Cutlip DE, Chauhan MS, Baim DS, Ho KK, Popma JJ, Carrozza JP, et al. Clinical restenosis after coronary stenting: perspectives from multi-center clinical trials. J Am Coll Cardiol. 2002;40:2082–9. doi: 10.1016/s0735-1097(02)02597-4. [DOI] [PubMed] [Google Scholar]
- 7.Pache J, Kastrati A, Mehilli J, Schuhlen H, Dotzer F, Hausleiter J, et al. Intracoronary stenting and angiographic results: strut thickness effct on restenosis outcome (ISAR-STEREO-2) trial. J Am Coll Cardiol. 2003;41:1283–8. doi: 10.1016/s0735-1097(03)00119-0. [DOI] [PubMed] [Google Scholar]
- 8.Gilbert J, Raboud J, Zinman B. Meta-analysis of he effect of diabetes on restenosis rates among patients receiving coronary angioplasty stenting. Daibetes Care. 2004;27:990–4. doi: 10.2337/diacare.27.4.990. [DOI] [PubMed] [Google Scholar]
- 9.Piatti P, DiMario C, Monti LD, Fragasso G, Sgura F, Caumo A, et al. Association of insulin resistance, hyperlipidemia and imparied nitric oxide release with instent restenosis in patients undergoing coronary stenting. Circulation. 2003;108:2074–81. doi: 10.1161/01.CIR.0000095272.67948.17. [DOI] [PubMed] [Google Scholar]
- 10.Rana JS, Monraats PS, Zwinderman AH, de Maat MP, Kastelein JJ, Doevendans PA, et al. Metabolic syndrome and risk of restenosis in patients undergoing percutaneous coronary intervention. Diabetes Care. 2005;28(4):873–7. doi: 10.2337/diacare.28.4.873. [DOI] [PubMed] [Google Scholar]
- 11.McNamara DB, Murthy SN, Fonseca AN, Desouza CV, Kadowitz PJ, Fonseca VA. Animal models of catheter-induced intimal hyperplasia in type 1 and type 2 diabetes and the effects of pharmacologic intervention. Can J Physiol Pharmacol. 2009;87(1):37–50. doi: 10.1139/Y08-098. [DOI] [PubMed] [Google Scholar]
- 12.Bakken AM, Palchik E, Hart JP, Rhodes JM, Saad WE, Davies MG. Impact of diabetes on the outcomes of superficial femoral artery endoluminal interventions. J Vasc Surg. 2007;46:946–58. doi: 10.1016/j.jvs.2007.06.047. [DOI] [PubMed] [Google Scholar]
- 13.Protack CD, Bakken AM, Xu J, Saad WE, Lumsden AB, Davies MG. Metabolic Syndrome: a predictor of adverse events after Carotid Revascularization. J Vasc Surg. 2009;49:1172–80. doi: 10.1016/j.jvs.2008.12.011. [DOI] [PubMed] [Google Scholar]
- 14.Davies MG, Bismuth J, Saad WE, Naoum JJ, Peden EK, Lumsden AB. Impact of Metabolic Syndrome on the Outcomes of Percutaneous Renal Angioplasty and Stenting. J Vasc Surg. 2010;51:926–32. doi: 10.1016/j.jvs.2009.09.042. [DOI] [PubMed] [Google Scholar]
- 15.Smolock CJ, Anaya-Ayala JE, Bismuth J, Naoum JJ, El Sayed HF, Peden EK, et al. Impact of metabolic syndrome on the outcomes of superficial femoral artery interventions. J Vasc Surg. 2012;55(4):985–93.e1. doi: 10.1016/j.jvs.2011.10.109. [DOI] [PubMed] [Google Scholar]
- 16.Zou Y, Qi Y, Roztocil E, Nicholl SM, Davies MG. Patterns Of Kinase Activation Induced By Injury In The Murine Femoral Artery. J Surg Res. 2007;141(332-340.) doi: 10.1016/j.jss.2007.05.033. [DOI] [PMC free article] [PubMed] [Google Scholar]
- 17.Zou Y, Qi Y, Roztocil E, Nicholl SM, Lumsden AB, Davies MG. Patterns of gelatinase activation induced by injury in the murine femoral artery. J Surg Res. 2009;154(1):135–42. doi: 10.1016/j.jss.2008.05.025. [DOI] [PMC free article] [PubMed] [Google Scholar]
- 18.Zou Y, Fu Y, Davies MG. Gαq G proteins modulate MMP-9 gelatinase during remodeling of the murine femoral artery. J Surg Res. 2012 doi: 10.1016/j.jss.2012.04.038. in press. [DOI] [PMC free article] [PubMed] [Google Scholar]
- 19.Zou Y, Fu Y, Duru EA, Davies MG. Role for Gβγ G-proteins in protease regulation during remodeling of the murine femoral artery. J Surg Res. 2011;178(1):40–7. doi: 10.1016/j.jss.2011.08.006. [DOI] [PMC free article] [PubMed] [Google Scholar]
- 20.Panchatcharam M, Miriyala S, Yang F, Leitges M, Chrzanowska-Wodnicka M, Quilliam LA, et al. Enhanced proliferation and migration of vascular smooth muscle cells in response to vascular injury under hyperglycemic conditions is controlled by beta3 integrin signaling. Int J Biochem Cell Biol. 2010;42(6):965–74. doi: 10.1016/j.biocel.2010.02.009. [DOI] [PMC free article] [PubMed] [Google Scholar]
- 21.Liu Y, Liang C, Liu X, Liao B, Pan X, Ren Y, et al. AGEs increased migration and inflammatory responses of adventitial fibroblasts via RAGE, MAPK and NF-kappaB pathways. Atherosclerosis. 2010;208(1):34–42. doi: 10.1016/j.atherosclerosis.2009.06.007. [DOI] [PubMed] [Google Scholar]
- 22.Brownlee M, Cerami A, Vlassara H. Advanced Products of Non-enzymatic Glycosylation and the pathogenesis of diabetic vascular disease. Diabetes/Metabolism Reviews. 1988;4:437–51. doi: 10.1002/dmr.5610040503. [DOI] [PubMed] [Google Scholar]
- 23.Getz GS. Report on the workshop on diabetes and mechanisms of atherogenesis. Arterioscler Thromb. 1993;13:459–64. doi: 10.1161/01.atv.13.3.459. [DOI] [PubMed] [Google Scholar]
- 24.Agrawal DK, Bhimji S, McNeill JH. Effect of chronic experimental diabetes on vascular smooth muscle function in rabbit carotid artery. J Cardiovasc Pharmacol. 1987;9:584–93. doi: 10.1097/00005344-198705000-00013. [DOI] [PubMed] [Google Scholar]
- 25.MacLeod KM, McNeill JH. The influence of chronic experimental diabetes on contractile responses of rat isolated blood vessels. Can J Physiol Pharmacol. 1985;63:52–7. doi: 10.1139/y85-009. [DOI] [PubMed] [Google Scholar]
- 26.Koschinsky T, Bunting CE, Rutter R, Gries FAS. Vascular growth factors and the development of macrovascular disease in diabetes mellitus. Diabetes et Metabol. 1987;13:318–25. [PubMed] [Google Scholar]
- 27.Indolfi C, Torella D, Cavuto L, Davalli AM, Coppola C, Esposito G, et al. Effects of balloon injury on neointimal hyperplasia in streptozotocin-induced diabetes and in hyperinsulinemic nondiabetic pancreatic islet-transplanted rats. Circulation. 2001;103:2980–6. doi: 10.1161/01.cir.103.24.2980. [DOI] [PubMed] [Google Scholar]
- 28.Park SH, Marso SP, Zhou Z, Foroudi F, Topol EJ, Lincoff AM. Neointimal hyperplasia after arterial injury is increased in a rat model of non-insulin-dependent diabetes mellitus. Circulation. 2001;104:815–9. doi: 10.1161/hc3301.092789. [DOI] [PubMed] [Google Scholar]
- 29.Zhou Z, Wang K, Penn MS, Marso SP, Lauer MA, Forudi F, et al. Receptor for AGE (RAGE) mediates neointimal formation in response to arterial injury. Circulation. 2003;107:2238–43. doi: 10.1161/01.CIR.0000063577.32819.23. [DOI] [PubMed] [Google Scholar]
- 30.Molnar J, Yu S, Mzhavia N, Pau C, Chereshnev I, Dansky HM. Diabetes induces endothelial dysfunction but does not increase neointimal formation in high-fat diet fed C57BL/6J mice. Circ Res. 2005;96:1178–84. doi: 10.1161/01.RES.0000168634.74330.ed. [DOI] [PubMed] [Google Scholar]
- 31.Jonas M, Edelman ER, Groothuis A, Baker AB, Seifert P, Rogers C. Vascular Neointimal Formation and Signaling Pathway Activation in Response to Stent Injury in Insulin-Resistant and Diabetic Animals. Circ Res. 2005;97:725–33. doi: 10.1161/01.RES.0000183730.52908.C6. [DOI] [PubMed] [Google Scholar]
- 32.Kruger D. Neo-intimal hyperplasia, diabetes and endovascular injury. Cardiovasc J Afr. 2012;23(9):507–11. doi: 10.5830/CVJA-2012-019. [DOI] [PMC free article] [PubMed] [Google Scholar]
- 33.Kanzaki T, Shinomiya M, Ueda S, et al. Enhanced arterial intimal thickening after balloon catheter injury in diabetic animals accompanied by PDGF beta-receptor over expression of aortic media. Eur J Clin Invest. 1994;24:377–81. doi: 10.1111/j.1365-2362.1994.tb02179.x. [DOI] [PubMed] [Google Scholar]
- 34.Winocour PD, Hryhorenko L. Spontaneous diabetes in BB Wistar rats causes small increases in the early proliferative response of smooth muscle cells in re-injured aorta. Exp Mol Pathol. 1995;63:161–74. doi: 10.1006/exmp.1995.1040. [DOI] [PubMed] [Google Scholar]
- 35.Roy A, Sala R, Cagliero E, Lorcazi M. Over expression of fibronectin induced by diabetes or high glucose: phenomenon with a memory. Proc Natl Acad Sci USA. 1990;87:404–8. doi: 10.1073/pnas.87.1.404. [DOI] [PMC free article] [PubMed] [Google Scholar]
- 36.Ziyadeh FN. The extracellular matrix in diabetic nephropathy. Am J Kidney Dis. 1993;22:736–44. doi: 10.1016/s0272-6386(12)80440-9. [DOI] [PubMed] [Google Scholar]
- 37.Kanwer YS, Rosenzweig LJ, Linker A, Jakubowski ML. Decreased de novov sysnthesis of glomerular proteoglycan in diabetes. Proc Natl Acad Sci USA. 1983;80:2272–5. doi: 10.1073/pnas.80.8.2272. [DOI] [PMC free article] [PubMed] [Google Scholar]
- 38.Vernier RL, Steffes MW, Sisson-Ross S, Maner M. Heparan sulfate proteoglycan in the glomerular basement membrane in type 1 diabetes. Kidney Int. 1992;41:1070–80. doi: 10.1038/ki.1992.163. [DOI] [PubMed] [Google Scholar]
- 39.Ahanchi SS, Varu VN, Tsihlis ND, Martinez J, Pearce CG, Kapadia MR, et al. Heightened efficacy of nitric oxide-based therapies in type II diabetes mellitus and metabolic syndrome. Am J Physiol Heart Circ Physiol. 2008;295(6):H2388–98. doi: 10.1152/ajpheart.00185.2008. [DOI] [PMC free article] [PubMed] [Google Scholar]
- 40.Davies MG, Kim JH, Klyachkin ML, Dalen H, Svendsen E, Carson CC, et al. Diabetes mellitus and experimental vein graft morphology and function. J Vasc Surg. 1994;19:1031–43. doi: 10.1016/s0741-5214(94)70215-2. [DOI] [PubMed] [Google Scholar]
- 41.Vykoukal D, Davies MG. Metabolic Syndrome and Vascular Outcomes. In: Eskandari M, Morasch M, Pearce WH, Yao JST, editors. Vascular Surgery. Peoples Medical Publishing House-USA (PMPH-USA); Shelton CT: 2011. pp. 243–54. [Google Scholar]
- 42.Haudenschild CC, Van Sickle W, Chobanian AV. Response of the aorta of the obese Zucker rat to injury. Arteriosclerosis. 1981;1:186–91. doi: 10.1161/01.atv.1.3.186. [DOI] [PubMed] [Google Scholar]
- 43.Barbato JE, Zuckerbraun BS, Overhaus M, Raman KG, Tzeng E. Nitric oxide modulates vascular inflammation and intimal hyperplasia in insulin resistance and the metabolic syndrome. Am J Physiol Heart Circ Physiol. 2005;289(1):H228–36. doi: 10.1152/ajpheart.00982.2004. [DOI] [PubMed] [Google Scholar]


