

Abstract
Photoacoustic measurements of melanoma cells and red blood cells (RBCs) using ultra-high frequency (UHF) wide-bandwidth transducers are reported. In this detection system, the resolution typically depends on the parameters of the receiving transducer, and not the focus of the laser. A single melanoma cell was imaged with 200, 375 and 1200 MHz transducers. As the frequency increased, the resolution increased, resulting in greater detail observed. A single RBC was imaged at 1200 MHz, showing the contours of the cell. While lateral and axial resolutions approaching 1 μm are possible with this microscope, the key advantage is the ability to perform a wide-bandwidth quantitative signal analysis of the photoacoustic signals. The power spectrum of the signals measured from RBCs showed distinct spectral minima around 800 and 1500 MHz which are directly related to the RBC geometry. This study reports on the high-resolution imaging capabilities and quantitative analyses using UHF photoacoustic microscopy.
Keywords: Photoacoustic microscopy, Label-free imaging, Single cell imaging, Quantitative spectral analysis, Red blood cells
1. Introduction
Photoacoustic microscopy uses focused lasers with ultrasound transducers as receivers to create sub-micron resolution images of cells and tissue [1]. Typically high frequency transducers (20–100 MHz) are used which have native ultrasound resolutions greater than 20 μm [2]. To achieve micron-resolution photoacoustic imaging, a laser is focused to a small spot to ensure only a small region of the sample is illuminated and subsequently generates a photoacoustic wave. Several different photoacoustic microscope designs exist, in which the laser is positioned opposite the transducer [3–6], integrated into the transducer [7–9], beside the transducer [10–12] or other configurations [13–16]. In most cases, the lateral resolution is limited by the ability to focus the laser to a small spot, which in turn is directly related to the numerical aperture (NA) of the optical lens.
Various contrast agents such as dyes and nanoparticles can be used to create photoacoustic images of cells and tissue in vitro and in vivo [17,18]. Endogenous optically absorbing components of cells provide unique opportunities to image and analyze single cells using label-free methods [19]. Hemoglobin, contained in red blood cells (RBCs), strongly absorbs visible and near-infrared light in comparison to other chromophores in tissue. Melanin, the pigment responsible for coloring skin and hair, is present in melanocyte cells and absorbs strongly throughout the visible spectrum. DNA/RNA in the cell nucleus absorb UV light, and can also be used for photoacoustic imaging [9,20]. Using endogenous optical absorbers enables imaging of live cells without fixation or staining, which can alter the cellular microstructure [21].
Most photoacoustic microscopes use transducers with frequencies under 100 MHz and achieve micrometer resolution using objectives to focus the laser with moderately high NAs (up to 1.0) [22]. Resolutions near the diffraction limit of 200 nm have been achieved using a high-NA (1.23) water-immersion lens [5]. Using transducers with frequencies less than 100 MHz has some disadvantages in photoacoustic imaging. First, the laser spot is tightly focused in the lateral direction, but less so in the axial direction. In this case, the axial resolution is limited by the ultrasound transducer, and can be many times larger than the lateral resolution [23]. As the laser power is focused to a very small spot, unwanted bioeffects may be introduced [24]. Second, the transducer bandwidth is relatively narrow, limiting the potential for quantitative analyses of the photoacoustic signals. Third, micron-sized objects typically generate photoacoustic waves where a significant portion of the photoacoustic wave energy is over 100 MHz. Typically, spectral amplitude peaks of the photoacoustic wave generated from micron sized objects are above 100 MHz. Therefore, when using transducers less than 100 MHz a portion of the photoacoustic signal energy is not recorded, reducing the measurement SNR.
Our system is capable of both a qualitative and quantitative photoacoustic analysis using a focused laser with ultra-high frequency (UHF) transducers up to 1200 MHz. Lateral and axial resolutions up to 1 μm can be achieved, based on the transducer parameters [2]. The overall image resolution is a combination of the transducer resolution and the size of the laser spot; when the transducer resolution is smaller than the laser focus area, then the resolution primarily depends on the transducer resolution, and not the laser spot. Due to the wide bandwidth of these transducers (typically hundreds of MHz or more), a quantitative analysis of the power spectrum of the photoacoustic signal from single cells can be performed, giving information about the cell not obtainable through imaging methods alone. Moreover, photoacoustic can be integrated with ultrasound pulse-echo imaging to perform simultaneous photoacoustic and ultrasonic imaging in one pass with similar resolutions in each modality. This is not possible with lower frequency transducers (<60 MHz) used in photoacoustic microscopy, which have pulse-echo ultrasound resolutions typically greater than 25 μm. The disadvantage of using frequencies over 100 MHz is the high signal attenuation; therefore these high frequency measurements cannot be used in vivo and are limited to thin samples and cell culture studies.
This paper describes a photoacoustic microscope that uses a focused laser and UHF transducers with frequencies over 200 MHz to achieve resolution in the micrometer range. A quantitative analysis of the signals can be performed using the wide-bandwidth photoacoustic wave power spectrum, enabling a new type of single cell analysis not available to traditional photoacoustic microscopes.
2. Method
The photoacoustic microscope was designed and built by Kibero GmbH (Saarbrucken, Germany). It combines an inverted optical microscope with an ultrasound transducer positioned above the optics (Fig. 1A). A 532 nm laser (Microchip STG-03E, Teem Photonics, France) is focused into the side port of the microscope and reflected onto the sample using the same optical objective that is used to view the sample. The laser and transducer can be aligned under optical guidance to within 1 μm, with the sample positioned within the target path (Fig. 1B). The laser has a pulse width of 330 ps and operates at a pulse repetition frequency of 4 kHz. The laser fluence could be adjusted up to 650 mJ/cm2 when focused to a 5 μm spot size using a 10x objective (0.25 NA). The photoacoustic signals are recorded passively using three different ultrasound transducers (200, 375 and 1200 MHz supplied by Kibero GmbH) and amplified by a low noise 40 dB amplifier (Miteq, USA). Signal digitization is synchronized to the laser trigger, with a data acquisition rate up to 8 GHz using an Acqiris DC252 digitizer (Agilent, USA). Images were created by scanning the sample stage in a raster pattern through the target area while keeping the laser and transducer co-aligned. The entire microscope is contained in a temperature controlled chamber kept at 36 °C, which ensures live cell viability and reduces the ultrasound attenuation though the medium at the high frequencies used.
Fig. 1.
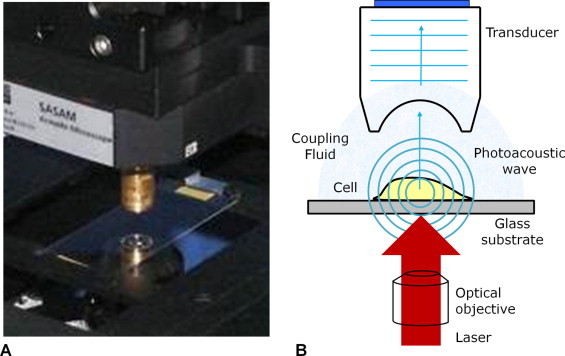
The photoacoustic microscope. (A) A view of the sample holder, with the transducer positioned above the sample and microscope optics. (B) A schematic of the sample measurement area. The cells on top of the substrate are irradiated by the focused laser, with the transducer recording the resulting photoacoustic signals.
Two types of cells were measured, melanoma cells (B16-F1) and human red blood cells (RBCs). Melanoma cells were cultured with Dulbecco's modified essential medium (DMEM) containing 10% fetal bovine serum (FBS) and passed every few days. Cells were dissociated with trypsin then transferred to a 35 mm diameter glass bottom dish (Mattek, USA) and allowed to grow for 24 h. The cells were then fixed with 10% formalin for 6 min and then placed in the microscope for imaging with PBS used as the coupling fluid. Hoechst 33342 was added to mark the nucleus using fluorescence. For the RBC measurements, a blood smear on a glass slide was prepared using freshly extracted blood from a human volunteer in accordance with the Ryerson University Ethics Board (REB #2012-210). The blood smear was fixed with methanol, and then placed in the microscope for imaging. For melanoma cells, 160 μm × 160 μm areas were scanned using a step size of 0.75–1.0 μm and a laser fluence of 350 mJ/cm2. For RBCs, 20 μm × 20 μm areas were scanned with a 0.2 μm step size and a laser fluence of 125 mJ/cm2. All signals were averaged 100 times to increase signal to noise (SNR). Acquisition times ranged from 10 to 15 min for each cell since signal averaging was used to increase the SNR. Images were generated by converting the maximum signal amplitude of each measured a-scan to grayscale values.
Three transducers with increasing frequency and bandwidth were used for photoacoustic imaging with center frequencies of 200, 375 and 1200 MHz. The transducer parameters such as the frequency, aperture width and angle, bandwidth and theoretical lateral and axial resolution [25] of each transducer are shown in Table 1. The bandwidth was determined by measuring the photoacoustic signal from a 200 nm thick gold film deposited on glass. This signal was also used to normalize the measured signal from cells by removing the characteristic response of the transducer [26]. The photoacoustic signal from the 200 nm layer is broadband, varying by only 3 dB from 1 to 2000 MHz according to theoretical predictions using an infinite layer model [27]. The power spectrum from the photoacoustic signal of the gold film, along with the theoretical power spectrum is shown in Fig. 2 for each transducer. Transducers are typically characterized in ultrasound imaging by recording pulse echo measurements on a flat ideal reflector (such as quartz or glass), which gives the bandwidth of the transducer. However the bandwidth for photoacoustic imaging is wider than with pulse-echo ultrasound imaging as the transducers are used only in receive mode. Ultrasound attenuation effects are reduced in photoacoustics measurements due to the one-way travel compared to two-travel for the pulse-echo measurements. Additionally, the photoacoustic signals generated from materials are strongly dependent on the laser fluence and the absorption coefficient of the material; these signals are inherently broadband, then limited by the detection bandwidth of the transducer. Further information on the microscope design, signal processing methods and normalization can be found in [28,29].
Table 1.
The transducer parameters and theoretical resolution for the transducers used in this study at 37 °C.
| Center Frequency (MHz) | −6 dB Bandwidth (MHz) | −12 dB Bandwidth (MHz) | Focal length (μm) | Aperture width (μm) | Aperture angle (degrees) | Axial resolution (μm) | Lateral resolution (μm) |
|---|---|---|---|---|---|---|---|
| 205 | 130 | 180 | 500 | 500 | 60 | 5.1 | 7.4 |
| 375 | 250 | 350 | 300 | 300 | 60 | 3.0 | 4.2 |
| 1225 | 670 | 1020 | 40 | 55 | 100 | 1.3 | 1.2 |
Fig. 2.
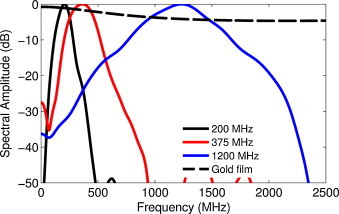
The transducer bandwidths of the three transducers (200, 375 and 1200 MHz) using the photoacoustic signals from a 200 nm gold film and the theoretical broadband signal generated from the gold film using the infinite layer model.
3. Results and discussion
Traditional photoacoustic microscopes use highly focused lasers to achieve good image resolution. In our system, transducers with center frequencies over 200 MHz are used which have theoretical lateral resolutions ranging from 8 μm (for 200 MHz) to 1 μm (for 1200 MHz) as shown in Table 1. These resolutions are comparable to the spot size of the laser. Therefore unlike other photoacoustic microscopes, the final image resolution depends on both the laser spot size and the frequency range of the receiving transducer.
The effect of the receiving transducer frequency on lateral image resolution was examined by imaging the same fixed melanoma cell using transducers with successively higher center frequencies as shown in Fig. 3. A phase contrast optical image of a fixed melanoma cell is shown in Fig. 3A, with the inset image showing the cell with the nucleus stained in blue (measured using Hoechst 33342 and fluorescence). The dark melanin particles are visibly distributed throughout the cytoplasm, particularly near the cell edges, with less melanin in the vicinity of the nucleus. In the photoacoustic images (Fig. 3B–D), the strongest signal occurs where the melanin particle density is greatest; the distribution of the melanin observed optically closely maps to the photoacoustic images. In these measurements, the laser energy and spot size remained the same size (approximately 350 mJ/cm2 and 5 μm, respectively). With the 200 MHz transducer, the ultrasound beam width at the focal spot (8 μm) is larger than the laser spot size (5 μm), and therefore the image resolution is limited by the laser spot size. The ultrasound beam width for the 375 MHz is 4 μm, slightly smaller than the 5 μm laser spot. Very minor improvements in detail are observed with the 375 vs. 200 MHz transducer, although the signal and details of structures around the nucleus increased using 375 MHz. As the resolving power of these two transducers is similar, only small differences in image resolution are expected. The b-scan image recorded at 1200 MHz (Fig. 3E) shows that the melanin located around the nucleus is elevated compared to the melanin around the nucleus. The nucleus does not contain melanin; in this case, the melanin particles are distributed in the cytoplasm between the nucleus and cell membrane. The height of the cell can be estimated from this elevated section. The signal from the elevated portion was approximately 4.4 ns ahead of the signal from the surrounding area. Using a sound speed of 1575 m/s within the cell [28], we can estimate the cell height at 6.9 μm, which is reasonable given the overall dimensions of the cell. The 1200 MHz transducer has near-micron resolution in both the lateral and axial resolutions (see Table 1), which enables visualization of structures axially that cannot be observed with traditional photoacoustic microscopes using lower frequency transducers. Despite using the same laser spot size for all measurements, the image resolution can be improved by using high transducer frequencies.
Fig. 3.
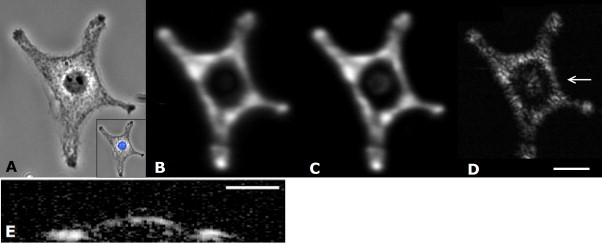
A melanoma cell. (A) Optical brightfield image (inset shows optical image of the cell overlaid with a fluorescent image of the stained nucleus), and (B–E) photoacoustic images of a single fixed B16-F1 melanoma cell. Three transducers were used to measure the photoacoustic signal from the same cell: (B) 200, (C) 375, and (D) 1200 MHz. As the transducer frequency increases, the ability to resolve the small micron-sized particles increases. (E) A B-scan image around the nucleus as indicated by the arrow on (D). Scale bar A–D is 30 μm, scale bar on E is 15 μm.
Photoacoustic images of single RBCs were then measured with the 1200 MHz transducer. Optical and photoacoustic images of the same RBC are shown in Fig. 4. The photoacoustic image shows the shape and details observed using optical microscopy, with a darker central region that corresponds to the RBC indentation in the center of the cell. The RBC is thinner in the center, and therefore contains less hemoglobin compared to the thicker periphery, resulting in a lower amplitude signal. Imaging single RBCs using photoacoustic microscopy is not new, and higher resolution photoacoustic images of single RBCs have been reported elsewhere [5]; however the distinct advantage of using UHF photoacoustic microscopy is the quantitative analysis using the wide-bandwidth spectrum and the very high SNR of the measurements, despite the fact that there is considerable ultrasound attenuation in the medium (approximately 20 dB through a 50 μm distance at 37 °C and 1 GHz ultrasound frequencies). The measured signal from the middle of the RBC is shown in Fig. 5A and the power spectrum from four different RBCs is shown in Fig. 5B. The power spectrum was normalized to remove the system response as described in Section 2. The −6 dB bandwidth is 875–1545 MHz; however we have found that the transducer sensitivity extends past this limit. We have used the −12 dB bandwidth of 710–1730 MHz to denote the frequency sensitivity. The spectral shape of the four RBCs are similar, with spectral minima occurring at 807, 832, 832, and 845 MHz, and others around 1500 MHz. The measured spectrum from the 200 nm gold layer is smooth and does not exhibit these spectral shapes (Fig. 2); these spectral features are directly related to RBC properties. The location of the spectral minimum around 800 MHz agrees with the predicted minimum from finite element model simulations using a typical RBC shape profile, with a thickness at the center of 1 μm [30,31]. Experimental measurements have shown that the frequency location of these spectral minima shift depending on the RBC morphology, which can be used to differentiate healthy and unhealthy RBCs [31]. Other theoretical and experimental studies of RBCs show that UHF spectral features can be used to detect RBC morphological variations due to malaria infection [32], RBC oxygenation [33], and RBC aggregation [34] due to changes in the UHF spectrum.
Fig. 4.
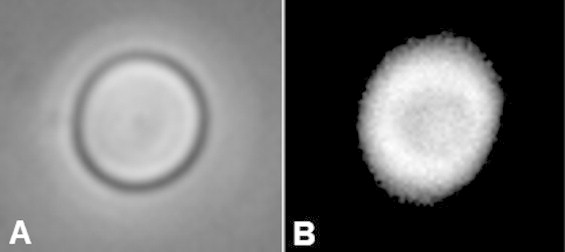
A red blood cell measured using the 1200 MHz transducer. (A) Optical and (B) Photoacoustic image of a single RBC fixed on the glass substrate. The contours the the RBC are clearly visible in both images. The width of the image is 15 μm.
Fig. 5.
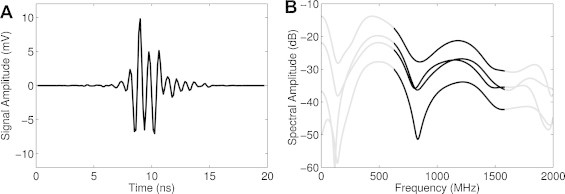
Signals from a red blood cell measured using the 1200 MHz transducer. (A) The measured photoacoustic signal from the center of a single RBC, and (B) the normalized photoacoustic power spectrum from four different RBCs. A similar shape is observed from each power spectrum, with spectral minima occurring around 800 and 1500 MHz. The area outside of the transducer −12 dB bandwidth has been grayed to emphasize the detectable signal.
The UHF photoacoustic microscope is capable of both a quantitative and qualitative analysis of samples. Image resolutions comparable to photoacoustic microscopes using lower frequencies can be achieved; however the key advantage is the wide-bandwidth UHF spectrum. Spectral analysis methods enable a quantitative examination of the cells probed, which can give details not provided through qualitative imaging methods alone.
Conflict of interest
The authors declare that there are no conflicts of interest.
Acknowledgements
The authors acknowledge helpful discussions and technical support from Arthur Worthington (Ryerson University, Canada), and Eike Weiss, Wolfgang Bost and Robert Lemor (Kibero GmbH/Fraunhofer Institute, Germany). E. Strohm is supported through a NSERC doctoral fellowship. This research was undertaken, in part, thanks to funding from the Natural Sciences and Engineering Research Council of Canada (216986-2012), the Canadian Institutes of Health Research (CCI 1117964) and the Canada Research Chairs Program awarded to M. Kolios. Funding to purchase the equipment was provided by the Canada Foundation for Innovation, the Ontario Ministry of Research and Innovation, and Ryerson University.
Biographies
Eric M. Strohm completed his B.Sc. in Physics at McMaster University, Hamilton, Canada in 1999. He worked as a research scientist at the Xerox Research Center of Canada until 2007. In 2009, he earned his M.Sc. in Biomedical Physics from Ryerson University in Toronto. He is currently a PhD student in the department of Physics at Ryerson University in Toronto, Canada under the supervision of Dr. Michael Kolios. His research interests include using high frequency ultrasound and photoacoustics for characterizing cells and particles.

Elizabeth Berndl completed the Biotechnology program at University of Ottawa, concurrently earning a B.Sc in Biochemistry and a B.A.Sc. in Chemical Engineering in 2007. She was then accepted to the Institute of Biomaterials and Biomedical Engineering at the University of Toronto, where she earned her M.A.Sc in 2011. Elizabeth is currently the Lab Co-ordinator for Michael Kolios’ lab at Ryerson, where she continues to learn about high frequency ultrasound and photoacoustics, and their applications in biological systems.

Michael C. Kolios completed a B.Sc. Hons degree in physics, with a computer science minor, at the University of Waterloo in 1991. He subsequently completed his M.Sc. and Ph.D. degrees in the Department of Medical Biophysics at the University of Toronto in 1994 and 1998, respectively. In 1997, he joined the Department of Physics at Ryerson University, where he is currently a professor and associate dean of research and graduate studies. He holds a Canada Research Chair in Biomedical Applications of Ultrasound and has been the recipient of numerous awards for his research and teaching. His research interests include ultrasound/optical imaging and characterization of tissues and cells, high-frequency ultrasound imaging and spectroscopy, acoustic microscopy, ultrasound- and laser-based therapy, optical coherence tomography, and photoacoustic imaging.
Footnotes
This is an open-access article distributed under the terms of the Creative Commons Attribution-NonCommercial-ShareAlike License, which permits non-commercial use, distribution, and reproduction in any medium, provided the original author and source are credited.
References
- 1.Xu M., Wang L.V. Photoacoustic imaging in biomedicine. Rev Sci Instrum. 2006;77:041101. [Google Scholar]
- 2.Briggs A., Kolosov O. Oxford University Press; USA: 2009. Acoustic microscopy. [Google Scholar]
- 3.Ku G., Maslov K., Li L., Wang L.V. Photoacoustic microscopy with 2-micron transverse resolution. J Biomed Opt. 2010;15:021302. doi: 10.1117/1.3339912. [DOI] [PMC free article] [PubMed] [Google Scholar]
- 4.Yang S., Ye F., Xing D. Intracellular label-free gold nanorods imaging with photoacoustic microscopy. Opt Express. 2012;20:10370–10375. doi: 10.1364/OE.20.010370. [DOI] [PubMed] [Google Scholar]
- 5.Zhang C., Maslov K., Wang L.V. Subwavelength-resolution label-free photoacoustic microscopy of optical absorption in vivo. Opt Lett. 2010;35:3195–3197. doi: 10.1364/OL.35.003195. [DOI] [PMC free article] [PubMed] [Google Scholar]
- 6.Bost W., Lemor R., Fournelle M. Comparison of the optoacoustic signal generation efficiency of different nanoparticular contrast agents. Appl Opt. 2012;51:8041–8046. doi: 10.1364/AO.51.008041. [DOI] [PubMed] [Google Scholar]
- 7.Harrison T., Ranasinghesagara J.C., Lu H., Mathewson K., Walsh A., Zemp R.J. Combined photoacoustic and ultrasound biomicroscopy. Opt Express. 2009;17:22041–22046. doi: 10.1364/OE.17.022041. [DOI] [PubMed] [Google Scholar]
- 8.Wang L., Maslov K., Yao J., Rao B., Wang L.V. Fast voice-coil scanning optical-resolution photoacoustic microscopy. Opt Lett. 2011;36:139–141. doi: 10.1364/OL.36.000139. [DOI] [PMC free article] [PubMed] [Google Scholar]
- 9.Yao D-K., Maslov K., Shung K.K., Zhou Q., Wang L.V. In vivo label-free photoacoustic microscopy of cell nuclei by excitation of DNA and RNA. Opt Lett. 2010;35:4139–4141. doi: 10.1364/OL.35.004139. [DOI] [PMC free article] [PubMed] [Google Scholar]
- 10.Zemp R.J., Song L., Bitton R., Shung K.K., Wang L.V. Realtime photoacoustic microscopy in vivo with a 30-MHz ultrasound array transducer. Opt Express. 2008;16:7915–7928. doi: 10.1364/oe.16.007915. [DOI] [PMC free article] [PubMed] [Google Scholar]
- 11.Shelton R.L., Applegate B.E. Off-axis photoacoustic microscopy. IEEE Trans Biomed Eng. 2010;57:1835–1838. doi: 10.1109/TBME.2010.2043103. [DOI] [PMC free article] [PubMed] [Google Scholar]
- 12.Oh J-T., Li M-L., Zhang H.F., Maslov K., Stoica G., Wang L.V. Three-dimensional imaging of skin melanoma in vivo by dual-wavelength photoacoustic microscopy. J Biomed Opt. 2006;11:034032. doi: 10.1117/1.2210907. [DOI] [PubMed] [Google Scholar]
- 13.Yuan Y., Yang S., Xing D. Optical-resolution photoacoustic microscopy based on two-dimensional scanning galvanometer. Appl Phys Lett. 2012;100:023702. [Google Scholar]
- 14.Xie Z., Jiao S., Zhang H.F., Puliafito C.A. Laser-scanning optical-resolution photoacoustic microscopy. Opt Lett. 2009;34:1771–1773. doi: 10.1364/ol.34.001771. [DOI] [PubMed] [Google Scholar]
- 15.Maslov K., Zhang H.F., Hu S., Wang L.V. Optical-resolution photoacoustic microscopy for in vivo imaging of single capillaries. Opt Lett. 2008;33:929–931. doi: 10.1364/ol.33.000929. [DOI] [PubMed] [Google Scholar]
- 16.Zhang E., Laufer J., Beard P. Backward-mode multiwavelength photoacoustic scanner using a planar Fabry-Perot polymer film ultrasound sensor for high-resolution three-dimensional imaging of biological tissues. Appl Opt. 2008;47:561–577. doi: 10.1364/ao.47.000561. [DOI] [PubMed] [Google Scholar]
- 17.Wang L.V., Hu S. Photoacoustic tomography in vivo imaging from organelles to organs. Science. 2012;335:1458–1462. doi: 10.1126/science.1216210. [DOI] [PMC free article] [PubMed] [Google Scholar]
- 18.Mallidi S., Luke G.P., Emelianov S. Photoacoustic imaging in cancer detection, diagnosis, and treatment guidance. Trends Biotechnol. 2011;29:213–221. doi: 10.1016/j.tibtech.2011.01.006. [DOI] [PMC free article] [PubMed] [Google Scholar]
- 19.Beard P. Biomedical photoacoustic imaging. Interface Focus. 2011;1:602–631. doi: 10.1098/rsfs.2011.0028. [DOI] [PMC free article] [PubMed] [Google Scholar]
- 20.Yao D-K., Chen R., Maslov K., Zhou Q., Wang L.V. Optimal ultraviolet wavelength for in vivo photoacoustic imaging of cell nuclei. J Biomed Opt. 2012;17:056004. doi: 10.1117/1.JBO.17.5.056004. [DOI] [PMC free article] [PubMed] [Google Scholar]
- 21.Hopwood D. Fixatives and fixation: a review. Histochem J. 1969;1:323–360. doi: 10.1007/BF01003278. [DOI] [PubMed] [Google Scholar]
- 22.Wang L.V. Multiscale photoacoustic microscopy and computed tomography. Nat Photonics. 2009;3:503–509. doi: 10.1038/nphoton.2009.157. [DOI] [PMC free article] [PubMed] [Google Scholar]
- 23.Rosencwaig A., Busse G. High-resolution photoacoustic thermal-wave microscopy. Appl Phys Lett. 1980;36:725. [Google Scholar]
- 24.Walsh J.T., Flotte T.J., Deutsch T.F. Er:YAG laser ablation of tissue: effect of pulse duration and tissue type on thermal damage. Lasers Surg Med. 1989;9:314–326. doi: 10.1002/lsm.1900090403. [DOI] [PubMed] [Google Scholar]
- 25.Cobbold R.S.C. 1st ed. Oxford University Press; 2006. Foundations of biomedical ultrasound. [Google Scholar]
- 26.Baddour R.E., Sherar M.D., Hunt J.W., Czarnota G.J., Kolios M.C. High-frequency ultrasound scattering from microspheres and single cells. J Acoust Soc Am. 2005;117:934. doi: 10.1121/1.1830668. [DOI] [PubMed] [Google Scholar]
- 27.Khan M., Sun T., Diebold G. Photoacoustic waves generated by absorption of laser radiation in optically thin layers. J Acoust Soc Am. 1993;93:1417. [Google Scholar]
- 28.Strohm E.M., Czarnota G.J., Kolios M.C. Quantitative measurements of apoptotic cell properties using acoustic microscopy. IEEE Trans Ultrason., Ferroelectr., Freq. Control. 2010;57:2293–2304. doi: 10.1109/TUFFC.2010.1690. [DOI] [PubMed] [Google Scholar]
- 29.Strohm E.M., Gorelikov I., Matsuura N., Kolios M.C. Acoustic and photoacoustic characterization of micron-sized perfluorocarbon emulsions. J Biomed Opt. 2012;17:096016. doi: 10.1117/1.JBO.17.9.096016. [DOI] [PubMed] [Google Scholar]
- 30.Strohm E.M., Hysi E., Kolios M.C. IEEE International Ultrasonics Symposium, Dresden, Germany. 2012. Photoacoustic measurements of single red blood cells. [Google Scholar]
- 31.Strohm E.M., Elizabeth S.L., Berndl, Kolios M.C. Probing red blood cell morphology using high frequency photoacoustics. Biophys J. 2013;105:59–67. doi: 10.1016/j.bpj.2013.05.037. [DOI] [PMC free article] [PubMed] [Google Scholar]
- 32.Saha R.K., Karmakar S., Roy M. Computational investigation on the photoacoustics of malaria infected red blood cells. PLoS ONE. 2012;7:e51774. doi: 10.1371/journal.pone.0051774. [DOI] [PMC free article] [PubMed] [Google Scholar]
- 33.Saha R.K., Karmakar S., Hysi E., Roy M., Kolios M.C. Validity of a theoretical model to examine blood oxygenation dependent optoacoustics. J Biomed Opt. 2012;17:055002. doi: 10.1117/1.JBO.17.5.055002. [DOI] [PubMed] [Google Scholar]
- 34.Saha R.K., Kolios M.C. A simulation study on photoacoustic signals from red blood cells. J Acoust Soc Am. 2011;129:2935. doi: 10.1121/1.3570946. [DOI] [PubMed] [Google Scholar]