

Abstract
Spectroscopic photoacoustic imaging has the potential to become a powerful tool that can estimate distributions of optically absorbing chromophores in the body. We have developed an algorithm to select imaging wavelengths for spectroscopic photoacoustics given the spectra of expected chromophores. The algorithm uses the smallest singular value of a matrix constructed from the absorption spectra as a criterion to remove extraneous wavelengths. The method performed significantly better than an approach where evenly spaced wavelengths were used in the presence of noise and wavelength-dependent attenuation of light in tissue. Finally, the algorithm was applied to photoacoustic imaging of a phantom containing indocyanine green dye and silica-coated gold nanorods, demonstrating significant improvements in the ability to estimate relative contrast agent concentrations compared to the case where evenly spaced wavelengths were chosen. In summary, our work provides a versatile framework to select optical wavelengths and evaluate sets of absorbers for spectroscopic photoacoustic imaging.
Keywords: Spectroscopic photoacoustic imaging, Feature selection, Spectral unmixing, Spectroscopy
1. Introduction
Photoacoustic (PA) imaging, also known as optoacoustic imaging, is a rapidly growing biomedical imaging modality [1–5]. PA imaging offers high contrast derived from differences in optical absorption with excellent resolution at clinically relevant depths. Endogenous chromophores, such as hemoglobin, melanin, and lipids, can all be detected using PA imaging [6–8]. This shows great promise for the noninvasive clinical detection and characterization of atherosclerotic plaques [9,10] and certain tumors [11]. Highly absorbing contrast agents (e.g., dyes or plasmonic nanoparticles) are commonly used in conjunction with PA imaging [12–16]. These contrast agents are often molecularly targeted to observe a specific cellular expression or interaction, allowing for further characterization of the disease [15,17].
The optical absorption spectra of the tissue components and contrast agents vary greatly with optical wavelength. Therefore, spectroscopic methods can be used to unmix the signals from different optical absorbers in a photoacoustic image and provide an estimate of their concentrations [8,13,18]. This technique is known as spectroscopic PA (sPA) imaging. sPA imaging allows for accurate measurement of blood oxygenation saturation (SO2) or nanoparticle deposition in tissue [19,20].
A number of methods have been proposed to spectrally unmix absorbers in PA images. One simple spectroscopic method uses a ratio of the PA signals acquired at two optical wavelengths. This ratio is then used to estimate either SO2 or the state of an activatable contrast agent [21,22]. The main drawback of using a ratio is that at most two absorbers can be distinguished, limiting the potential applications. Intraclass correlation (ICC) has been used to simultaneously identify multiple absorbers. ICC correlates the measured PA spectrum at each pixel to the known absorption spectra of the anticipated absorbers and assigns each pixel to one (and only one) absorber [13]. This method can identify multiple chromophores, but the assumption that each pixel only contains one absorber is not always valid – particularly in the case of blood, where the spectrum is a linear combination of deoxygenated and oxygenated hemoglobin, depending on the level of SO2.
An alternative approach, which treats each pixel as a linear combination of absorbers, provides a more realistic model [20]. Thus, each pixel can contain multiple absorbers and the relative contribution of each absorber to the overall spectrum can be estimated. A linear model is then used to calculate the absorber concentrations in each pixel while minimzing the mean squared error.
In each aforementioned method, the choice of optical wavelengths is critically important. The unique spectral features of each absorber must be captured by a discrete set of wavelengths. Ideally, a large number of wavelengths spanning a broad spectrum should be used. In practice, the number of wavelengths that can be used is limited by a number of factors, including the linewidth of the laser, the spectral range of the laser, the spectral-dependent attenuation of light in tissue, and the pulse repetition rate of the laser. In PA imaging, the temporal resolution is primarily limited by the pulse repetition rate of the laser, typically 10–20 Hz for a high energy tunable laser system. Each imaging wavelength further decreases the temporal resolution, thereby increasing the overall imaging time and the likelihood of introducing motion artifacts, which can be detrimental to spectral unmixing. Thus, wavelength selection can be used to improve the temporal resolution while maintaining acceptable levels of uncertainty in the estimated chromophore concentrations. Heretofore, the optical wavelengths used in sPA imaging have typically been chosen heuristically. Here we present a method to select optical wavelengths such that the concentration estimation remains robust in the presence of noise.
2. Theory
Assuming the stress and thermal confinements are met (i.e., the laser pulse length is short enough that the local pressure and temperature rise are constrained to a small volume), the peak pressure, P, generated by the PA effect depends on the Grüneisen parameter of the tissue, Γ, the laser fluence at the absorber, F, and the optical absorption coefficient of the absorber, μa [23]:
| (1) |
In practice, the pressure detected by an ultrasound transducer has been attenuated as the pressure wave travels through the tissue toward the transducer. Accurate reconstruction of P is not trivial and depends on the geometry and point spread function of the transducer [24]. In this paper, to simplify the problem and focus on spectral unmixing, we assume that P has been accurately reconstructed.
Additional factors also complicate Eq. (1). In practice, F can vary greatly depending on optical properties of tissue and optical wavelength, λ. Furthermore, μa is a function of λ and each of N distinct absorbers in the region of interest will contribute to the overall absorption. Thus, Eq. (1) becomes:
| (2) |
The optical absorption can be related to the concentration of an absorber and the absorption cross section as follows:
| (3) |
where C[i] is the concentration of the ith absorber and is the molar absorption cross section of the ith absorber at wavelength λ. Eq. (2) is then expanded to:
| (4) |
The Grüneisen parameter is tissue-dependent and has little variation in water-based tissues at constant temperature. Therefore, it is often assumed to be constant. If the fluence at the absorber is known, then the optical absorption coefficient vector, μest(λ), can be estimated:
| (5) |
Then Eq. (4) can be simplified to a set of linear equations:
| (6) |
where μest is a vector whose components correspond to the reconstructed absorption coefficient at each individual optical wavelength, ɛ is the absorption cross-section matrix whose rows correspond to optical wavelengths and columns are the normalized absorption cross section spectra of the optical absorbers (i.e., , and C is a vector whose elements correspond to the relative concentration of each optical absorber.
In order to solve Eq. (6) for the absorber concentrations, the number of optical wavelengths used to acquire images, M, must be greater than or equal to the number of absorbers, N. In the presence of noise, it is useful to have M > N, thus making Eq. (6) over-constrained. In this case, a least squared error estimate of C can be found:
| (7) |
where ɛ+ is the Moore-Penrose pseudoinverse of ɛ, defined as [25]:
| (8) |
This estimate of the concentrations has been used to simultaneously measure SO2 and the concentration of a dye or nanoparticles in vivo [19,20]. Further modifications can be made to Eq. (7) to ensure the sum of the concentrations is 1 and negative concentrations (an artifact related to finite signal-to-noise ratio of the images or the presence of an absorber not included in absorption cross-section matrix) are avoided [20,26].
3. Materials and methods
3.1. Wavelength selection algorithm
The goal of the wavelength selection algorithm was to select a set of optical wavelengths in such a way as to increase the accuracy of existing spectral unmixing algorithms. This set of imaging wavelengths was chosen from a larger set of wavelengths for which accurate values of μa(λ) for each of the absorbers in the imaging volume were found from literature or were measured (e.g., via spectrophotometry). Extraneous wavelengths were recursively discarded such that the salient features of each absorber's spectrum were maintained.
First, the molar absorption matrix, ɛ, was populated with the absorption spectra with N columns corresponding to individual absorbers and M rows corresponding to the optical wavelengths. Only absorbers that are present in the imaging volume and generate detectable PA signal in the spectral range should be included in ɛ. The number of rows is limited by a number of factors, including the spectral range of the laser and spectral resolution of the absorption spectra data. It was assumed that the rank(ɛ) = N. That is, the concentrations of all N absorbers can be perfectly reconstructed from the M wavelengths in the absence of noise.
The smallest singular value of ɛ, σmin, was used as an indication of its stability. As σmin → 0, ɛ becomes unstable and may lose rank in the presence of noise. In other words, the spectrum of one absorber can be approximated by a linear combination of the other absorbers. Thus, multiple combinations of absorber concentrations can represent a single PA spectrum.
Each row was iteratively removed from ɛ and σmin was calculated for the truncated matrix. The row whose removal resulted in the largest σmin was taken to correspond to the least-critical wavelength and was excluded. This process was recursively repeated until the desired number of wavelengths was reached. In practice, the number of wavelengths will depend on the temporal resolution required, the noise level of the imaging system, and the desired level of accuracy in concentration estimations. The implementation of the algorithm is outlined below:
-
1.
Construct ɛ from N absorbers and M wavelengths
-
2.
Remove the first row of ɛ and calculate σmin of the truncated matrix
-
3.
Repeat step 2 M times for each row of ɛ
-
4.
Let ɛ equal the truncated matrix with the largest σmin; let M equal M − 1
-
5.
Repeat steps 2–4 until M is the desired number of wavelengths or σmin reaches the minimum desired level
3.2. Algorithm evaluation
In order to show the robustness of the algorithm, it must be evaluated on a large number of unique spectra. To achieve this, we constructed artificial absorption spectra spanning from 680 nm to 970 nm, a common PA imaging range that is achieved with the second harmonic of a Nd:YAG laser coupled to an optical parametric oscillator. The spectra were constructed by creating five points consisting of a random wavelength and random absorption coefficient uniformly distributed between 680–970 nm and 0–1, respectively. Then, spline interpolation was used to create a smooth absorption curve across the entire spectral range. Representative absorption spectra are shown as the solid lines in Fig. 1a.
Fig. 1.
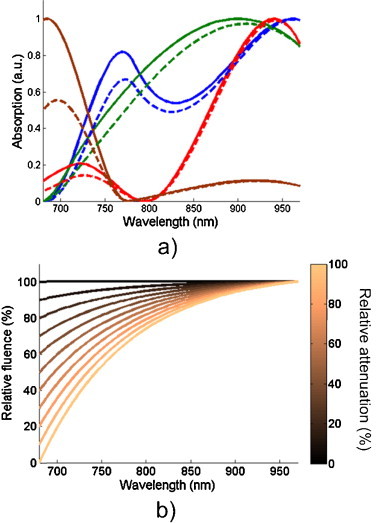
(a) Representative constructed optical absorption spectra used for algorithm analysis before (solid lines) and after (dashed lines) 50% wavelength-dependent attenuation, and (b) a typical attenuation curve with relative changes in laser fluence ranging from 0% to 100%.
Four random spectra were combined into a single optical absorption matrix. A single spectrum was created from a linear combination of the four individual spectra. Ten percent additive white Gaussian noise was added to the spectrum. After pruning wavelengths using the algorithm described in the previous section, a minimum mean squared error estimate of the concentrations was calculated using the pseudoinverse of the absorption matrix. The root mean squared (RMS) error, eRMS, of the estimate of each absorber's concentration, Cest, was used as a metric for the performance of the spectral unmixing:
| (9) |
Thus, an RMS error of 0.1 corresponds to uncertainty in the estimate equivalent to the added noise. This process was repeated 105 times for different concentrations of absorbers to acquire an average RMS error, after which the error was correlated to σmin. Next, the process was repeated using either randomly selected wavelengths or evenly spaced wavelengths and the error was compared for the three methods as a function of number of wavelengths.
Finally, we investigated the effect wavelength-dependent attenuation in tissue models. A decaying exponential (as a function of optical wavelength) was used to simulate the attenuation of light in tissue. The attenuation spectrum was scaled to create relative changes in fluence spanning from 0% to 100% (Fig. 1b). The relative attenuation can be thought of as a depth-dependent effect. That is, as the imaging depth increases, the shorter wavelengths will be preferentially attenuated, and the laser fluence that reaches a deep-seated absorber will likewise be decreased. The absorption spectra were scaled by the resulting fluence spectrum to create a second set of spectra that represent absorbers deep in tissue. The dashed lines in Fig. 1a show the resulting absorption spectra after a 50% relative attenuation has been applied by multiplying each absorption spectrum by the relative fluence spectrum. We used the developed algorithm to select wavelengths for both sets of spectra and calculated the average spectral distance between each wavelength selected for the tissue-attenuated spectra and nearest selected wavelength of original spectra. This provided an estimate of how tissue attenuation affects the choice of wavelengths. Using the methods described previously, we estimated eRMS of the attenuated spectra using the pseudoinverse of the original absorption matrix decimated to between 4 and 20 wavelengths using the developed method. Thus, an estimate of the error induced by ignoring wavelength-dependent attenuation in tissue was determined.
3.3. Phantom imaging
We performed an imaging experiment of a gelatin phantom to confirm the results seen in the simulations. We constructed a phantom containing 8% gelatin (Sigma–Aldrich) and 0.4% of 30 μm silica particles (U.S. Silica). Six glass pipettes were embedded in the top surface of the gelatin phantom (Fig. 2a and b). The pipettes were filled with 800 μM indocyanine green (ICG) dye (Sigma–Aldrich), silica-coated gold nanorods (NRs) at a concentration of approximately 5 × 10¹² particles/mL, or mixtures of the two solutions containing 20, 40, 60, or 80% NRs. These solutions correspond to 80, 60, 40, and 20% ICG, respectively. PA images (Fig. 2c) of the samples were collected using a Vevo LAZR photoacoustic imaging system (VisualSonics, Inc.) with a LZ-550 linear array transducer (256 elements, 40-MHz center frequency). Photoacoustic images were acquired across the 680–970 nm spectral range in steps of 2 nm (for a total of 146 images of each sample). The PA signal is constrained to the edges of the pipette. This results from the homogenous distribution of absorbers and the relatively high center frequency of the transducer [27]. A region of interest at the top of the sample (white box in Fig. 2d) was used for further analysis. The PA spectra of the 100% ICG and 100% NR solutions were used as the reference absorption spectra for wavelength selection and served as controls for spectral unmixing (Fig. 2e). The ICG spectrum indicates that it has assumed its aggregated state [28]. The PA images of the region of interest of each sample (Fig. 2f) were used to estimate the relative concentrations of ICG and NRs (Fig. 2g). Following imaging, a 3-mm optical and ultrasound attenuation layer containing 8% gelatin, 0.4% silica, and 40 μM ICG was placed above the samples and imaging was repeated. The ICG served as an optical absorber and the silica acted as an acoustic and optical scatterer.
Fig. 2.
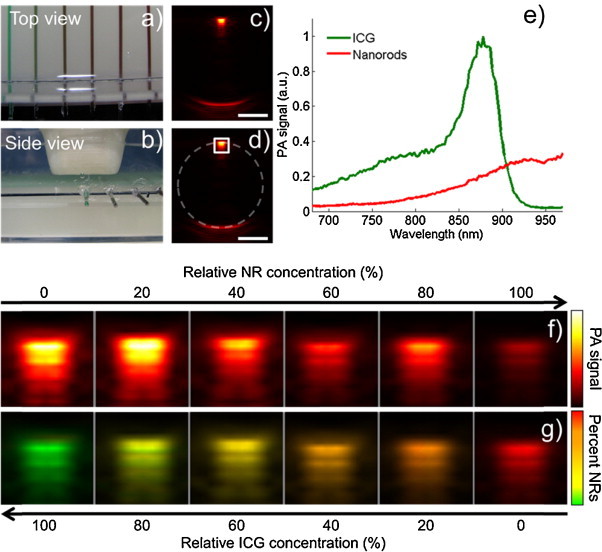
(a and b) Photographs showing the imaging phantom consisting of pipettes containing ICG dye and silica-coated gold nanorods embedded in a gelatin phantom, (c) a representative PA image acquired at 880 nm, (d) the same image as in (c) with the location of the pipette (dashed circle) and the region of interest used for further analysis (white box) indicated, (e) the PA spectra of ICG and silica-coated gold nanorods which were used for spectral unmixing in this experiment, (f) PA images of the region of interest of each pipette acquired with an excitation wavelength of 880 nm, and (g) the spectrally unmixed sPA images of the same region of interest using PA images from all 146 optical wavelengths. Scale bars are 1 mm.
4. Results and discussion
The median error in reconstructed concentrations proved to be inversely proportional to σmin across a broad range of wavelengths and optical spectra (Fig. 3a; R2 = 0.96). For large σmin, the spectra can be unmixed with high accuracy. However, as σmin approaches 0, ɛ becomes unstable and the RMS error in the reconstructed concentrations becomes much greater than the magnitude of the added noise. Thus, σmin provides a good criterion for selecting a subset of wavelengths for sPA imaging. Furthermore, because the inverse relationship is linear, σmin can be used to predict the level of precision with which absorber concentrations can be estimated. Therefore, the imaging wavelengths and contrast agent(s) can be simultaneously optimized for a given application.
Fig. 3.
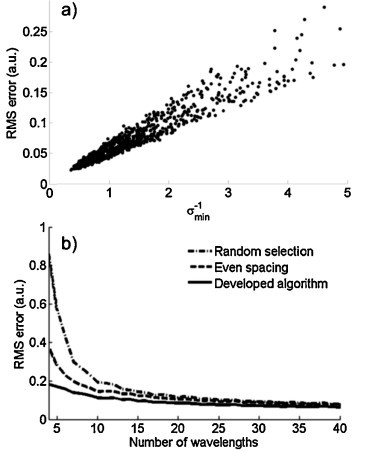
(a) A scatter plot showing an inverse correlation between σmin and the RMS error in the concentration estimation, and (b) a comparison between three wavelength selection strategies shows the developed algorithm performs significantly better.
The developed algorithm was compared to two other methods of wavelength selection: (1) choosing wavelengths randomly and (2) choosing wavelengths that are evenly spaced throughout the optical range (Fig. 3b). The algorithm consistently yielded better results than the other two wavelength selection methods. In fact, only half of the wavelengths are needed to reach the input noise level than in the case where evenly spaced wavelengths are used. This improved performance is due to the algorithm's tendency to preserve the salient spectral characteristics of the absorbers while extraneous wavelengths are discarded.
In deriving Eq. (6), we made four important assumptions: (1) the magnitude of the initial photoacoustic pressure is accurately reconstructed in each pixel, (2) the Grüneisen parameter is constant throughout the image, (3) the photoacoustic signal generation is linear, and (4) the fluence has been accurately estimated in each pixel. Neither the accuracy of the pressure reconstruction nor the Grüneisen parameter depends on the excitation wavelength. Therefore, errors resulting from the first two assumptions will only affect the magnitude of μest ; the relative absorber concentration estimates will remain unchanged. Nonlinear photoacoustic signal generation (e.g., arising from high laser fluence or aggregated nanoparticles) could lead to a distorted μest, but these nonlinear effects are not significant in most imaging applications [29–31].
Because the fluence is wavelength-dependent, errors from the fourth assumption will result in spectral changes of μest. Estimating the laser fluence that reaches the absorber is a complex problem and depends on the distribution of all absorbers and scatterers in the light path. Because of this dependence, the fluence and chromophore concentrations are not separable in general. This leads to an inverse problem where the chromophore concentration, absorption coefficient, scattering coefficient, and laser fluence must be solved for simultaneously [32].
While the four assumptions may introduce small errors into the estimation of absorber concentrations, they have little effect on the choice of sPA imaging wavelengths. Fig. 4a shows the average minimum spectral distance between wavelengths selected before and after wavelength-dependent optical attenuation. The graph shows that the algorithm is robust to a broad range of relative attenuation. Thus, the wavelengths chosen based on the unattenuated absorption spectra will typically work well even when the absorbers are situated deep in tissue. If the wavelength-dependent attenuation light in tissue is not accounted for (or is incorrectly estimated), the resulting distortion of the photoacoustic spectrum will lead to errors in the absorber concentration estimation. Fig. 4b shows a scatter plot of the errors resulting from spectral-dependent attenuation of the fluence in the absence of noise. In general, small errors in the fluence estimation result in smaller errors in the estimated concentrations. Indeed, errors greater than 20% in the estimated concentration are not common until the relative attenuation reaches 40%. Although we model the attenuation spectrum of light as a decaying exponentially as the optical wavelength increases, we achieved similar results for arbitrary attenuation spectra. This indicates that, while the distribution of light in tissue should be modeled for sPA imaging, small errors in the model will still result in accurate spectral unmixing results.
Fig. 4.
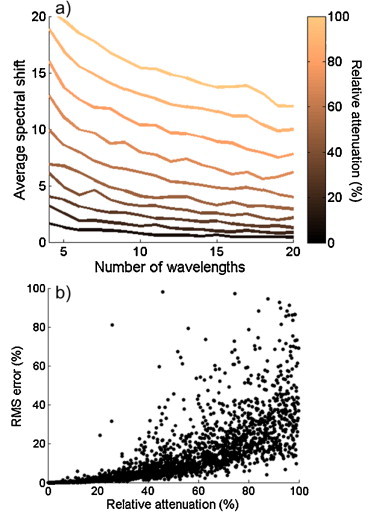
(a) The average shift in the selected wavelengths after the absorption spectra have been distorted by wavelength-dependent attenuation, and (b) a scatter plot of the error in the concentration estimation resulting from these changes in attenuation in the absence of noise.
One particularly useful application of sPA imaging is the measurement of blood oxygen saturation. This is often performed in the absence of an exogenous contrast agent. In this case, only two spectra need to be considered: deoxygenated and oxygenated hemoglobin. In the wavelength range of 680 nm to 970 nm we found that evenly spaced wavelengths performed as well as the developed algorithm when only these two spectra are considered in the simulation. We attribute this to the fact that the two spectra are significantly different throughout the wavelength range. Indeed, as long as wavelengths greater than and less than 800 nm (the wavelength of equal absorption) are chosen, the oxygen saturation could be estimated with high accuracy. Our method selected wavelengths on the edges of the spectral range (i.e., 680 nm and 970 nm) with additional wavelengths contributing to improved performance mainly through the suppression of uncorrelated noise.
Finally, we applied our wavelength selection algorithm in imaging of the tissue-mimicking phantom. Fig. 5a shows the estimated relative NR concentration for the sample containing 40% NRs (solid line) when wavelengths are selected using the developed algorithm. It can be seen that sPA imaging provides a good estimate of the NR concentration even when as few as two wavelengths are used. When the optical and ultrasonic attenuating layer was added, the resulting spectrum (Fig. 5a, dashed line) shows a slight over-estimation of the NRs. This is due to the fact the 3-mm layer preferentially attenuated the shorter wavelengths. Thus, the ICG peak appeared to be smaller in the acquired PA signals. This effect could be corrected if we were to model the transmission of light through the attenuation layer. Fig. 5b shows the relative NR concentration estimated from the same sample using evenly spaced wavelengths across the 680–970 nm range. The concentration estimation is much less stable as wavelengths are removed, and large errors are observed when fewer than five wavelengths are used. When the attenuation layer was added (dashed line), a similar overestimation of the NR concentration is seen as in Fig. 5a. In addition, the concentration estimation errors are greatly accentuated. Fig. 5c shows a comparison of the estimated relative NR concentration for each of the samples (in the absence of the attenuation layer) when using evenly spaced wavelengths (black lines) and when using wavelengths selected using the developed algorithm (blue lines). The top and bottom lines represent controls because the PA spectra acquired from these samples were used for spectral unmixing. These results indicate that by carefully selecting imaging wavelengths, significant improvements in sPA imaging can be achieved.
Fig. 5.
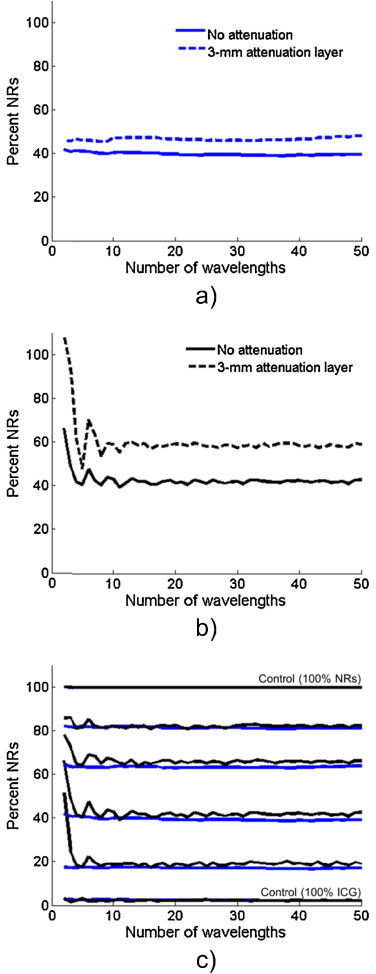
(a) The relative concentrations of ICG and silica-coated gold nanorods can be accurately estimated from PA images acquired at wavelengths selected by the developed algorithm even when as few as 2 wavelengths are used (solid line). Adding a 3-mm layer of attenuating gelatin leads to a slight over-estimation of the nanorods concentration (dashed line). (b) When evenly-spaced wavelengths are used, the concentration estimate becomes unstable when a small number of wavelengths are used (solid line), and this effect becomes more pronounced when the attenuating layer is added (dashed line). (c) The developed algorithm (blue lines) produces much more reliable estimates of concentration than even spacing (black lines) in all inclusions. The 0% and 100% lines act as controls since the absorption spectra were derived from these signals.
The benefits of spectral unmixing and the developed algorithm depend on several factors. The contrast agent(s) must be selected to have desirable spectral characteristics. Contrast agents with distinct spectral features (e.g., a sharp peak or multiple peaks) are ideal. In general, dyes tend to have a narrower absorption peak than plasmonic nanoparticles (owing mainly to the polydispersity which results from commonly-used wet chemistry synthesis methods). Nanoparticles, however, can exhibit a much higher optical absorption than dyes [33]. Light penetration in tissue is also an important factor when choosing contrast agents. Deeper penetration in tissue at longer wavelengths (near 1064 nm), results in an increased signal-to-noise ratio [34]. Of course, when in vivo imaging is performed, there are many more important characteristics in determining an appropriate contrast agent. These include toxicity, clearance, circulation time, delivery and molecular specificity. Therefore, choosing one of the myriad PA contrast agents should be deliberate and will depend on the application.
Spectroscopic photoacoustic imaging can be augmented with other methods to help localize contrast agents and estimate their concentrations. One method that can be used is collecting a baseline image before administering the contrast agent. This image can be subtracted from a second image collected after the contrast agent has been injected [35]. If it is assumed that the concentration of endogenous absorbers does not change, then the resulting image contains only the signal from the contrast agent. After effectively removing the endogenous absorbers from the image, the sPA unmixing algorithms can focus on resolving the exogenous contrast agents. Thus, fewer wavelengths can be used and greater accuracy in concentration estimation can be achieved. The main drawback of this method is that it requires two imaging sessions and, furthermore, exact co-registration between the two images, a feat that is often difficult to achieve in vivo.
Our method is not limited to sPA imaging. Indeed, it can be applied to a wide variety of spectroscopic imaging applications to simultaneously improve accuracy and decrease acquisition time. For example, the work could be extended to identify light sources for diffuse optical spectroscopic imaging [36]. It may also be possible to modify the algorithm to optimize multiplex fluorescent imaging [37].
5. Conclusion
We have developed an algorithm to choose optical wavelengths for spectroscopic photoacoustic imaging based on the spectral characteristics of the absorbers known to be in the region. We have demonstrated that significantly improved results can be achieved by simply selecting a better set of wavelengths. Furthermore, the criterion for wavelength selection – σmin – provides a useful metric to predict (and optimize) the ability to spectrally unmix a specific set of absorbers. Finally we showed the application of the algorithm in phantom imaging study. The developed algorithm performed well for determining the relative concentration of two contrast agents.
Conflict of interest statement
S.Y.E., is a shareholder and member of the board of directors for NanoHybrids Inc., which was not involved with this study.
Acknowledgements
The authors would like to thank Dr. Salavat Aglyamov and Dr. Ahmed Tewfik of the University of Texas at Austin for their helpful discussion and review of the manuscript, and Dr. Yun-Sheng Chen of The University of Texas at Austin for providing the silica-coated gold nanorods. Funding for this work was provided in part by the National Institutes of Health grants R01CA149740, R01EB008101, and F31CA168168 (to G.P.L.).
Biographies

Geoffrey P. Luke is a graduate student in the Department of Electrical Engineering at The University of Texas at Austin. He received a B.S. in Computer Engineering and Mathematics and a M.S. in Electrical Engineering from the University of Wyoming, where he developed a sensor based on the visual system of the common housefly. His current research in the Ultrasound Imaging and Therapeutics Research Laboratory is focused on early cancer detection and characterization using molecular spectroscopic photoacoustic imaging.

Seung Yun Nam received his B.S. in Electrical and Computer Engineering from Seoul National University, South Korea, in 2007. He entered The University of Texas at Austin for his graduate education, and received his M.S. degree in Electrical and Computer Engineering (Biomedical Engineering track) in 2010. Currently he is pursuing his Ph.D. under the supervision of Dr. Stanislav Emelianov at The University of Texas at Austin. His graduate research has been focused on monitoring stem cells and tissue regeneration using molecular contrast agents and combined ultrasound and photoacoustic imaging.

Stanislav Y. Emelianov Ph.D is a Professor and an Associate Chair for Research in the Department of Biomedical Engineering at The University of Texas at Austin where he directs the Ultrasound Imaging and Therapeutics Research Laboratory. In addition, Dr. Emelianov is an Adjunct Professor of Imaging Physics at The University of Texas M.D. Anderson Cancer Center in Houston. Dr. Emelianov's research interests are in the areas of medical imaging for diagnostic and therapeutic applications, bionanotechnology, photoacoustic imaging, ultrasound imaging, elasticity imaging, cellular/molecular imaging, and functional imaging.
Footnotes
This is an open-access article distributed under the terms of the Creative Commons Attribution-NonCommercial-ShareAlike License, which permits non-commercial use, distribution, and reproduction in any medium, provided the original author and source are credited.
Contributor Information
Geoffrey P. Luke, Email: geoffluke@utexas.edu.
Stanislav Y. Emelianov, Email: emelian@mail.utexas.edu.
References
- 1.Emelianov S.Y., Li P.-C., O’Donnell M. Photoacoustics for molecular imaging and therapy. Physics Today. 2008;3:4–9. doi: 10.1063/1.3141939. [DOI] [PMC free article] [PubMed] [Google Scholar]
- 2.Kruger R.A., Kiser W.L., Reinecke D.R., Kruger G.A. Thermoacoustic computed tomography using a conventional linear transducer array. Medical Physics. 2003;30(5):856–860. doi: 10.1118/1.1565340. [DOI] [PubMed] [Google Scholar]
- 3.Oraevsky A.A., Jacques S.L., Esenaliev R.O., Tittel F.K. Society of Photo-Optical Instrumentation Engineers (SPIE) Conference Series, vol. 2134. 1994. Laser-based optoacoustic imaging in biological tissues; p. 122. [Google Scholar]
- 4.Wang X., Pang Y., Ku G., Xie X., Stoica G., Wang L.V. Noninvasive laser-induced photoacoustic tomography for structural and functional in vivo imaging of the brain. Nature Biotechnology. 2003;21(7):803–806. doi: 10.1038/nbt839. [DOI] [PubMed] [Google Scholar]
- 5.Ntziachristos V., Ripoll J., Wang L.V., Weissleder R. Looking and listening to light: the evolution of whole-body photonic imaging. Nature Biotechnology. 2005;23(3):313–320. doi: 10.1038/nbt1074. [DOI] [PubMed] [Google Scholar]
- 6.Hu S., Wang L.V. Photoacoustic imaging and characterization of the microvasculature. Journal of Biomedical Optics. 2010;15(1):011101–11115. doi: 10.1117/1.3281673. [DOI] [PMC free article] [PubMed] [Google Scholar]
- 7.Oh J-T., Li M-L., Zhang H.F., Maslov K., Stoica G., Wang L.V. Three-dimensional imaging of skin melanoma in vivo by dual-wavelength photoacoustic microscopy. Journal of Biomedical Optics. 2006;11(3):034032–34034. doi: 10.1117/1.2210907. [DOI] [PubMed] [Google Scholar]
- 8.Wang B., Su J.L., Amirian J., Litovsky S.H., Smalling R., Emelianov S. Detection of lipid in atherosclerotic vessels using ultrasound-guided spectroscopic intravascular photoacoustic imaging. Optics Express. 2010;18(5):4889–4897. doi: 10.1364/OE.18.004889. [DOI] [PMC free article] [PubMed] [Google Scholar]
- 9.Karpiouk A.B., Wang B., Amirian J., Smalling R.W., Emelianov S.Y. Feasibility of in vivo intravascular photoacoustic imaging using integrated ultrasound and photoacoustic imaging catheter. Journal of Biomedical Optics. 2012;17(9):1. doi: 10.1117/1.JBO.17.9.096008. [DOI] [PMC free article] [PubMed] [Google Scholar]
- 10.Wang B., Karpiouk A., Yeager D., Amirian J., Litovsky S., Smalling R. In vivo intravascular ultrasound-guided photoacoustic imaging of lipid in plaques using an animal model of athersclerosis. Ultrasound in Medicine and Biology. 2012;38(12):2098–2103. doi: 10.1016/j.ultrasmedbio.2012.08.006. [DOI] [PMC free article] [PubMed] [Google Scholar]
- 11.Jose J., Manohar S., Kolkman R.G.M., Steenbergen W., van Leeuwen T.G. Imaging of tumor vasculature using twente photoacoustic systems. Journal of Biophotonics. 2009;2(12):701–717. doi: 10.1002/jbio.200910025. [DOI] [PubMed] [Google Scholar]
- 12.Luke G., Yeager D., Emelianov S. Biomedical applications of photoacoustic imaging with exogenous contrast agents. Annals of Biomedical Engineering. 2011:1–16. doi: 10.1007/s10439-011-0449-4. [DOI] [PubMed] [Google Scholar]
- 13.Mallidi S., Larson T., Tam J., Joshi P.P., Karpiouk A., Sokolov K. Multiwavelength photoacoustic imaging and plasmon resonance coupling of gold nanoparticles for selective detection of cancer. Nano Letters. 2009;9(8):2825–2831. doi: 10.1021/nl802929u. [DOI] [PMC free article] [PubMed] [Google Scholar]
- 14.Wang Y., Xie X., Wang X., Ku G., Gill K.L., O’Neal D.P. Photoacoustic tomography of a nanoshell contrast agent in the in vivo rat brain. Nano Letters. 2004;4(9):1689–1692. [Google Scholar]
- 15.Homan K.A., Souza M., Truby R., Luke G.P., Green C., Vreeland E. Silver nanoplate contrast agents for in vivo molecular photoacoustic imaging. ACS Nano. 2012;6(1):641–650. doi: 10.1021/nn204100n. [DOI] [PMC free article] [PubMed] [Google Scholar]
- 16.Buehler A., Herzog E., Razansky D., Ntziachristos V. Video rate optoacoustic tomography of mouse kidney perfusion. Optics Letters. 2010;35(14):2475–2477. doi: 10.1364/OL.35.002475. [DOI] [PubMed] [Google Scholar]
- 17.Mallidi S., Larson T., Aaron J., Sokolov K., Emelianov S. Molecular specific optoacoustic imaging with plasmonic nanoparticles. Optics Express. 2007;15(11):6583–6588. doi: 10.1364/oe.15.006583. [DOI] [PubMed] [Google Scholar]
- 18.Sethuraman S., Amirian J.H., Litovsky S.H., Smalling R.W., Emelianov S.Y. Spectroscopic intravascular photoacoustic imaging to differentiate atherosclerotic plaques. Optics Express. 2008;16(5):3362–3367. doi: 10.1364/oe.16.003362. [DOI] [PubMed] [Google Scholar]
- 19.Li M.-L., Oh J.-T., Xie X., Geng K., Wang W., Li C. Simultaneous molecular and hypoxia imaging of brain tumors in vivo using spectroscopic photoacoustic tomography. Anglais. 2008;96(3) [Google Scholar]
- 20.Kim S., Chen Y-S., Luke G.P., Emelianov S.Y. In vivo three-dimensional spectroscopic photoacoustic imaging for monitoring nanoparticle delivery. Biomedical Optics Express. 2011;2(9):2540–2550. doi: 10.1364/BOE.2.002540. [DOI] [PMC free article] [PubMed] [Google Scholar]
- 21.Levi J., Kothapalli S.R., Ma T-J., Hartman K., Khuri-Yakub B.T., Gambhir S.S. Design, synthesis, and imaging of an activatable photoacoustic probe. Journal of the American Chemical Society. 2010;132(32):11264–11269. doi: 10.1021/ja104000a. [DOI] [PMC free article] [PubMed] [Google Scholar]
- 22.Razansky D., Harlaar N., Hillebrands J., Taruttis A., Herzog E., Zeebregts C. Multispectral optoacoustic tomography of matrix metalloproteinase activity in vulnerable human carotid plaques. Molecular Imaging and Biology. 2011:1–9. doi: 10.1007/s11307-011-0502-6. [DOI] [PMC free article] [PubMed] [Google Scholar]
- 23.Wang L.V. In: Photoacoustic imaging and spectroscopy. 1st ed. Lihong V.W., editor. CRC Press; Boca Raton, Florida, USA: 2009. [Google Scholar]
- 24.Xu M., Lihong V.W. Photoacoustic imaging in biomedicine. Review of Scientific Instruments. 2006;77(4):041101. [Google Scholar]
- 25.Penrose R., Todd J.A. On best approximate solutions of linear matrix equations. Mathematical Proceedings of the Cambridge Philosophical Society. 1956;52(01):17–19. [Google Scholar]
- 26.Keshava N., Mustard J.F. Spectral unmixing. IEEE Signal Processing Magazine. 2002;19(1):44–57. [Google Scholar]
- 27.Guo Z., Xu Z., Wang L.V. Dependence of photoacoustic speckles on boundary roughness. Journal of Biomedical Optics. 2012;17(4):0460091–460096. doi: 10.1117/1.JBO.17.4.046009. [DOI] [PMC free article] [PubMed] [Google Scholar]
- 28.Holzer W., Mauerer M., Penzkofer A., Szeimies R.M., Abels C., Landthaler M. Photostability and thermal stability of indocyanine green. Journal of Photochemistry and Photobiology B: Biology. 1998;47(2/3):155–164. doi: 10.1016/s1011-1344(98)00216-4. [DOI] [PubMed] [Google Scholar]
- 29.Bayer C.L., Nam S.Y., Chen Y.-S., Emelianov S.Y. Photoacoustic signal amplification through plasmonic nanoparticle aggregation. Journal of Biomedical Optics. 2013;18(1):016001-. doi: 10.1117/1.JBO.18.1.016001. [DOI] [PMC free article] [PubMed] [Google Scholar]
- 30.Nam S.Y., Ricles L.M., Suggs L.J., Emelianov S.Y. Nonlinear photoacoustic signal increase from endocytosis of gold nanoparticles. Optics Letters. 2012;37(22):4708–4710. doi: 10.1364/ol.37.004708. [DOI] [PMC free article] [PubMed] [Google Scholar]
- 31.Danielli A., Maslov K., Xia J., Wang L.V., editors. Proc of SPIE. 2012. Wide range quantitative photoacoustic spectroscopy to measure non-linear optical absorption of hemoglobin. [Google Scholar]
- 32.Cox B., Laufer J.G., Arridge S.R., Beard P.C. Quantitative spectroscopic photoacoustic imaging: a review. Journal of Biomedical Optics. 2012;17(6):061202. doi: 10.1117/1.JBO.17.6.061202. [DOI] [PubMed] [Google Scholar]
- 33.Jain P.K., Lee K.S., El-Sayed I.H., El-Sayed M.A. Calculated absorption and scattering properties of gold nanoparticles of different size, shape, and composition: applications in biological imaging and biomedicine. The Journal of Physical Chemistry B. 2006;110(14):7238–7248. doi: 10.1021/jp057170o. [DOI] [PubMed] [Google Scholar]
- 34.Homan K., Kim S., Chen Y.S., Wang B., Mallidi S., Emelianov S. Prospects of molecular photoacoustic imaging at 1064 nm wavelength. Optics Letters. 2010;35(15):2663–2665. doi: 10.1364/OL.35.002663. [DOI] [PMC free article] [PubMed] [Google Scholar]
- 35.Zerda Adl Liu Z., Bodapati S., Teed R., Vaithilingam S., Khuri-Yakub B.T. Ultrahigh sensitivity carbon nanotube agents for photoacoustic molecular imaging in living mice. Nano Letters. 2010;10(6):2168–2172. doi: 10.1021/nl100890d. [DOI] [PMC free article] [PubMed] [Google Scholar]
- 36.Soliman H., Gunasekara A., Rycroft M., Zubovits J., Dent R., Spayne J. Functional imaging using diffuse optical spectroscopy of neoadjuvant chemotherapy response in women with locally advanced breast cancer. Clinical Cancer Research. 2010;16(9):2605–2614. doi: 10.1158/1078-0432.CCR-09-1510. [DOI] [PubMed] [Google Scholar]
- 37.Mansfield J.R., Gossage K.W., Hoyt C.C., Levenson R.M. Autofluorescence removal, multiplexing, and automated analysis methods for in-vivo fluorescence imaging. Journal of Biomedical Optics. 2005;10(4):041207–041209. doi: 10.1117/1.2032458. [DOI] [PubMed] [Google Scholar]