

Abstract
The metabolites of AA produced from the cyclooxygenase (COX) pathway, collectively termed as prostanoids, and from the CYP 450 pathway, eicosanoids, have been implicated in various neurodegenerative and neuroinflammatory diseases. This study developed a quantitative UPLC-MS/MS method to simultaneously measure 11 prostanoids including prostaglandins and cyclopentenone metabolites in the rat brain cortical tissue. Linear calibration curves ranging from 0.104 to 33.3 ng/ml were validated. The inter-day and intra-day variance for all metabolites was less than 15%. The extraction recovery efficiency and matrix (deionized water) effects measured at 12.5 ng/ml (750 pg on column) ranged from 88 to 100% and 3 to 14%, respectively, with % CV values below 20%. Additionally, applying the processing and extraction conditions of this method to our previous CYP450 eicosanoids method resulted in overall improvement in extraction recovery and reduction in matrix effects at low (0.417 ng/ml) and high (8.33 ng/ml) concentrations. In rat brain cortical tissue samples, concentrations of prostanoids ranged from 10.2 to 937 pmol/g wet tissue and concentration of eicosanoids ranged from 2.23 to 793 pmol/g wet tissue. These data demonstrate that the successive measurement of prostanoids and eicosanoids from a single extracted sample of rat brain tissue can be achieved with a UPLC-MS/MS system and that this method is necessary for evaluation of these metabolites as potential biomarkers in delineating their role in various neuroinflammatory and cerebrovascular disorders.
Keywords: arachidonic acid, cyclooxygenase, eicosanoids, ischemic stroke, prostanoids, UPLC-MS/MS
1. Introduction
Prostanoids are the cyclic lipid mediators produced from the cyclooxygenation of arachidonic acid (AA), a rate limiting step catalyzed by cyclooxygenases (COX) [1]. COX family consists of a constitutive (COX-1) and an inducible (COX-2) isoform which converts AA to prostaglandin endoperoxides (PGG2 and PGH2). PGH2 is further metabolized by different synthases to form biologically active prostanoids such as prostaglandin E2 (PGE2), prostaglandin F2α (PGF2α, prostaglandin D2 (PGD2), prostacyclin (PGI2), and thromboxane A2 (TXA2) (Figure 1). These prostanoids bind to classes of G protein coupled receptors (GPCR) designated EP, FP, DP, IP, and TP receptors respectively that have various effects on cAMP and intracellular Ca2+ mobilization.
Figure 1.
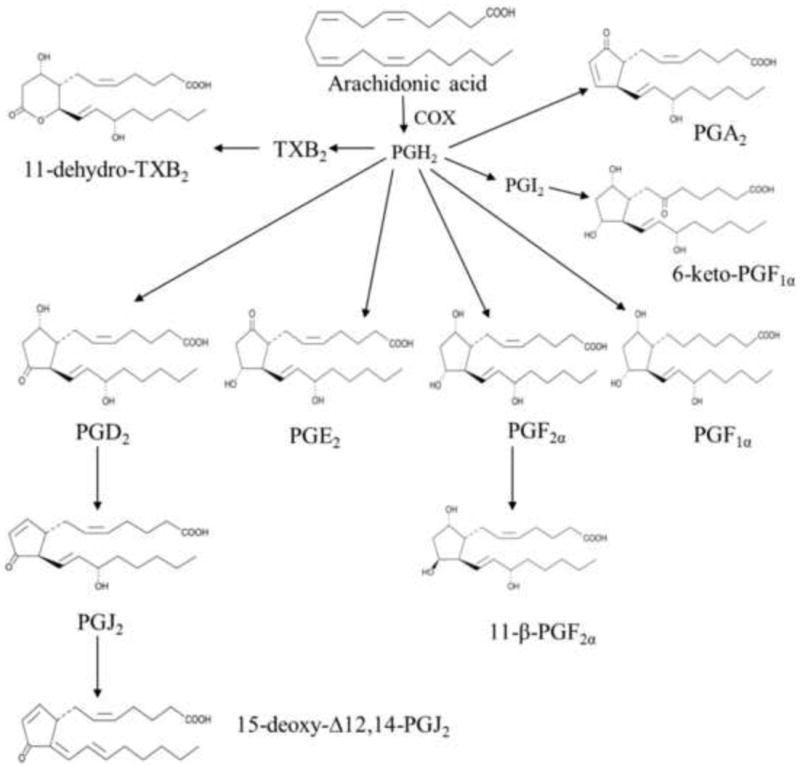
Chemical structures of prostanoid metabolites.
In the central nervous system (CNS) these prostanoids have been implicated in various inflammatory and degenerative disorders [2]. Prostanoid receptor signaling may elicit divergent pharmacological or pathological effects on tissue/cell viability depending on the type of injury. Previous studies showed that PGE2 was neuroprotective in in vitro neuronal cultures [3, 4] and in in vivo animal models of focal ischemia [5, 6], conversely, PGE2 was also shown to promote an inflammatory and neurotoxic effect in the lipopolysaccharide (LPS) model [7]. Patients with probable Alzheimer Disease (AD) have higher cerebrospinal fluid (CSF) concentrations of PGE2 than age-matched control subjects [8]. Similarly, Parkinson’s disease (PD) patients also have elevated PGE2 concentrations in CSF [9]. In addition, PGD2 has been shown to be important in neuroinflammatory and neurodegenerative conditions [10]. PGD2 synthase (PGDS) expression is localized in microglial cells surrounding senile plaques and DP1 receptor (PGD2 receptor) expression was observed in microglial cells and astrocytes within senile plaques in human AD brains [11, 12]. 15d-PGJ2 and PGJ2, non-enzymatic cyclopentenone metabolites of PGD2, are increased in the rat brain after cerebral ischemia [13, 14]. 15d-PGJ2, a cyclopentenone metabolite of PGD2, mediates its effects through peroxisome proliferator-activated receptors (PPAR γ). This prostanoid has been shown to exert neuroprotective effects in in vitro cell cultures by reducing microglial production of NO, IL-6, and TNF-α induced by Aβ40 [15]. PGF2α has been shown to exacerbate hypoxic injury in rat primary neuronal culture [16] as well as in in vivo models of ischemia with a FP agonist [17]. A prostacyclin receptor ligand has shown neuroprotective effects in a MCAO model [18] and also in neuronal cultures by reducing expression of different inflammatory mediators such as TNF-α [19]. In addition to their role in neuroinflammation, prostanoids such as prostacyclin (PGI2) and PGE2 also alter vascular smooth muscle tone [20-22]. Specifically, prostacyclin (PGI2) and TXA2 are potent vasodilators and vasoconstrictors of cerebrovasculature, respectively [23]. Collectively, these studies suggest that prostanoids produce a plethora of effects on CNS and are important mediators in the pathogenesis of neurodegenerative and neuroinflammatory diseases.
The wide array of actions that prostanoids exert in CNS differentially affects the progression of inflammation and neuronal survival. In the past, various studies have evaluated COX inhibitors as a potential therapeutic intervention to treat various neurodegenerative and neuroinflammatory diseases. However, these inhibitors, while decreasing COX generated prostanoids in general, also lead to increase in the formation of other metabolites of AA produced from LOX and CYP450 pathways, known as shunting. Therefore, there is a need to analytically evaluate all prostanoids and other AA metabolites to evaluate the total sum effect of interventions aimed at altering arachidonic acid metabolism. Multiple methods have been developed for the detection and quantitation of prostanoid metabolites. Radio-immuno assays [24], enzyme linked immunoassays [25], HPLC methods [26-29], and gas chromatography-mass spectrometry methods [30, 31] have been developed in the past for the quantitative analysis of these metabolites from many different matrices. Though these assays are useful, limitations of these methods include inadequate sensitivity, limited selectivity, narrow range of metabolites, and cross-reactivity. A significant issue in analysis of similar isomeric metabolites from complex biological matrices is the specificity. High performance liquid chromatography with tandem mass spectrometry (HPLC-MS/MS) methods have been successfully applied to quantify these metabolites from different matrices including cell cultures [32, 33], biological fluids [34-38] and tissues [39] but flow rate limitation common in HPLC systems has resulted in longer run times making most of these methods time-consuming and expensive. The shortest run time reported by these methods containing at least five different prostanoids is 25 min. A more efficient method would be the use of ultra-performance liquid chromatography (UPLC) which offers greater separation efficiency, higher sensitivity, and shorter run times.
Therefore, it was the purpose of this study to develop and validate a sensitive, accurate, and rapid high throughput UPLC-MS/MS method to simultaneously measure 11 prostanoid metabolites in rat brain tissue. In addition, we investigated the effects of the matrix on the reproducibility and reliability of the data as recommended by the Food and Drug Administrative (FDA) Quantitative Bioanalytical Methods Validation Report and other validation guidance documents [40, 41]. Furthermore, we applied the sample processing method employed in the prostanoid method development to our previously published eicosanoid method [42], instead of including all prostanoids and eicosanoids in one single run, thereby compromising on sensitivity and analysis time, in order to measure them all from a single extracted sample of rat brain tissue. Therefore, development of this method is necessary for evaluation of these metabolites as potential quantitative biomarkers in order to elucidate their role in modulation of neuroinflammatory, neurodegenerative as well as vascular disorders.
2. Materials and Methods
2.1 Chemicals and reagents
Stock standards of 6-keto-prostglandin F1α (6-keto-PGF1α), 6-keto-prostaglandin F1α-d4 (6-keto-PGF1α-d4), 11β-prostaglandin F2α (11β-prostaglandin F2α), 11β-prostaglandin F2α-d4 (11β-prostaglandin F2α-d4), prostaglandin F1α (PGF1α), prostaglandin F1α-d9 (PGF1α-d9), prostaglandin F2α (PGF2α), prostaglandin F2α-d4 (PGF2α-d4), prostaglandin E2 (PGE2), prostaglandin E2-d4 (PGE2-d4), 11-dehydro-Thromboxane B2 (11-d-TXB2), 11-dehydro-Thromboxane B2-d4 (11-d-TXB2-d4), prostaglandin D2 (PGD2), prostaglandin D2-d4 (PGD2-d4), prostaglandin A2 (PGA2), prostaglandin J2 (PGJ2), 15-deoxy-Δ12, 14-prostaglandin D2 (15-d-PGD2), 15-deoxy-Δ12, 14-prostaglandin J2 (15-d-PGJ2), 15-deoxy-Δ12, 14-prostaglandin J2-d4 (15-d-PGJ2-d4) were purchased from Cayman Chemical Company (Ann Arbor, MI). High purity organic solvents were purchased from VWR (West Chester, PA) and all other chemicals were purchased from Sigma-Aldrich (St. Louis, MO).
2.2 Animals
Male postnatal day (PND) 16 to 18 Sprague-Dawley rats (between 30 to 45 g) were maintained on a 12-h light/dark cycle. Rats were initially subjected to anesthesia with the use of a spontaneous inhalational anesthesia system [Surgivet (Smiths Medical, Waukesha, WI) V7216 Isotec 4] containing 3% isoflurane / 50% N2O & oxygen until unconscious and then the trachea was intubated with an 18-gauge angiocatheter and mechanical ventilation was initiated. Anesthesia was reduced to 2.5% isoflurane/50% N2O & oxygen and femoral arterial and venous catheters were placed. Isoflurane was discontinued and intravenous analgesia was initiated using fentanyl infusion at 50 μg/kg/h and neuromuscular blockade was obtained using vecuronium infusion at 5 mg/kg/h. Asphyxial cardiac arrest was induced by disconnecting the tracheal tube from the ventilator for 12 min. Resuscitation was initiated by reconnecting the ventilator, infusion of epinephrine 0.005 mg/kg and sodium bicarbonate 1 mEq/kg i.v., and manual chest compressions until return of spontaneous circulation (ROSC). Anesthesia and neuromuscular blockade were restarted at 30 min after ROSC. Animals were sacrificed by decapitation at 5 and 120 min after ROSC and brain cortical tissue was rapidly excised, snap frozen in liquid nitrogen and stored at -80 °C. All animal procedures were approved by the University of Pittsburgh Institutional Animal Care and Use Committee.
2.3 Liquid Chromatography and mass spectrometry
Liquid chromatography was performed using an Acquity ultra performance LC autosampler (Waters, Milford, MA). Analytes were separated on a UPLC BEH C-18, 1.7 μm (2.1 × 150 mm) reverse-phase column (Waters, Milford, MA) protected by a guard column (2.1 mm × 5 mm; Waters, Milford, MA) of the same packing material. Column temperature was maintained at 55 °C. Mobile phases, delivered at a flow rate of 0.4 ml/min, consisted of 0.005% acetic acid, 5% acetonitrile in deionized water (A) and 0.005% acetic acid in acetonitrile (B) at an initial mixture of 65:35 A and B, respectively. Mobile phase B was maintained at 35% for 7.5 min and then increased to 98% in a linear gradient over 1.5 min, where it remained for 0.2 min. This was followed by a linear return to initial conditions over 0.1 min with a 2.7 min pre-equilibration period prior to the next sample run. Total run time per sample was 12 min and all injection volumes were 7.5 μl.
Mass spectrometric analysis of analyte formation was performed using a TSQ Quantum Ultra (Thermo Fisher Scientific, San Jose, CA) triple quadrupole mass spectrometer coupled with heated electrospray ionization source (HESI) operated in negative selective reaction monitoring (SRM) mode with unit resolutions at both Q1 and Q3 set at 0.70 full width at half maximum. Quantitation by SRM analysis on all prostanoid metabolites was performed by monitoring their respective m/z transitions. The SRM conditions for these analytes and their retention times are shown in Table 1. Parameters were optimized to obtain the highest [M-H]- ion abundance and were as follows: capillary temperature, 373 °C, vaporizer temperature, 340 °C, spray voltage, 3500 kV, and a source collision-induced dissociation set at 0 V. Sheath gas, auxiliary gas, and ion sweep gas pressures were set at 60, 45, and 0, respectively. Scan time was set at 0.01 s and collision gas pressure was set at 1.5 mTorr. Analytical data was acquired and analyzed using Xcalibur software version 2.0.6 (Thermo Finnigan, San Jose, CA).
Table 1.
SRM conditions for the prostanoid metabolites and the deuterated internal standards in negative electrospray ionization mode.
| Analyte | Precursor → Product (m/z) | Collision Energy | Retention time (min) |
|---|---|---|---|
| 6-keto-PGF1α | 369.3 → 245.1 | 28 | 1.61 |
| 6-keto-PGF1α-d4 | 373.2 →249.2 | 25 | 1.60 |
| 11b-PGF2α | 353.1 → 193.1 | 26 | 2.30 |
| 11b-PGF2α-d4 | 357 → 197 | 27 | 2.29 |
| PGF1α | 355.1 → 311.1 | 23 | 2.63 |
| PGF1α-d9 | 364 → 320.1 | 25 | 2.62 |
| PGF2α | 352.9 → 309.1 | 23 | 2.68 |
| PGF2α-d4 | 357 → 313.1 | 23 | 2.66 |
| PGE2 | 351.1 → 271.1 | 20 | 2.90 |
| PGE2-d4 | 355.1 → 275.1 | 19 | 2.88 |
| 11-dehydro-TXB2 | 367 → 305.1 | 22 | 3.00 |
| 11-dehydro-TXB2-d4 | 371 → 309.1 | 20 | 2.98 |
| PGD2 | 351.1 → 271.1 | 20 | 3.30 |
| PGD2-d4 | 355.1 → 275.1 | 17 | 3.29 |
| PGA2 | 333 → 271.2 | 19 | 6.00 |
| PGJ2 | 333 → 271.2 | 19 | 6.42 |
| 15-deoxy-Δ12,14-PGD2 | 333 → 271.2 | 19 | 9.32 |
| 15-deoxy-Δ12,14-PGJ2 | 316 → 272 | 17 | 9.64 |
| 15-deoxy-Δ12,14-PGJ2-d4 | 320 → 276 | 17 | 9.63 |
2.4 Preparation of calibration standards and quality control samples
A stock solution of metabolites was prepared in 80:20 methanol:water to achieve a series of working solutions at 1 μg/ml, 100 ng/ml and 25 ng/ml concentrations. A solution of internal standard (IS) consisting of PGD2-d4, 15-d-PGJ2-d4, 6-keto-PGF1-d4, 11β-PGF2-d4, PGF1-d9, 11-d-TxB2-d4, PGE2-d4, PGF2-d4 was prepared in 80:20 methanol:water at a concentration of 1 μg/ml. Calibration standards and quality control (QC) samples were prepared from separate stock solutions by spiking appropriate amounts of the working solutions into deionized water. Calibration standards were prepared at 0.104, 0.208, 0.417, 0.833, 1.25, 1.67, 4.17, 8.33, 12.5, 16.67, and 33.33 ng/ml (6.25, 12.5, 25, 50, 75, 100, 250, 500, 750, 1000, and 2000 pg on column, respectively). QCs were prepared at 0.667, 7.50, and 20.83 ng/ml (40, 450 and 1250 pg on column, respectively).
2.5 Sample Analysis
2.5.1 Cortical tissue extraction
Tissue samples were homogenized in deionized water containing 0.113 mM butylated hydroxytoluene (BHT) and centrifuged for 30 min at 10,000 rpm. The supernatant was removed for analysis. The metabolite concentrations in the tissue samples as well as in the calibration and quality control standards were all determined using a solid phase extraction (SPE) procedure. Standards and tissue supernatants were spiked with 12.5 μL (containing 12.5 ng) of internal standard (IS) solution consisting of PGD2-d4, 15-d-PGJ2-d4, 6-keto-PGF1-d4, 11β-PGF2-d4, PGF1-d9, 11-d-TxB2-d4, PGE2-d4, PGF2-d4. The spiked samples were loaded onto Oasis hydrophilic-lipophilic balanced (HLB) (30 mg) SPE cartridges (Waters, Milford, MA) that were conditioned and equilibrated with 1 ml of methanol and 1 ml of water, respectively. Columns were washed with three 1 ml volumes of 5% methanol and were eluted with 100% methanol. Extracts were spiked with 15 μL of 1% acetic acid in methanol, dried under nitrogen gas at 37°C and reconstituted in 125 μl of 80:20 methanol: water for further chromatographic analysis.
2.6 Method validation
Validation of the SPE assay was performed by using 11 standard concentrations of all prostanoid metabolites prepared in a 2 ml volume of the same deionized water used for sample dilution, and extracted via SPE using above method. The amount of metabolites in the standards ranged from 0.104 to 33.3 ng/ml (6.25 – 2000 pg on column). Four separate duplicate standard curves were prepared and analyzed over four consecutive days. Curves were calculated based on the peak area ratios between each metabolite to the IS and plotted against the amount of the metabolite injected onto the column.
2.6.1 Precision and accuracy
Precision and accuracy of the method was determined by the analysis of QC samples. Metabolites were spiked into deionized water to yield low, medium, and high QCs, corresponding to 0.667, 7.50, 20.83 ng/ml (40, 450, 1250 pg on column), respectively. Five samples at each level were analyzed for two days, followed by 10 replicates of each on the final day of validation. The lower limit of detection (LLOD) was determined by the minimum value with a signal-to-noise (S/N) ratio of ≥ 3:1. The lower limit of quantitation (LLOQ) was determined by the minimum value with accuracy and precision within ±15% deviation of the nominal value. Accuracy was determined as the relative deviation in the calculated value (E) of a standard from that of its true value (T) expressed as a percentage. This accuracy, or relative standard error (RE %), was calculated using the equation RE%=(E−T)/T×100. Precision was evaluated and expressed as relative standard deviation (RSD %) of the mean concentrations using the equation RSD% = SD/M×100. The criteria for acceptability of data included accuracy and precision within ±15% deviation of the nominal value.
2.7 Analyte recovery determination
The extraction recovery (E.R.) efficiencies of the deuterated metabolites in deionized water were determined at 12.5 ng/ml (750 pg on column; n=6) by comparing the responses (area) of samples spiked before extraction to those spiked after extraction. The recovery samples were processed using SPE and concentrations of metabolites were determined by UPLC–MS/MS as described in section 2.3.
2.8 Evaluation of matrix effects on prostanoids and eicosanoids
Matrix effects (M.E) were evaluated using 2 ml volume of the same deionized water (matrix) spiked with 0.113mM BHT used for processing rat cortical tissue samples. The matrix was extracted via SPE using the method described above and the eluent was spiked with deuterated standards of prostanoids (PGD2-d4, 15-d-PGJ2-d4, 6-keto-PGF1-d4, 11β-PGF2-d4, PGF1-d9, 11-d-TxB2-d4, PGE2-d4, PGF2-d4) at 12.5 ng/ml. Similarly, the matrix effects on eicosanoids (HETEs, EETs, and DiHETEs) were measured by applying the current processing conditions to previously published CYP450 eicosanoids method [42]. The matrix was extracted via SPE and eluent was spiked with low and high concentrations of eicosanoids (12-, 15-, and 20-HETE; 8,9-, 11,12-, and 14,15-EET; 5,6-, 8,9-, 11,12-, and 14,15-DiHETE) at 0.417 and 8.33 ng/ml, respectively and 20-HETE-d6 internal standard at 12.5 ng/ml. Neat samples containing the same concentration of deuterated prostanoid metabolites, eicosanoids and 20-HETE-d6 were prepared in 80:20 methanol:water. Samples were analyzed using UPLC–MS/MS as described above. The ME for each prostanoid metabolite was calculated based on the area of the post-extraction spiked samples to the neat samples. The ME for each eicosanoid metabolite was calculated based on the area ratio (analyte/internal standard) of the post-extraction spiked samples to the neat samples. The ME values are expressed as average ± standard deviation with coefficient of variation (CV) (n=6). Values less than 1.00 indicate ion suppression and values greater than 1.00 indicate ion enhancement.
2.9 Statistical analysis
Statistical analysis was completed using GraphPad Prism software, version 5.0 (GraphPad Software, La Jolla, CA). In the matrix effect studies, IS-normalized matrix effect (ME) values for eicosanoids in buffer and deionized water were compared using unpaired t-test and a p < 0.05 was considered significant.
3. Results
3.1 Development of UPLC-MS/MS Method
Acetonitrile and water mobile phases with acetic acid produced optimal chromatographic conditions and sensitivity for prostanoids detection. Addition of 15 μL of 1% (v/v) acetic acid in methanol to the eluent before the evaporation and reconstitution step increased sensitivity with a 2- fold increase in peak area (data not shown). Under these experimental conditions, the representative chromatograms of a calibration standard at 0.417 ng/ml (25 pg on column) of prostanoids are depicted in Figure 2. The elution sequence was identified as 6-keto-PGF1α, 11β-PGF2α, PGF1α, PGF2α, PGE2, 11-d-TXB2, PGD2, PGA2, PGJ2, 15-d-PGD2, and 15-d-PGJ2 as determined by comparison to injections of individual compounds and product fragments.
Figure 2.
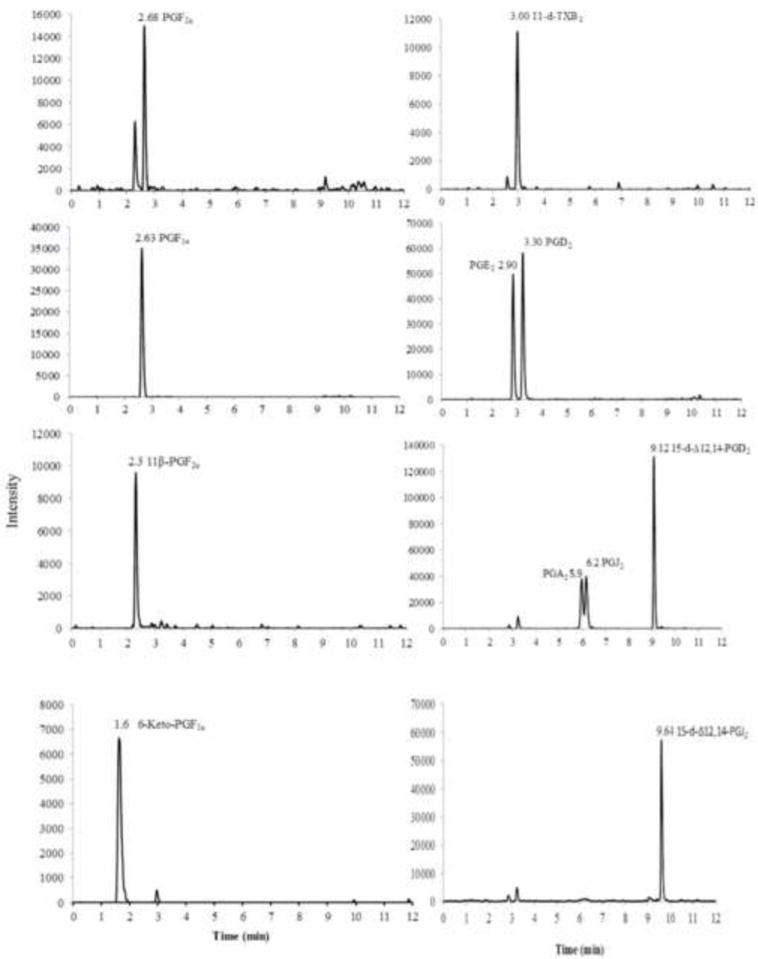
Chromatographic profiles, corresponding to 25 pg on column, depicting the separation of all prostanoids using a UPLC tandem MS/MS triple quadrupole mass spectrometer. Separation of metabolites was performed on a reversed-phase Acquity BEH C-18 column (2.1 × 150 mm; 1.7 μm i.d.). Metabolites were eluted at a flow rate of 0.4 ml/min over 12 min run time with a gradient from 35% acetonitrile containing 0.005% acetic acid to 98% acetonitrile containing 0.005% acetic acid.
3.2 Linearity, accuracy and precision
Eleven calibration standards over a range of 0.104–33.3 ng/ml (6.25 – 2000 pg on column) were used to construct the curves for all metabolites except for 6-keto-PGF1α, PGF2α and 11-d-TXB2 which ranged from 0.208 – 33.3 ng/ml. The weighting factor 1/Y typically provided the best fit of the plot as determined by visual inspection, correlation coefficient, and analysis of the residuals. All of the calibration standards fell within 15% deviation of back-calculated amounts from nominal spiked amounts for all levels and the correlation coefficients (R2) were > 0.99 for each metabolite. The intraand inter-day accuracy and precision for the assay were evaluated at three levels: 0.667, 7.50, and 20.83 ng/ml (40, 450 and 1250 pg on column, respectively), using the QC samples within the three validation runs. Ten replicates at each concentration within a single day of validation were used to determine the intra-day reproducibility. Inter-day reproducibility was determined over three separate days using n=5 at these concentrations. Calculated values of the QCs were generated using the equation of linear regression obtained from the calibration curves run within the same sequence. Results were evaluated and are presented in Table 2. The %RSD for all metabolites fell within 15% indicating good reproducibility of the assay. The LLOQ was determined to be 0.104 ng/ml for all metabolites evaluated except for 6-keto-PGF1α, PGF2α and 11-d-TXB2 which was 0.208 ng/ml.
Table 2.
Accuracy and precision of assay, represented by quality controls, for 11 prostanoid metabolites extracted in deionized water. Intra-assay relative standard deviation (RSD) ranged from 1.45 to 11.9% and inter-day RSD ranged from 1.76 to 14.1%.
| Analyte | Spiked amount (pg on column) | Intra-assay concentration (mean±s.d) (pg on column) | RE% | RSD% | Inter-assay concentration (mean±s.d) (pg on column) | RE% | RSD% |
|---|---|---|---|---|---|---|---|
| 6-keto-PGF1α | 40 | 38.7 ± 2.26 | -3.01 | 5.82 | 40.7 ± 3.53 | 1.86 | 8.67 |
| 450 | 437 ± 16.7 | -2.83 | 3.82 | 449 ± 25.5 | -0.21 | 5.69 | |
| 1250 | 1209 ± 34.2 | -3.25 | 2.83 | 1241 ± 63.1 | -0.72 | 5.08 | |
| 11β-PGF2α | 40 | 41.2 ± 2.91 | 3.00 | 7.06 | 40.9 ± 4.01 | 2.43 | 9.78 |
| 450 | 435 ± 21.4 | -3.12 | 4.91 | 437 ± 15.7 | -2.80 | 3.58 | |
| 1250 | 1201 ± 52 | -3.88 | 4.33 | 1228 ± 57 | -1.71 | 4.64 | |
| PGF1α | 40 | 37.7 ± 3.23 | -5.72 | 8.56 | 39.5 ± 3.50 | -1.28 | 8.86 |
| 450 | 430 ± 15.3 | -4.39 | 3.49 | 438 ± 11.1 | -2.56 | 2.54 | |
| 1250 | 1216 ± 58.4 | -2.68 | 4.80 | 1228 ± 64.5 | -1.69 | 5.25 | |
| PGF2α | 40 | 38.9 ± 4.65 | -2.55 | 11.9 | 38.3 ±5.41 | -4.25 | 14.1 |
| 450 | 467 ± 47.7 | 3.90 | 10.2 | 455 ± 25.7 | 1.15 | 5.65 | |
| 1250 | 1249 ± 131 | -0.06 | 10.5 | 1221 ± 67 | -2.27 | 5.49 | |
| PGE2 | 40 | 39.6 ± 1.58 | -1.00 | 3.99 | 38.9 ± 1.24 | -2.71 | 3.19 |
| 450 | 413 ± 17.7 | -8.11 | 4.29 | 439 ± 16.8 | -2.23 | 3.83 | |
| 1250 | 1175 ± 44.8 | -5.99 | 3.81 | 1209 ± 52 | -3.26 | 4.30 | |
| 11-dehydro-TXB2 | 40 | 35.0 ± 1.88 | -12.4 | 5.38 | 38.8 ± 4.05 | -2.84 | 10.4 |
| 450 | 407 ± 26.5 | -9.41 | 6.50 | 446 ± 31.4 | -0.88 | 7.04 | |
| 1250 | 1314 ± 61.2 | 5.14 | 4.66 | 1363 ± 77.8 | 9.05 | 5.71 | |
| PGD2 | 40 | 39.7 ± 3.12 | -0.74 | 7.85 | 39.9 ± 1.89 | -0.02 | 4.71 |
| 450 | 412 ± 5.97 | -8.24 | 1.45 | 436 ± 17.8 | -3.03 | 4.09 | |
| 1250 | 1206 ± 49.2 | -3.46 | 4.08 | 1238 ± 21.7 | -0.91 | 1.76 | |
| PGA2 | 40 | 37.6 ± 2.94 | -5.83 | 7.80 | 39.0 ± 2.67 | -2.36 | 6.83 |
| 450 | 409 ± 22.6 | -9.03 | 5.53 | 434 ± 30.7 | -3.54 | 7.08 | |
| 1250 | 1192 ± 112 | -4.57 | 9.41 | 1228 ± 69.6 | -1.71 | 5.67 | |
| PGJ2 | 40 | 41.1 ± 2.72 | 2.87 | 6.60 | 39.5 ± 2.09 | -1.18 | 5.28 |
| 450 | 455 ± 11.2 | 1.25 | 2.46 | 443 ± 24.7 | -1.38 | 5.57 | |
| 1250 | 1267 ± 47.6 | 1.37 | 3.76 | 1237 ± 56.7 | -1.01 | 4.59 | |
| 15-deoxy-PGD2 | 40 | 38.1 ± 4.11 | -4.58 | 10.7 | 39.8 ± 2.50 | -0.40 | 6.26 |
| 450 | 430 ± 35.5 | -4.22 | 8.24 | 442 ± 28.6 | -1.72 | 6.47 | |
| 1250 | 1206 ± 113 | -3.44 | 9.44 | 1249 ± 76.1 | -0.02 | 6.09 | |
| 15-deoxy-PGJ2 | 40 | 42.0 ± 3.54 | 5.18 | 8.41 | 41.6 ± 2.96 | 4.11 | 7.10 |
| 450 | 443 ± 17.9 | -1.54 | 4.05 | 449 ± 13.9 | -0.08 | 3.10 | |
| 1250 | 1216 ± 95.6 | -2.72 | 7.86 | 1253 ± 40.6 | 0.27 | 3.25 |
3.3 Recovery of analytes
The extraction recovery efficiencies for all deuterated prostanoid metabolites were determined at one level, 12.5 ng/ml (750 pg on column) (Table 3). The recovery ranged from 88.1 to 100.3%, with the 11β-PGF2α having the lowest recovery. Similarly the extraction procedure of this method was applied to our previous CYP450 eicosanoids. The recovery values for eicosanoids from phosphate buffer at low (0.417 ng/ml) and high (8.33 ng/ml) concentrations ranged from 85.2 to 117% and 97.1 to 108%, respectively. Under new processing conditions E.R values from deionized water ranged from 92.0 to 111% and 98.1 to 112% at low and high concentrations respectively (Table 5). The recovery efficiency for all metabolites showed good reproducibility with an %RSD below 20.
Table 3.
Extraction recovery (E.R) efficiency of deuterated prostanoid metabolites were measured at 12.5 ng/ml (750 pg on column) in deionized water. Recovery efficiencies ranged from 88 to 100% for all metabolites with relative standard deviations below 18%.
| Analyte | Extraction Efficiency (%) | RSD (%) |
|---|---|---|
| 6-keto-PGF1α-d4 | 96.9 | 15.6 |
| 11β-PGF2α-d4 | 88.1 | 15.5 |
| PGF1α-d9 | 100.3 | 13.5 |
| PGF2α-d4 | 93.7 | 14.9 |
| PGE2-d4 | 91.6 | 16.3 |
| 11-dehydro-TXB2-d4 | 89.8 | 18.0 |
| PGD2-d4 | 89.5 | 14.6 |
| 15-deoxy-Δ12,14-PGJ2-d4 | 91.4 | 12.2 |
Table 5.
Assessment of effects of deionized water on the extraction efficiency of eicosanoids and on the reproducibility of the assay. Data are represented as the average extraction recovery (E.R) values for deionized water. Similarly matrix effect (M.E) of deionized water on eicosanoids was also measured. Data are represented as the average IS-normalized ME values and the CV for deionized water spiked with low and high concentrations of each eicosanoid at 0.417 ng/ml (25 pg on column) and 8.33 ng/ml (500 pg on column). IS-normalized M.E values in deionized water were compared to buffer. Results indicate overall improvement in extraction recovery of eicosanoids and reduction in matrix effects when deionized water was used as compared to microsomal incubation buffer.
| Medium | Analyte | Amt (pg) | M.E | E.R | ||
|---|---|---|---|---|---|---|
|
| ||||||
| Mean | %C.V | Mean | %C.V | |||
| Buffer | 20-HETE | 25 | 0.94 | 11.2 | 113.5 | 18.7 |
| 12-HETE | 25 | 0.80 | 12.2 | 108.4 | 10.1 | |
| 15-HETE | 25 | 0.93 | 8.3 | 85.2 | 12.8 | |
| (n=5) | 8,9-EET | 25 | 1.09 | 13.4 | 98.3 | 16.2 |
| 11,12-EET | 25 | 0.92 | 13.8 | 104.2 | 11.6 | |
| 14,15-EET | 25 | 0.91 | 8.5 | 111.4 | 13.7 | |
| 5,6-DiHETE | 25 | 1.03 | 2.4 | 104.0 | 17.6 | |
| 8,9-DiHETE | 25 | 1.01 | 5.9 | 107.0 | 12.6 | |
| 11,12-DiHETE | 25 | 0.97 | 7.3 | 117.0 | 5.2 | |
| 14,15-DiHETE | 25 | 1.11 | 4.8 | 115.7 | 5.9 | |
| Water | 20-HETE | 25 | 1.08 | 5.6 | 104.6 | 10.7 |
| 12-HETE | 25 | 1.06 | 15.6 | 95.8 | 14.7 | |
| 15-HETE | 25 | 1.00 | 8.4 | 92.4 | 10.4 | |
| (n=5) | 8,9-EET | 25 | 1.04 | 10.8 | 104.3 | 10.0 |
| 11,12-EET | 25 | 1.03 | 16.9 | 103.3 | 15.0 | |
| 14,15-EET | 25 | 0.99 | 10.8 | 98.7 | 18.2 | |
| 5,6-DiHETE | 25 | 1.02 | 4.5 | 111.2 | 19.7 | |
| 8,9-DiHETE | 25 | 1.17 | 6.3 | 92.0 | 12.5 | |
| 11,12-DiHETE | 25 | 1.01 | 6.6 | 109.5 | 9.9 | |
| 14,15-DiHETE | 25 | 1.06 | 8.9 | 105.4 | 17.0 | |
| Buffer | 20-HETE | 500 | 1.04 | 6.0 | 99.2 | 10.6 |
| 12-HETE | 500 | 0.90 | 14.4 | 103.5 | 10.3 | |
| 15-HETE | 500 | 0.93 | 11.7 | 97.6 | 9.8 | |
| 8,9-EET | 500 | 0.97 | 16.0 | 97.1 | 12.2 | |
| (n=5) | 11,12-EET | 500 | 0.95 | 15.8 | 101.5 | 9.1 |
| 14,15-EET | 500 | 0.97 | 14.8 | 99.8 | 12.3 | |
| 5,6-DiHETE | 500 | 0.99 | 15.3 | 105.3 | 12.6 | |
| 8,9-DiHETE | 500 | 0.98 | 10.7 | 106.2 | 9.5 | |
| 11,12-DiHETE | 500 | 1.02 | 12.4 | 106.9 | 12.0 | |
| 14,15-DiHETE | 500 | 1.07 | 7.7 | 108.3 | 6.6 | |
| Water | 20-HETE | 500 | 0.95 | 7.8 | 103.2 | 5.0 |
| 12-HETE | 500 | 1.06 | 10.8 | 98.1 | 7.0 | |
| 15-HETE | 500 | 1.03 | 7.5 | 98.9 | 7.8 | |
| (n=5) | 8,9-EET | 500 | 1.05 | 6.8 | 101.1 | 6.6 |
| 11,12-EET | 500 | 1.07 | 11.2 | 101.6 | 3.5 | |
| 14,15-EET | 500 | 1.03 | 7.6 | 99.4 | 5.2 | |
| 5,6-DiHETE | 500 | 1.02 | 1.1 | 111.0 | 5.6 | |
| 8,9-DiHETE | 500 | 1.03 | 8.1 | 112.1 | 4.5 | |
| 11,12-DiHETE | 500 | 1.06 | 7.9 | 104.6 | 6.3 | |
| 14,15-DiHETE | 500 | 1.07 | 1.9 | 105.5 | 3.3 | |
3.4 Analysis of matrix effects
3.4.1 Prostanoids
The effects of the deionized water (matrix) on the reproducibility of the assay to measure metabolites were determined. Table 4 shows the coefficient of variation (CV) of the peak area of each deuterated metabolite of the post-extraction spike in deionized water along with the CV of neat samples prepared in 80:20 methanol:water (n=6). The % CV values in table 4 for all metabolites were below 16%, demonstrating good precision and reliability of the assay. Table 4 also shows the average matrix effect (M.E.) values of each metabolite as mean and CV (n=6). The average M.E. ranged from 0.862 to 0.974. A M.E. of 1 signifies no matrix effects. A M.E value less than 1 signifies ion suppression while a value greater than 1 signifies ion enhancement or analyte loss in the absence of matrix. The % CV of the M.E. values for most of the metabolites was below 15%, which demonstrates minimal effects of the deionized water (matrix) on the precision and reliability of the assay.
Table 4.
Assessment of matrix effects of the deionized water on the reproducibility of the assay. Data are represented as coefficient of variation (%CV) of the peak area of each deuterated metabolite of the post-extraction spike in deionized water along with the CV of neat samples prepared in 80:20 methanol:water (n=6). Similarly matrix effect (M.E) of deionized water on prostanoids was also measured. Data are represented as the average M.E values and the CV for deionized water spiked with deuterated metabolites at 12.5 ng/ml (n=6). Results indicate minimal effects of the deionized water on the reproducibility and reliability of the assay to measure prostanoids.
| Analyte | Precision (%CV) | Matrix Effect (M.E) | ||
|---|---|---|---|---|
|
| ||||
| Neat | Deionized Water | Mean | %CV | |
| 6-keto-PGF1α-d4 | 1.28 | 15.8 | 0.89 | 14.7 |
| 11β-PGF2α-d4 | 8.50 | 11.0 | 0.94 | 13.7 |
| PGF1α-d9 | 12.8 | 14.2 | 0.97 | 18.4 |
| PGF2α-d4 | 12.4 | 9.1 | 0.91 | 15.0 |
| PGE2-d4 | 7.03 | 11.7 | 0.94 | 12.7 |
| 11-dehydro-TXB2-d4 | 5.38 | 13.8 | 0.86 | 13.9 |
| PGD2-d4 | 8.02 | 10.9 | 0.87 | 13.0 |
| 15-deoxy-Δ12,14-PGJ2-d4 | 6.16 | 7.61 | 0.93 | 9.96 |
3.4.2 Eicosanoids
The matrix effects of the phosphate buffer and deionized water (matrix) on the eicosanoids were determined at low (0.417 ng/ml) and high (8.33 ng/ml) concentrations, respectively. Table 5 shows the average IS-normalized M.E. as mean and CV (n=5). The average IS-normalized M.E. values in buffer ranged from 0.80 to 1.11 and 0.90 to 1.07 at low and high concentrations, respectively whereas in deionized water the values ranged from 0.99 to 1.17 and 0.95 to 1.07 at low and high concentrations, respectively. The % CV of the M.E. values for all of the metabolites was below 18%, which demonstrates minimal effects of the deionized water (matrix) on the precision and reliability of the assay. Overall, matrix effect seems to be minimal on eicosanoids when deionized water was used as compared to microsomal incubation buffer.
3.5 Analysis of rat brain tissue samples
Rat brain cortex tissue samples (n=6) collected at 5 min post resuscitation were analyzed from animals subjected to 12 min of asphyxial cardiac arrest to determine prostanoid and eicosanoid metabolite concentrations using the standard calibration curves of each metabolite and results are shown in Figure 3 and 4. Quantitative amounts of all prostanoids were measured in these tissue samples and values ranged from 10.2 to 937 pmol/g wet tissue. The levels measured in the order of abundance were PGD2, PGJ2, PGE2, 15-d-PGD2, PGA2, 15-d-PGJ2, PGF2α, PGF1α, 11β-PGF2α at 937±305, 36.9±10.7, 35.5±12.3, 32.7±14.8, 24.2±11.8, 18.4±0.80, 14.4±7, 13.9±7.7, 10.2±3.2 pmol/gm wet tissue (Figure 3). Detectible amounts of 6-keto-PGF1α, and 11-d-TXB2 were also seen in these samples. Similarly, quantitative amounts of all eicosanoids measured in the same tissue sample range from 2.23 to 793 pmol/g wet tissue. The levels measured in the order of abundance were 12-HETE, 15-HETE, 14,15-EET, 8,9-EET, 11,12-EET, 20-HETE, 14,15-DiHETE, 11,12-DiHETE at 793±161, 143±50.8, 44.6±3.78, 39.4±2.63, 20.8±1.46, 6.79±2.30, 4.17±0.21, 2.23±0.16 pmol/gm wet tissue (Figure 4). Detectible amounts of 8,9- and 5,6-DiHETE were also seen in these samples. These results imply that multiple arachidonic acid metabolites (prostanoids and eicosanoids) in rat brain cortex can be quantified reliably using this method.
Figure 3.
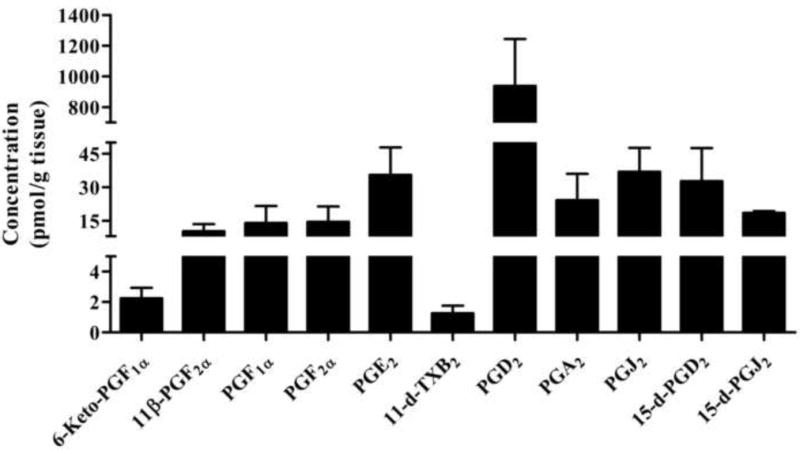
Concentrations of prostanoid metabolites detected in brain cortical tissue of pediatric rats at 5 min post resuscitation after being subjected to 12 min of asphyxial cardiac arrest. Quantitative amounts of PGD2, PGJ2, PGE2, 15-d-PGD2, PGA2, 15-d-PGJ2, PGF2α, PGF1α, 11β-PGF2α were measured in these tissue samples.
Figure 4.
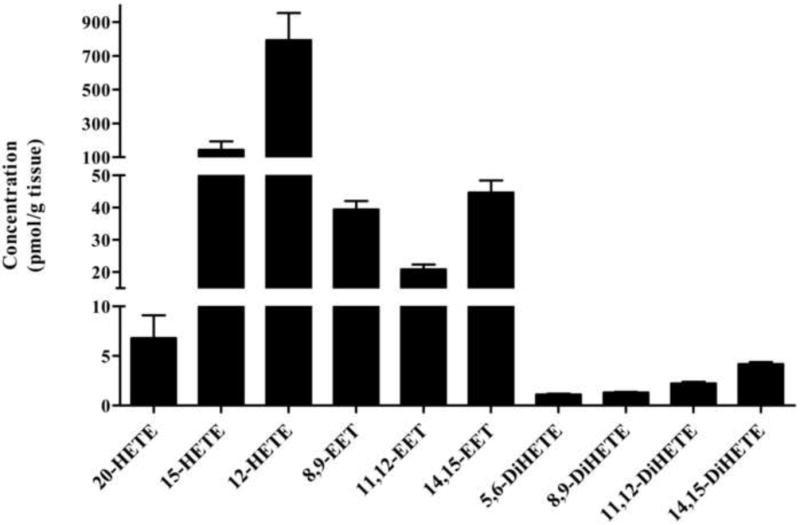
Concentrations of eicosanoid metabolites detected in brain cortical tissue of pediatric rats at 5 min post resuscitation after being subjected to 12 min of asphyxial cardiac arrest. Quantitative amounts of 12-, 15-, 20-HETE, 8,9-, 11,12-, 14,15-EET, and 11,12-, 14,15-DiHETE were measured in these tissue samples. These eicosanoids were analyzed from same tissue extracts used for prostanoids measurement.
4. Discussion
In this study we report a robust method to measure 11 prostanoid metabolites including cyclopentenone metabolites in rat brain cortical tissue. These compounds were simultaneously detected, identified and quantified using a validated UPLC-MS/MS method. Furthermore, we have successfully applied the processing conditions and extraction procedure of this method to our previously published method for eicosanoid quantification in rat brain extracts with different MS/MS conditions [42]. With this approach we achieved an overall improvement in extraction recovery of eicosanoids and reduction in matrix effects. This gave us the unique advantage of detecting and quantifying both the prostanoid and eicosanoid metabolites from the same extracted sample by two MS injections. Collectively, these results suggest that our validated UPLC-MS/MS method is an accurate and sensitive method and can be used successfully to quantify a wide range of arachidonic acid metabolites in rat brain tissue.
We have performed the validation of linear calibration curves ranging from 0.104 to 33.3 ng/ml (6.25 to 2000 pg on column) for all prostanoid metabolites except for 6-keto-PGF1α, PGF2α and 11-d-TXB2 which ranged from 0.208 to 33.3 ng/ml (12.5 to 2000 pg). The inter-day and intra-day variance was less than 15% with extraction efficiency greater than 88%. We demonstrated that matrix effect of deionized water did not significantly affect the reliability and reproducibility of the assay. In our previously validated eicosanoid method we used microsomal incubation buffer as our matrix. In this study, we used the same matrix (deionized water) for both the prostanoid and eicosanoid methods to test the extraction recovery and matrix effects at low and high concentrations for all eicosanoids. The addition of 15 μl of 1% acetic acid to the eluent before evaporation and reconstitution resulted in significant increase in extraction recovery for 15-HETE and significant reduction in matrix effect for 12-HETE at low concentrations while recovery and matrix effects largely remain unchanged at high concentrations for all eicosanoid metabolites.
Concentrations of prostanoid metabolites were measured in rat brain tissue extracts. These include PGD2, PGJ2, PGE2, 15-d-PGD2, PGA2, 15-d-PGJ2, PGF2α, PGF1α, 11β-PGF2α, 6-keto-PGF1α, and 11-d-TXB2. Several of these metabolites have been previously detected in different matrices such as cell cultures [32, 33], plasma/serum [35-37], urine [34, 39], rat kidney [43]. Masoodi et al. [39] and Yue et al. [44] reported measurements of prostanoids in rat brain or cortical tissue. Masoodi et al. measured prostanoids in uninjured rat brain whereas Yue et al. measured them in sham and traumatic brain injured rats. Yue et al. reported concentrations of only PGE2 and PGD2 from ipsi-lateral 72 h post-injured rat brains as 11.3 ± 0.61 and 4.99 ± 0.64 pmol/g tissue, respectively, and PGJ2 and PGF2α were not detected in their method. In another method, Brose SA et al, reported PGE2 and PGD2 levels as 14.4 ± 0.94 and 2.89 ± 0.17 pmol/g tissue from mice brain at 5 min after global ischemia using a single step methanol extract. Although a direct methodological comparison cannot be determined given the differences in the animal and injury model, the levels of PGE2 (35.5 ± 12.3 pmol/g tissue) measured from pediatric rat brain cortex at 5 min post resuscitation after asphyxial cardiac arrest using our method was comparable to their results. Interestingly, PGD2 levels reported by Brose SA et al, early after global ischemia was lesser than PGE2. In general, PGD2 is the most abundant prostanoid metabolite found in the brain [45]. The levels of PGD2 (937 ± 305 pmol/g tissue) we reported with our method are in agreement with the levels (964 ± 142 pmol/g tissue) reported by Aukema et al who measured endogenous prostanoids from rat kidney using methanol solid phase extraction followed by LC-MS/MS analysis [46]. We were able to detect all of the prostanoid metabolites of our assay, in the pediatric rat brain cortex post-injury indicating good specificity and sensitivity of our method. In addition, we successfully quantified CYP450 derived eicosanoids with different MS/MS conditions (as reported in our previous method) from the same tissue extracts. Together, our method is capable of measuring a total of 21 arachidonic acid metabolites including prostanoids and eicosanoids from a single extracted sample in a combined run time of 18 minutes.
The results from our method are similar to other studies that have reported the detection of similar metabolites in different matrices. Ferreiro-Vera et al. described simultaneous measurement of different inflammation biomarkers from human serum and human plasma and reported concentrations of PGF2α and PGE2 as 10.3 and 0.17 ng/ml in plasma [35] and 0.11 ng/ml for PGE2 [36] in serum which are within our standard calibration range of 0.104 - 33.3 ng/ml. LOQs reported in their method as 46, 138 and 188 pg (on column) for PGF2α, PGE2 and PGD2 were however found to be higher than our method. In addition, Unterwurzacher et al. described a method for measurement of hydroxyeicosatetraenoic acid, hydroxyoctadecadienoic acid (HODE), leukotrienes and prostanoids by HPLC-MS/MS in human plasma [38]. The LOQ from this method is reported as 0.352, 0.264, 1.42 and 1.85 ng/ml for PGD2, PGE2, PGF2α and 6-keto-PGF1α, respectively. Similarly, Blewett et al. reported simultaneous measurement of several arachidonic acid metabolites by HPLC-MS in rat kidney [43]. The LOQ from this method were 14.4, 25.3, 20.6 pg (on column) for PGF2α, PGE2, PGD2, respectively. The LOQ for all metabolites measured in our method was 0.104 ng/ml (6.25 pg on column) except for 6-keto-PGF1α, PGF2α and 11-d-TXB2 which was 0.208 ng/ml (12.5 pg on column), which is comparable to the values reported by Unterwurzacher et al. [38] and Blewett et al. [43]. Though the 12 min run time of prostanoids method is longer due to the separation of lipophilic cyclopentenone metabolite 15-d-Δ12, 14-PGJ2 from its precursor, our UPLC-MS/MS method run time is comparable to the run time reported by other LC or LC-MS/MS methods [36, 43]. The advantages of the method described in this article are: 1) the shorter run time and comparable LOQ for measurement of various prostanoid metabolites in biological matrices, and 2) the ability to reliably quantify a wide range of physiologically important metabolites of arachidonic acid metabolism from COX and CYP450 pathway in a shorter run time from a single extracted sample of rat brain tissue. Future work will include extending the method to other biological matrices such as blood and/or plasma to widen the scope for different preclinical and clinical applications.
5. Conclusions
A solid phase extraction procedure coupled with a UPLC-MS/MS method was validated and successfully applied for simultaneous extraction of 11 prostanoid metabolites. This method was optimized to provide high resolution and sensitivity for the detection of these analytes in rat brain tissue with an analysis time of 12 minutes per sample. Quantitative amounts of majority of the prostanoids were found in rat brain cortical tissue, and they were within the validated linear range of 0.104 - 33.3 ng/ml. We determined that the matrix did not significantly affect the reliability and reproducibility of the assay. In addition, we have also demonstrated that applying the processing and extraction procedure of this method to our previously validated eicosanoid method improves overall extraction efficiency and reduces matrix effects on eicosanoids. We have successfully quantified eicosanoids from the same extracted sample of rat brain tissue with different MS/MS conditions as reported previously. Collectively, these data demonstrate that our method can be used to effectively quantitate these metabolites with reliability, reproducibility, and rapid analysis time. The increased throughput of analyzing these metabolites should help to evaluate effects of shunting on total sum arachidonic acid metabolism, and advance our understanding of their role as potential therapeutic targets and/or biomarkers of inflammatory and cerebrovascular disorders.
Highlights.
Reports a UPLC-MS/MS method for detection of prostanoids in rat brain
The processing conditions of this method were applied to eicosanoids method
Prostanoids and eicosanoids measured from a single extracted sample of rat brain
Acknowledgments
Funding Sources
R01NS37459 (SHG), AHA 10BGIA3580040 (MDM), NIH R01HD075760 (MDM)
Abbreviations
- AA
arachidonic acid
- UPLC-MS/MS
ultra performance liquid chromatography tandem mass spectrometry
- COX
cyclooxygenase
- PG
prostaglandins
- CYP450
cytochrome P450
- SPE
solid phase extraction
- QC
quality control
- CV
coefficient of variation
- HETE
hydroxyeicosatetraenoic acid
- EET
epoxyeicosatrienoic acid
- DiHETE
dihydroxyeicosatrienoic acid
Footnotes
Publisher's Disclaimer: This is a PDF file of an unedited manuscript that has been accepted for publication. As a service to our customers we are providing this early version of the manuscript. The manuscript will undergo copyediting, typesetting, and review of the resulting proof before it is published in its final citable form. Please note that during the production process errors may be discovered which could affect the content, and all legal disclaimers that apply to the journal pertain.
References
- 1.Gryglewski RJ. Pharmacol Rep. 2008;60:3–11. [PubMed] [Google Scholar]
- 2.Lima IV, Bastos LF, Limborco-Filho M, Fiebich BL, de Oliveira AC. Mediators Inflamm. 2012;2012:946813. doi: 10.1155/2012/946813. [DOI] [PMC free article] [PubMed] [Google Scholar]
- 3.Akaike A, Kaneko S, Tamura Y, Nakata N, Shiomi H, Ushikubi F, Narumiya S. Brain research. 1994;663:237–243. doi: 10.1016/0006-8993(94)91268-8. [DOI] [PubMed] [Google Scholar]
- 4.Takadera T, Yumoto H, Tozuka Y, Ohyashiki T. Neurosci Lett. 2002;317:61–64. doi: 10.1016/s0304-3940(01)02449-1. [DOI] [PubMed] [Google Scholar]
- 5.Liu D, Wu L, Breyer R, Mattson MP, Andreasson K. Ann Neurol. 2005;57:758–761. doi: 10.1002/ana.20461. [DOI] [PubMed] [Google Scholar]
- 6.McCullough L, Wu L, Haughey N, Liang X, Hand T, Wang Q, Breyer RM, Andreasson K. J Neurosci. 2004;24:257–268. doi: 10.1523/JNEUROSCI.4485-03.2004. [DOI] [PMC free article] [PubMed] [Google Scholar]
- 7.Montine TJ, Milatovic D, Gupta RC, Valyi-Nagy T, Morrow JD, Breyer RM. Journal of neurochemistry. 2002;83:463–470. doi: 10.1046/j.1471-4159.2002.01157.x. [DOI] [PubMed] [Google Scholar]
- 8.Montine TJ, Sidell KR, Crews BC, Markesbery WR, Marnett LJ, Roberts LJ, 2nd, Morrow JD. Neurology. 1999;53:1495–1498. doi: 10.1212/wnl.53.7.1495. [DOI] [PubMed] [Google Scholar]
- 9.Mattammal MB, Strong R, Lakshmi VM, Chung HD, Stephenson AH. Journal of neurochemistry. 1995;64:1645–1654. doi: 10.1046/j.1471-4159.1995.64041645.x. [DOI] [PubMed] [Google Scholar]
- 10.Rosenberger TA, Villacreses NE, Hovda JT, Bosetti F, Weerasinghe G, Wine RN, Harry GJ, Rapoport SI. Journal of neurochemistry. 2004;88:1168–1178. doi: 10.1046/j.1471-4159.2003.02246.x. [DOI] [PubMed] [Google Scholar]
- 11.Mohri I, Kadoyama K, Kanekiyo T, Sato Y, Kagitani-Shimono K, Saito Y, Suzuki K, Kudo T, Takeda M, Urade Y, Murayama S, Taniike M. Journal of neuropathology and experimental neurology. 2007;66:469–480. doi: 10.1097/01.jnen.0000240472.43038.27. [DOI] [PubMed] [Google Scholar]
- 12.Iwamoto N, Kobayashi K, Kosaka K. Journal of neurology. 1989;236:80–84. doi: 10.1007/BF00314401. [DOI] [PubMed] [Google Scholar]
- 13.Liu H, Li W, Ahmad M, Miller TM, Rose ME, Poloyac SM, Uechi G, Balasubramani M, Hickey RW, Graham SH. Neurobiology of disease. 2011;41:318–328. doi: 10.1016/j.nbd.2010.09.020. [DOI] [PMC free article] [PubMed] [Google Scholar]
- 14.Liu H, Li W, Ahmad M, Rose ME, Miller TM, Yu M, Chen J, Pascoe JL, Poloyac SM, Hickey RW, Graham SH. Neurotoxicity research. 2013;24:191–204. doi: 10.1007/s12640-013-9377-4. [DOI] [PMC free article] [PubMed] [Google Scholar]
- 15.Takata K, Kitamura Y, Umeki M, Tsuchiya D, Kakimura J, Taniguchi T, Gebicke-Haerter PJ, Shimohama S. Journal of pharmacological sciences. 2003;91:330–333. doi: 10.1254/jphs.91.330. [DOI] [PubMed] [Google Scholar]
- 16.Li W, Wu S, Hickey RW, Rose ME, Chen J, Graham SH. Neurochemical research. 2008;33:490–499. doi: 10.1007/s11064-007-9462-2. [DOI] [PubMed] [Google Scholar]
- 17.Saleem S, Ahmad AS, Maruyama T, Narumiya S, Dore S. Neurotoxicity research. 2009;15:62–70. doi: 10.1007/s12640-009-9007-3. [DOI] [PMC free article] [PubMed] [Google Scholar]
- 18.Takamatsu H, Tsukada H, Watanabe Y, Cui Y, Kataoka Y, Hosoya T, Suzuki M, Watanabe Y. Brain research. 2002;925:176–182. doi: 10.1016/s0006-8993(01)03280-2. [DOI] [PubMed] [Google Scholar]
- 19.Satoh T, Ishikawa Y, Kataoka Y, Cui Y, Yanase H, Kato K, Watanabe Y, Nakadate K, Matsumura K, Hatanaka H, Kataoka K, Noyori R, Suzuki M, Watanabe Y. Eur J Neurosci. 1999;11:3115–3124. doi: 10.1046/j.1460-9568.1999.00791.x. [DOI] [PubMed] [Google Scholar]
- 20.Greenberg S, Kadowitz PJ. Methods and findings in experimental and clinical pharmacology. 1982;4:7–24. [PubMed] [Google Scholar]
- 21.Chapple DJ, Dusting GJ, Hughes R, Vane JR. British journal of pharmacology. 1980;68:437–447. doi: 10.1111/j.1476-5381.1980.tb14557.x. [DOI] [PMC free article] [PubMed] [Google Scholar]
- 22.Lippton HL, Paustian PW, Mellion BT, Nelson PK, Feigen LP, Chapnick BM, Hyman AL, Kadowitz PJ. Archives internationales de pharmacodynamie et de therapie. 1979;241:121–130. [PubMed] [Google Scholar]
- 23.Moncada S, Vane JR. Federation proceedings. 1979;38:66–71. [PubMed] [Google Scholar]
- 24.Hofer G, Bieglmayer C, Kopp B, Janisch H. Prostaglandins. 1993;45:413–426. doi: 10.1016/0090-6980(93)90118-q. [DOI] [PubMed] [Google Scholar]
- 25.Pradelles P, Grassi J, Maclouf J. Methods in enzymology. 1990;187:24–34. doi: 10.1016/0076-6879(90)87005-n. [DOI] [PubMed] [Google Scholar]
- 26.Kiss L, Bieniek E, Weissmann N, Schutte H, Sibelius U, Gunther A, Bier J, Mayer K, Henneking K, Padberg W, Grimm H, Seeger W, Grimminger F. Analytical biochemistry. 1998;261:16–28. doi: 10.1006/abio.1998.2674. [DOI] [PubMed] [Google Scholar]
- 27.Henden T, Strand H, Borde E, Semb AG, Larsen TS. Prostaglandins, leukotrienes, and essential fatty acids. 1993;49:851–854. doi: 10.1016/0952-3278(93)90209-f. [DOI] [PubMed] [Google Scholar]
- 28.Moraes LA, Giner RM, Paul-Clark MJ, Perretti M, Perrett D. Biomedical chromatography : BMC. 2004;18:64–68. doi: 10.1002/bmc.349. [DOI] [PubMed] [Google Scholar]
- 29.VanderNoot VA, VanRollins M. Analytical chemistry. 2002;74:5859–5865. doi: 10.1021/ac025909+. [DOI] [PubMed] [Google Scholar]
- 30.Baranowski R, Pacha K. Mini reviews in medicinal chemistry. 2002;2:135–144. doi: 10.2174/1389557024605465. [DOI] [PubMed] [Google Scholar]
- 31.Nithipatikom K, DiCamelli RF, Kohler S, Gumina RJ, Falck JR, Campbell WB, Gross GJ. Analytical biochemistry. 2001;292:115–124. doi: 10.1006/abio.2001.5044. [DOI] [PubMed] [Google Scholar]
- 32.Martin-Venegas R, Casillas R, Jauregui O, Moreno JJ. J Pharm Biomed Anal. 2011;56:976–982. doi: 10.1016/j.jpba.2011.06.018. [DOI] [PubMed] [Google Scholar]
- 33.Takabatake M, Hishinuma T, Suzuki N, Chiba S, Tsukamoto H, Nakamura H, Saga T, Tomioka Y, Kurose A, Sawai T, Mizugaki M. Prostaglandins, leukotrienes, and essential fatty acids. 2002;67:51–56. doi: 10.1054/plef.2002.0381. [DOI] [PubMed] [Google Scholar]
- 34.Chappell DL, Xiao X, Radziszewski W, Laterza OF. J Pharm Biomed Anal. 2011;56:600–603. doi: 10.1016/j.jpba.2011.06.019. [DOI] [PubMed] [Google Scholar]
- 35.Ferreiro-Vera C, Mata-Granados JM, Priego-Capote F, de Castro MD. J Chromatogr A. 2011;1218:2848–2855. doi: 10.1016/j.chroma.2011.03.049. [DOI] [PubMed] [Google Scholar]
- 36.Ferreiro-Vera C, Mata-Granados JM, Priego-Capote F, Quesada-Gomez JM, Luque de Castro MD. Anal Bioanal Chem. 2011;399:1093–1103. doi: 10.1007/s00216-010-4400-6. [DOI] [PubMed] [Google Scholar]
- 37.Komaba J, Matsuda D, Shibakawa K, Nakade S, Hashimoto Y, Miyata Y, Ogawa M. Biomed Chromatogr. 2009;23:315–323. doi: 10.1002/bmc.1117. [DOI] [PubMed] [Google Scholar]
- 38.Unterwurzacher I, Koal T, Bonn GK, Weinberger KM, Ramsay SL. Clin Chem Lab Med. 2008;46:1589–1597. doi: 10.1515/CCLM.2008.323. [DOI] [PubMed] [Google Scholar]
- 39.Masoodi M, Nicolaou A. Rapid Commun Mass Spectrom. 2006;20:3023–3029. doi: 10.1002/rcm.2697. [DOI] [PMC free article] [PubMed] [Google Scholar]
- 40.Matuszewski BK, Constanzer ML, Chavez-Eng CM. Analytical chemistry. 2003;75:3019–3030. doi: 10.1021/ac020361s. [DOI] [PubMed] [Google Scholar]
- 41.Viswanathan CT, Bansal S, Booth B, DeStefano AJ, Rose MJ, Sailstad J, Shah VP, Skelly JP, Swann PG, Weiner R. Pharmaceutical research. 2007;24:1962–1973. doi: 10.1007/s11095-007-9291-7. [DOI] [PubMed] [Google Scholar]
- 42.Miller TM, Donnelly MK, Crago EA, Roman DM, Sherwood PR, Horowitz MB, Poloyac SM. Journal of chromatography B, Analytical technologies in the biomedical and life sciences. 2009;877:3991–4000. doi: 10.1016/j.jchromb.2009.10.012. [DOI] [PMC free article] [PubMed] [Google Scholar]
- 43.Blewett AJ, Varma D, Gilles T, Libonati JR, Jansen SA. J Pharm Biomed Anal. 2008;46:653–662. doi: 10.1016/j.jpba.2007.11.047. [DOI] [PubMed] [Google Scholar]
- 44.Yue H, Jansen SA, Strauss KI, Borenstein MR, Barbe MF, Rossi LJ, Murphy E. J Pharm Biomed Anal. 2007;43:1122–1134. doi: 10.1016/j.jpba.2006.10.009. [DOI] [PMC free article] [PubMed] [Google Scholar]
- 45.Berchtold-Kanz E, Anhut H, Heldt R, Neufang B, Hertting G. Prostaglandins. 1981;22:65–79. doi: 10.1016/0090-6980(81)90054-x. [DOI] [PubMed] [Google Scholar]
- 46.Aukema HM, Lu J, Borthwick F, Proctor SD. The British journal of nutrition. 2013;110:11–19. doi: 10.1017/S0007114512004606. [DOI] [PubMed] [Google Scholar]