Abstract
Background
The basis of mitral annuloplasty ring design has progressed from qualitative surgical intuition to experimental and theoretical analysis of annular geometry with quantitative imaging techniques. In this work, we present an automated 3D echocardiographic (3DE) image analysis method that can be used to statistically assess variability in normal mitral annular geometry to support advancement in annuloplasty ring design.
Methods
3D patient-specific models of the mitral annulus were automatically generated from 3DE images acquired from subjects with normal mitral valve structure and function. Geometric annular measurements including annular circumference (AC), annular height (AH), septolateral diameter (SLD), intercommissural width (ICW), and the AH to ICW ratio (AHCWR) were automatically calculated. A mean 3D annular contour was computed, and principal component analysis (PCA) was used evaluate variability in normal annular shape.
Results
The following mean ± standard deviations were obtained from 3DE image analysis: 107.0 ± 14.6 mm (AC), 7.6 ± 2.8 mm (AH), 28.5 ± 3.7 mm (SLD), 33.0 ± 5.3 mm (ICW), and 22.7 ± 6.9 % (AHCWR). PCA indicated that shape variability was primarily related to overall annular size, with more subtle variation in the skewness and height of the anterior annular peak, independent of annular diameter.
Conclusions
Patient-specific 3DE-based modeling of the human mitral valve enables statistical analysis of physiologically normal mitral annular geometry. The tool can potentially lead to the development of a new generation of annuloplasty rings that restore the diseased mitral valve annulus back to a truly normal geometry.
Keywords: mitral valve, mitral valve repair, echocardiography
Introduction
Since the beginning of his pioneering work on mitral valve repair, Carpentier has strongly advocated the use of ring annuloplasty to restore normal annular geometry [1]. Early ring designs were based on expert surgical intuition and careful but qualitative observation of the mitral valve in arrested hearts during open heart procedures [2-4].
During the late 1980s Levine used early generation three dimensional echocardiography (3DE) to image the functioning mitral valve annulus. For the first time the annulus was found to have a 3D saddle shape [5]. This finding had no influence on annuloplasty ring design until our group’s early work demonstrating the importance of annular saddle shape in reducing leaflet stress and potentially increasing repair durability [6]. That initial theoretical work was supported by experimental findings by our group [7] and others [8,9], which demonstrated the salutary influence of saddle shape annuloplasty on both annular and leaflet stress-strain profiles after mitral valve repair.
This growing body of evidence generated interest in the development of saddle shaped annuloplasty ring designs. The first saddle shaped rings were based on animal studies with sonomicrometry [10]. Second generation designs were created using data developed by our group’s application of novel real-time 3DE image analysis techniques to the human valve [11].
Herein we report the use of new automated imaging algorithms designed to quickly and quantitatively describe the geometry of the normal human mitral valve annulus. Additionally we present a statistical analysis of the variability of that shape from person to person. The methods and data presented can be used in the future to develop a third generation of annuloplasty rings that restore the diseased mitral valve annulus back to a truly normal shape.
Material and Methods
Image Acquisition
This research protocol was approved by the University of Pennsylvania School of Medicine Institutional Review Board and all patients signed consents that allowed their echocardiographic studies to be analyzed.
Electrocardiographically gated full-volume transesophageal images of the mitral valve were acquired from 20 human subjects prior to a cardiac operation unrelated to the mitral valve. All patients had normal mitral leaflet, annular, and subvalvular morphology and dynamics based on 2D and 3D echocardiographic assessment. Each had an ejection fraction > 55% and had no more than trace mitral regurgitation observed with Doppler echocardiography. The average BMI and BSA were 31.2 ± 6.5 kg/m2 and 2.1 ± 0.2 m2, respectively.
Imaging was performed with the iE33 platform (Philips Medical Systems, Andover, MA) using a 2 to 7 MHz transesophageal matrix-array transducer over four consecutive cardiac cycles. From each subject’s data series, a 3DE image at mid systole was selected for analysis. Mid-systole was defined as the temporal midpoint between aortic valve opening and closure. The images were exported in Cartesian format (224 × 208 × 208 voxels) with an isotropic resolution of 0.6 to 0.8 mm.
Semi-automated image analysis
The 3DE images of the mitral leaflets were semi-automatically delineated and geometrically modeled using previously described custom image analysis software [12]. First, the mitral leaflets were segmented with user-initialized 3D active contour evolution. Minimal manual refinements of the mitral leaflet segmentation were performed for two subjects, requiring only several minutes of user interaction. Next, the morphology of the segmented leaflets was geometrically represented with a deformable medial model, a compact quantitative descriptor of shape [13]. The deformable medial model explicitly represents 3D annular geometry and automatically identifies four annular landmarks: the anterior aortic peak of the annulus (AAoP), the midpoint of the posterior annulus (MPA), and the anterior and posterior commissures (AC, PC). Figure 1 illustrates the semi-automated image analysis process, including a 3DE image acquired at mid systole (a), a 2D cross section of the 3DE image showing the leaflet segmentation in red (b), and the fitted deformable model of the mitral leaflets with the annular curve shown in blue (c). The output of image analysis for each subject was a 3D annular contour at mid systole, consisting of 165 ordered points with four identified landmarks.
Figure 1.
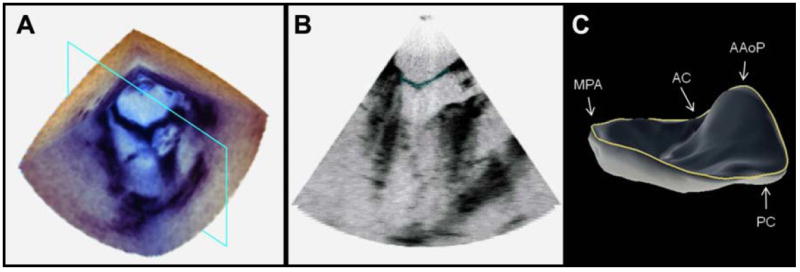
3DE image of the mitral valve. (a) The 3DE image volume of the mitral valve at mid systole. (b) A cross section of the 3DE image with the automated segmentation of the mitral leaflets shown in red. (c) The fitted deformable model of the mitral leaflets with the 3D annular contour shown in blue. (AAoP = anterior aortic peak of the annulus, MPA = midpoint of the posterior annulus, AC = anterior commissure, PC = posterior commissure)
Annular shape analysis
The following measurements and ratios were derived from each 3D annular curve as illustrated in Figure 2:
Figure 2.

Diagram of the landmarked annular contour. The anterior annulus is shown in blue and posterior annulus is shown in red. (AAoP = anterior aortic peak, MPA = midpoint of the posterior annulus, PC = posterior commissure, AC = anterior commissure, SLD = septolateral diameter, ICW = intercommissural width, AH = annular height)
Total annular circumference (AC): sum of the lengths of the posterior and anterior annulus
Posterior annular circumference (PAC): length of the posterior annular contour
Anterior annular circumference (AAC): length of the anterior annular contour
Annular height (AH): distance between the highest and lowest points on the annulus relative to a least squares plane fitted through the annulus
Septolateral diameter (SLD): distance between the anterior aortic peak of the annulus and the midpoint of the posterior annulus
Intercommissural width (ICW): distance between the anterior and posterior commissures
Annular height to intercommissural width ratio (AHCWR): quotient of AH and ICW, multiplied by 100, expressed as a percentage
Ratio of septolateral diameter to intercommissural width (SLD:ICW): quotient of SLD to ICW, multiplied by 100, expressed as a percentage
Ratio of posterior annular circumference to total annular circumference (PAC:AC): quotient of PAC and AC, multiplied by 100 and expressed as a percentage
All patients’ annular contours were aligned and a mean annular curve was obtained by generalized Procrustes analysis, without scaling or reflection [14]. Principal component analysis was performed on the covariance matrix of the 20 aligned annular contours to obtain a set of eigenvectors and eigenvalues describing orthogonal modes of variation in normal annular geometry. Detail on statistical shape analysis is given in the Appendix.
Results
The mean and standard deviations of the annular measurements are presented in Table 1. The mean 3D annular curve computed by generalized Procrustes analysis is shown superimposed on the twenty individual annular curves in Figure 3, and geometric measurements of the mean model are given in Table 2 (second column). Note that the mean annular curve has a well-defined saddle shape with peaks near the midpoints of the anterior and posterior annulus and troughs near the commissures. The mean annular contour appears oblong from an atrial perspective, with an SLD:ICW ratio of 86.3%. The non-planarity of the 3D annular contour is evident in Figure 4, which shows AHCWR as a function of rotational position on the annulus. Here, the red curve refers to the mean annular shape, while the blue curves refer to the 20 individual annular contours. No meaningful relationship between BMI or BSA and any of the mitral annular measurements or ratios was observed.
Table 1.
Mean, standard deviation, and range in measurements of annular geometry.
| Annular measurement | Mean ± standard deviation | Range of values |
|---|---|---|
| AC | 107.0 ± 14.6 mm | 81.3 to 134.3 mm |
| PAC | 63.7 ±8.6 mm | 49.7 to 78.7 mm |
| AAC | 43.3 ±8.2 mm | 30.1 to 59.7 mm |
| AH | 7.6 ±2.8 mm | 3.7 to 15.7 mm |
| SLD | 28.5 ±3.7 mm | 21.1 to 36.1 mm |
| ICW | 33.0 ±5.3 mm | 23.4 to 41.6 mm |
| AHCWR | 22.7 ± 6.9 % | 14.3 to 37.8% |
| SLD:ICW | 87.3 ± 9.3 % | 74.0 to 103.0% |
| PAC:AC | 59.7 ±4.1 % | 51.3 to 68.5% |
AC = annular circumference, PAC = posterior annular circumference, AAC = anterior annular circumference, AH = annular height, SLD = septolateral diameter, ICW = intercommissural width, AHCWR = ratio of AH to ICW, SLD:ICW = ratio of SLD to ICW, PAC:AC = ratio of PAC to AC
Figure 3.
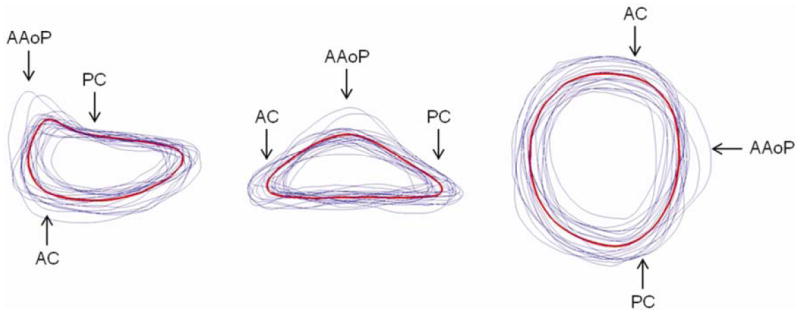
Mean (red) and individual (blue) 3D annular contours shown from three perspectives. (AAoP = anterior aortic peak, PC = posterior commissure, AC = anterior commissure)
Table 2.
Measurements of the mean 3D annular contour (second column), and the range of values obtained by moving along each eigenmode from -2 to +2 standard deviations from the mean.
| Annular measurement | Mean model | Range in eigenmode 1 | Range in eigenmode 2 | Range in eigenmode 3 |
|---|---|---|---|---|
| AC | 105.2 mm | 77.5 to 133.5 mm | 106.5 to 107.7 mm | 106.8 to 107.0 mm |
| AH | 7.7 mm | 4.5 to 11.2 mm | 7.7 to 8.5 mm | 3.7 to 11.5 mm |
| SLD | 28.4 mm | 22.3 to 34.5 mm | 28.2 to 28.9 mm | 27.4 to 29.6 mm |
| ICW | 33.0 mm | 23.0 to 42.9 mm | 31.9 to 34.3 mm | 31.8 to 34.1 mm |
| AHCWR | 23.2 % | 19.7 to 26.1 % | 24.1 to 24.9 % | 11.8 to 33.9 % |
| SLD:ICW | 86.3% | 97.1 to 80.4 % | 88.6 to 84.3 % | 86.1 to 87.0 % |
| PAC:AC | 59.7 % | 61.9 to 58.4 % | 61.7 to 56.3 % | 65.1 to 53.4 % |
AC = annular circumference, AH = annular height, SLD = septolateral diameter, ICW = intercommissural width, AHCWR = ratio of AH to ICW, SLD:ICW = ratio of SLD to ICW, PAC:AC = ratio of posterior AC to total AC
Figure 4.
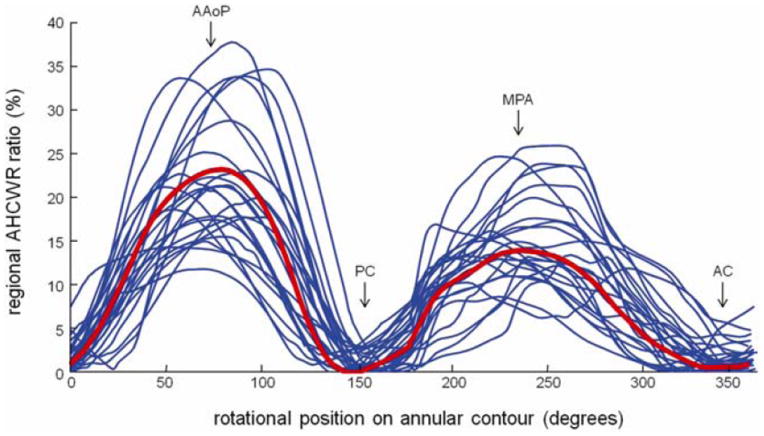
Annular height to intercommissural width ratio (AHCWR) as a function of rotational position on the 3D annular contour. (AAoP = anterior aortic peak, AC = anterior commissure, MPA = midpoint of the posterior annulus, PC = posterior commissure)
The first three eigenmodes obtained by PCA represented 73.8% of the total variation in annular geometry in the 20 subjects: 52.8% in the first mode, 11.2% in the second, and 9.8% in the third. Along each mode, annular contours ±1 and ±2 standard deviations were computed and are displayed in Figure 5 from three different viewpoints. For each eigenmode, the red contour is the mean shape, the dark and light blue contours are +1 and +2 standard deviations from the mean, and the dark and light green curves are -1 and -2 standard deviations from the mean. The regional AHCWR ratio is shown for each eigenmode in Figure 6. Table 2 lists the annular measurements of the mean annular contour and the range of values -2 to +2 standard deviations from the mean along each mode of shape variation.
Figure 5.
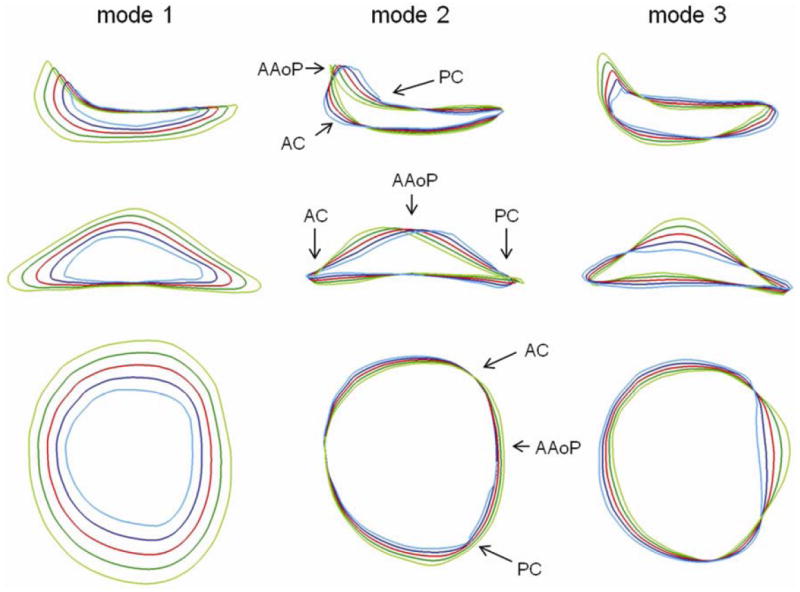
Three modes of variation in normal annular geometry (columns), shown from three different viewpoints (rows). The red curve is the mean annular shape, the dark and light blue curves are +1 and +2 standard deviations from the mean, and the dark and light green curves are -1 and -2 standard deviations from the mean along a given mode of shape variation obtained by principal component analysis.
Figure 6.
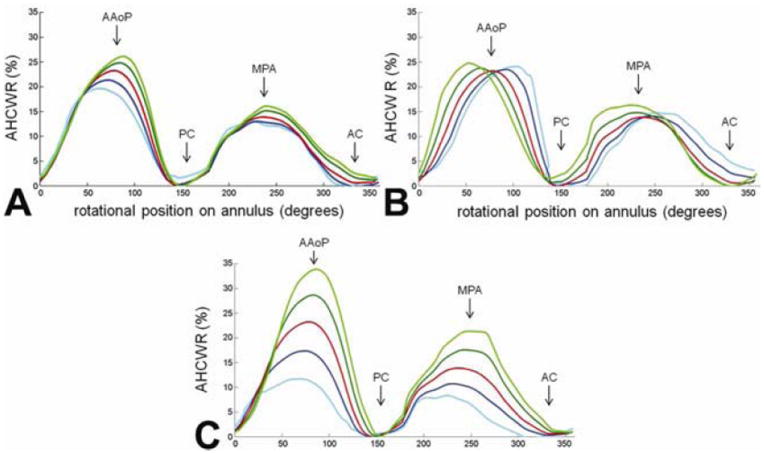
Annular height to intercommissural width ratio (AHCWR) as a function of rotational position on the annular contour. Each plot refers to one of three eigenmodes in shape variation obtained by principal component analysis. The red curve refers to the mean annular contour, the dark and light blue curves refer to +1 and +2 standard deviations from the mean, and the dark and light green curves refer to -1 and -2 standard deviations from the mean along a given eigenmode of shape variation. A: mode 1; B: mode 2; C: mode 3. (AAoP = anterior aortic peak, PC = posterior commissure, MPA = midpoint of the posterior annulus, AC = anterior commissure)
The first eigenmode determined by PCA primarily shows variation in annular size. Moving away from the mean in one direction, the AH, AC, SLD, and ICW all increase and the annular curve becomes more oblong from an atrial perspective, with a decreased SLD:ICW ratio. Moving in the opposite direction along the first mode, the annular size decreases and the annulus becomes more circular from an atrial perspective, indicated by an increase in the SLD:ICW ratio. Along the second eigenmode, there is little change in AH, AC, SLD, and ICW. Rather, the second mode shows change in the skewness of the anterior annulus: the AAoP moves off-center and closer to one of the commissures relative to the mean, indicated by the regional AHCWR curves in Figure 6. The third eigenmode primarily shows changes in AH and the global AHCWR ratio, as shown in Figure 5 and Figure 6. Along this mode, there is little variation in the annular diameters and circumferences, but there are large changes in the height of the anterior annular peak. The third, and least significant, eigenmode shows the greatest variation in the PAC:AC ratio.
Comment
This work complements and builds on previous studies of the nonplanarity of normal human annular geometry. The first description of the 3D shape of the mitral annulus was made by Levine and colleagues using first-generation 3DE scanning [5]. Annular geometry was further examined by several other groups using real-time 3DE imaging with state-of-the-art matrix array transducers [11,15-17]. Sonomicrometric studies in sheep have demonstrated the conservation of mitral annular nonplanarity across species [6]. In comparison to previous work, the novelty of this study lies in the use of an automated method of 3DE segmentation and mitral annular modeling, rather than manual tracing of human 3DE data. The automated method provides a repeatable, consistent means of analyzing a larger population of subjects with less user interaction and utilizes a geometric model that facilitates landmark identification and standardized quantitative morphometry. The annular contour is more densely sampled relative to previous studies employing manual tracing, in which the 3D annulus is typically defined by 36 points [11,15-17]. With its ability to identify anatomic correspondences in different subjects, the automated algorithm is well-suited for the application of statistical shape analysis methods such as generalized Procrustes analysis. Moreover, it provides a framework for describing pathological annular deformations in quantitative terms and for refining mitral valve repair techniques and devices.
The geometric measurements reported here are consistent with several previous studies of normal human annular shape. Based on systolic annular circumference measurements at systole, Levine and colleagues estimate the range of annular nonplanarity in normal human subjects to be 3 to 14 mm [5], which is approximately the range observed in this study (3.7 to 15.7 mm). In a population of five normal human subjects, Ryan et al measured an average AHCWR of 26.6 ± 3.1 % [11], which is within the range observed in this study of 20 subjects: 14.3 to 37.8 %. Interestingly, our group’s early theoretical analysis of annular geometry had indicated that leaflet stress approaches a minimum when AHCWR values are between 15% to 30% [6]. The mean AHCWR measured here (22.7 ± 6.9 %) falls within this range, as expected in subjects with normal mitral valve function. Compared to the results presented in this study, Watanabe and colleagues measured a somewhat lower average AH at mid systole in 10 healthy human subjects (5.0 ± 0.7 mm) [16]. It is possible that the lower AH measurements reported in that study are the result of using an earlier 3DE imaging platform, a smaller patient population, or an annular representation with lower spatial resolution. The AH values measured in our study (7.6 ± 2.8 mm) are on par with those assessed by Vergnat and colleagues using manual tracing in a population of 17 normal subjects using the same imaging platform (7.5 ± 0.4 mm) [15]. Our measurements of ICW, SLD, AC, PAC, and AAC are likewise consistent with this study, as well as the recent work of Lee et al, which includes an assessment of annular geometry in 32 healthy subjects [17].
In addition to utilizing automated 3DE image analysis, a key contribution of this study is the statistical description of normal mitral annular geometry using Procrustes analysis and principle component analysis (PCA). The eigenmodes of shape variation generated by this statistical methodology indicate that the major differences between annuli were related to overall annular size. Differences in the skewness and height of the anterior annular peak also existed but to a much lesser extent, indicating that the saddle shape was relatively conserved from person to person. Despite this consistency, subtle trends in shape variation could be seen. Taken together, the findings summarized in Figures 5 and 6 indicated that larger annuli tended to be more elliptical with more pronounced AHCWR and tended to have an anterior annular peak that is slightly skewed towards the posterior commissure.
It is possible that a wider application of this analysis could provide information for a new generation of annuloplasty ring designs. All current designs are manufactured in a range of sizes with all sizes maintaining the same shape. With further study it may become apparent that to completely restore normal valve geometry, the next generation of saddle shaped annuloplasty devices would best be created with subtle variations in shape as ring size increases.
It has become increasingly apparent that the majority of mitral valve repair failures are related to valve stress. As such, the potential clinical importance of such size-related design subtleties could be supported by mathematical models based on a combination of the currently described imaging methodology and finite element leaflet stress analysis.
Acknowledgments
This study was supported by grants from the National Heart, Lung and Blood Institute of the National Institutes of Health, Bethesda, MD, (HL63954, HL73021, HL103723, HL108330, HL119010). R. Gorman and J. Gorman are supported by individual Established Investigator Awards from the American Heart Association, Dallas, TX. M. Vergnat was supported by a French Federation of Cardiology Research Grant.
Appendix: Statistical analysis of 3D mitral annular geometry
Similar to the shape analysis described by Dryden and Mardia [14], each annular shape Ai is represented as a vector of ordered landmark points: Ai = [x1,y1,z1,…,xn,yn,zn] , where (xj,yj,zj)refers to the 3D coordinates of landmark j and n = 165, the total number of points sampled on the 3D annular contour. The aim of statistical shape analysis is to approximate the distribution of annular shapes as a linear combination of a mean annular shape, A̅, and a weighted sum of c eigenvectors Φk associated with eigenvalues λk:
where and bk is a scalar weighting parameter. Given N annular shapes aligned by Procrustes alignment without scaling or reflection, the mean shape is given by
For each shape Ai, we calculate its deviation from the mean:
and compute the covariance matrix C:
The modes of variation in the N annular shapes are then given by Φk, the unit eigenvectors of C that satisfy
Here, λk is the kth eigenvalue of C and λk ≥ λk+1. The eigenvectors of the covariance matrix corresponding to the largest eigenvalues represent the most significant modes of shape variation, and the variance encoded in each eigenvector is equal to its corresponding eigenvalue. The percentage of shape variation described by the eigenmode k is computed as
where λT is the sum of the eigenvalues. Given this linear statistical shape model, a shape ±b standard deviations from the mean along the kth eigenmode is estimated by
Footnotes
Publisher's Disclaimer: This is a PDF file of an unedited manuscript that has been accepted for publication. As a service to our customers we are providing this early version of the manuscript. The manuscript will undergo copyediting, typesetting, and review of the resulting proof before it is published in its final citable form. Please note that during the production process errors may be discovered which could affect the content, and all legal disclaimers that apply to the journal pertain.
References
- 1.Carpentier A, Deloche A, Dauptain J, Soyer R, Blondeau P, Piwnica A, Dubost C, McGoon DC. A new reconstructive operation for correction of mitral and tricuspid insufficiency. J Thorac Cardiovasc Surg. 1971;61:1–13. [PubMed] [Google Scholar]
- 2.Carpentier A. Cardiac valve surgery: The “French correction”. J Thorac Cardiovasc Surg. 1983;86:323–37. [PubMed] [Google Scholar]
- 3.Carpentier A. Mitral Valve Annuloplasty. Ann Thorac Surg. 1990;49:508–9. doi: 10.1016/0003-4975(90)90277-d. [DOI] [PubMed] [Google Scholar]
- 4.Carpentier AF, Lessana A, Relland JYM. The “physio-ring”: An advanced concept in mitral valve annuloplasty. Ann Thorac Surg. 1995;60:1177–86. doi: 10.1016/0003-4975(95)00753-8. [DOI] [PubMed] [Google Scholar]
- 5.Levine RA, Handschumacher MD, Sanfilippo AJ, Hagege AA, Harrigan P, Marshall JE, Weyman AE. Three-dimensional echocardiographic reconstruction of the mitral valve, with implications for the diagnosis of mitral valve prolapse. Circulation. 1989;80:589–98. doi: 10.1161/01.cir.80.3.589. [DOI] [PubMed] [Google Scholar]
- 6.Salgo IS, Gorman JH, 3rd, Gorman RC, Jackson BM, Bowen FW, Plappert T, St John Sutton MG, Edmunds LH., Jr Effect of annular shape on leaflet curvature in reducing mitral leaflet stress. Circulation. 2003;106:711–7. doi: 10.1161/01.cir.0000025426.39426.83. [DOI] [PubMed] [Google Scholar]
- 7.Ryan LP, Jackson BM, Hamamoto H, Eperjesi TJ, Plappert TJ, St John-Sutton M, Gorman RC, Gorman JH., 3rd The influence of annuloplasty ring geometry on mitral leaflet curvature. Ann Thorac Surg. 2008;86:749–760. doi: 10.1016/j.athoracsur.2008.03.079. [DOI] [PMC free article] [PubMed] [Google Scholar]
- 8.Jensen MO, Jensen H, Smerup M, Levine RA, Yoganathan AP, Nygaard H, Hasenkam JM, Nielsen SL. Saddle-shaped mitral valve annuloplasty rings experience lower forces compared with flat rings. Circulation. 2008;118(14 Suppl):S250–5. doi: 10.1161/CIRCULATIONAHA.107.746776. [DOI] [PubMed] [Google Scholar]
- 9.Jimenez JH, Liou SW, Padala M, He Z, Sacks M, Gorman RC, Gorman JH, 3rd, Yoganathan AP. A saddle shaped annulus reduces systolic strain on the central region of the mitral valve anterior leaflet. J Thorac Cardiovasc Surg. 2007;134:1562–1568. doi: 10.1016/j.jtcvs.2007.08.037. [DOI] [PubMed] [Google Scholar]
- 10.Gorman JH, III, Gupta KB, Streicher JS, Gorman RC, Jackson BM, Bogen DK, Edmunds LH., Jr Dynamic three-dimentional imaging of the mitral valve using rapid sonomicrometry array localization. J Thorac Cardiovasc Surg. 1996;112(3):712–725. doi: 10.1016/S0022-5223(96)70056-9. [DOI] [PubMed] [Google Scholar]
- 11.Ryan LP, Jackson BM, Enomoto Y, Parish L, Plappert TJ, St John-Sutton MB, Gorman RC, Gorman JH., 3rd Description of regional mitral annular non-planarity in healthy human subjects: A novel methodology. J Thorac Cardiovasc Surg. 2007;134:644–648. doi: 10.1016/j.jtcvs.2007.04.001. [DOI] [PubMed] [Google Scholar]
- 12.Pouch AM, Yushkevich PA, Jackson BM, Jassar AS, Vergnat M, Gorman JH, Gorman RC, Sehgal CM. Development of a semi-automated method for mitral valve modeling with medial axis representation using 3D ultrasound. Med Phys. 2012;39(2):933–50. doi: 10.1118/1.3673773. [DOI] [PMC free article] [PubMed] [Google Scholar]
- 13.Yushkevich PA, Zhang H, Gee JC. Continuous medial representation for anatomical structures. IEEE Trans Med Imaging. 2006;25(12):1547–64. doi: 10.1109/tmi.2006.884634. [DOI] [PubMed] [Google Scholar]
- 14.Dryden IL, Mardia KV. Statistical shape analysis. Chichester: John Wiley & Sons; 1998. [Google Scholar]
- 15.Vergnat M, Jassar AS, Jackson BM, Ryan LP, Eperjesi TJ, Pouch AM, Weiss SJ, Cheung AT, Acker MA, Gorman JH, 3rd, Gorman RC. Ischemic mitral regurgitation: a quantitative three-dimensional echocardiographic analysis. Ann Thorac Surg. 2011;91(1):157–64. doi: 10.1016/j.athoracsur.2010.09.078. [DOI] [PMC free article] [PubMed] [Google Scholar]
- 16.Watanabe N, Ogasawara Y, Yamaura Y, Wada N, Kawamoto T, Toyota E, Akasaka T, Yoshida K. Mitral annulus flattens in ischemic mitral regurgitation: geometric differences between inferior and anterior myocardial infarction: a real-time 3-dimensional echocardiographic study. Circulation. 2005;112(9 Suppl):I458–62. doi: 10.1161/CIRCULATIONAHA.104.524595. [DOI] [PubMed] [Google Scholar]
- 17.Lee AP, Hsiung MC, Salgo IS, Fang F, Xie JM, Zhang YC, Lin QS, Looi JL, Wan S, Wong RH, Underwood MJ, Sun JP, Yin WH, Wei J, Tsai SK, Yu CM. Quantitative Analysis of Mitral Valve Morphology in Mitral Valve Prolapse Using Real-Time Three-Dimensional Echocardiography: Importance of Annular Saddle-Shape in Pathogenesis of Mitral Regurgitation. Circulation. 2013;127(7):832–41. doi: 10.1161/CIRCULATIONAHA.112.118083. [DOI] [PubMed] [Google Scholar]


