

Abstract
Transcripts encoding ADAR1, a double-stranded, RNA-specific adenosine deaminase involved in the adenosine-to-inosine (A-to-I) editing of mammalian RNAs, can be alternatively spliced to produce an interferon-inducible protein isoform (p150) that is up-regulated in both cell culture and in vivo model systems in response to pathogen or interferon stimulation. In contrast to other tissues, p150 is expressed at extremely low levels in the brain and it is unclear what role, if any, this isoform may play in the innate immune response of the central nervous system (CNS) or whether the extent of editing for RNA substrates critical for CNS function is affected by its induction. To investigate the expression of ADAR1 isoforms in response to viral infection and subsequent alterations in A-to-I editing profiles for endogenous ADAR targets, we used a neuro-tropic strain of reovirus to infect neonatal mice and quantify A-to-I editing in discrete brain regions using a multiplexed, high-throughput sequencing strategy. While intracranial injection of reovirus resulted in a widespread increase in the expression of ADAR1 (p150) in multiple brain regions and peripheral organs, significant changes in site-specific A-to-I conversion were quite limited, suggesting that steady-state levels of p150 expression are not a primary determinant for modulating the extent of editing for numerous ADAR targets in vivo.
Keywords: CNS, high-throughput sequencing, interferon, cerebellum, hippocampus, frontal cortex
Introduction
The complexity of signaling networks in the central nervous system (CNS) relies on the tightly-controlled regulation and continuous fine-tuning of gene expression. In addition to changes in cell-specific transcriptional activation, dynamic alterations in RNA processing events such as alternative splicing (Grabowski, 2011; Gustincich et al., 2006; Licatalosi and Darnell, 2006) and RNA editing (Balik et al., 2013; Berg et al., 2008; Sanjana et al., 2012; Schellekens et al., 2012; Tan et al., 2009) are required to achieve the precise cascade of cellular events necessary for normal neuronal function. The conversion of adenosine to inosine (A-to-I) by RNA editing is an essential cellular mechanism for diversifying the transcriptome and subsequent protein activity by introducing non-synonymous codon changes in mRNAs encoding proteins critical for nervous system activity including ligand- and voltage-gated ion channels, G-protein coupled receptors and components of the synaptic release machinery (Hood and Emeson, 2012; Hoopengardner et al., 2003; Rosenthal and Seeburg, 2012). An inosine within the open reading frame (ORF) of an mRNA is read as guanosine during translation, which can lead to specific change(s) in the predicted amino acid coding potential of the mRNA to alter the functional properties of the encoded protein product.
The conversion of A-to-I is mediated through the actions of a family of double-stranded RNA (dsRNA) binding proteins referred to as ADARs (adenosine deaminases acting on RNA) that selectively deaminate adenosine residue(s) in precursor and mature mRNA transcripts (Nishikura, 2010). Two active members of the ADAR family, ADAR1 and ADAR2, are thought to be responsible for all mammalian A-to-I editing events and are essential for viability (Hartner et al., 2004; Higuchi et al., 2000; Wang et al., 2004). Transcription of the ADAR1 gene is complex, initiating from at least three different promoters that lead to mature mRNAs with mutually exclusive first exons (exons 1A, 1B, and 1C) via alternative splicing (Liu et al., 1997) (Fig. 1A). The promoter that initiates the ADAR1A transcript is strongly stimulated by interferon (IFN) (Der et al., 1998; George and Samuel, 1999b; Liu et al., 1997; Patterson and Samuel, 1995; Patterson et al., 1995). Translation initiates at an in-frame AUG codon at the 3′-end of exon 1A to generate a 150 kilodalton (kD) protein isoform (p150) which contains three copies of a dsRNA-binding motif (dsRBM), a motif shared among numerous dsRNA-binding proteins (Burd and Dreyfuss, 1994; Fierro-Monti and Mathews, 2000), a nuclear localization signal in the third dsRBM (Eckmann et al., 2001), and a region homologous to the catalytic domain of other known adenosine and cytidine deaminases (Fig. 1B). The amino-terminus of p150 also contains two Z-DNA binding domains, the first of which (Zα) overlaps with a leucine-rich nuclear export signal (Poulsen et al., 2001) and may be involved in the recognition of foreign nucleic acids in the cytoplasm by the innate immune system (Athanasiadis, 2012). The Z-DNA binding domains also have been proposed to tether ADAR1 to sites of transcription (Herbert et al., 1997; Herbert and Rich, 1999) or to mediate interactions between ADARs and other proteins (Poulsen et al., 2001). Transcripts initiating at constitutively expressed exons 1B or 1C use an initiation codon in exon 2 to generate a 110 kD ADAR1 protein isoform (p110) which lacks the first 248 amino acids of the p150 isoform containing the nuclear export signal and the Zα domain (George and Samuel, 1999b; Kawakubo and Samuel, 2000) (Fig. 1B). While both isoforms are capable of nuclear-cytoplasmic shuttling, they exhibit unique subcellular localizations at steady state where p110 is found predominately in nucleoli, while the majority of full-length p150 resides in the cytoplasm (Eckmann et al., 2001; Fritz et al., 2009; Patterson and Samuel, 1995; Strehblow et al., 2002). Alternative splicing within exon 7 also generates two distinct mRNA isoforms encoding ADAR1 proteins that differ by 26 amino acids in the linker region between the third double-stranded RNA binding motif and the catalytic domain (Fig. 1A) to affect site-selective editing efficiency (George et al., 2005; Liu et al., 1999a; Liu et al., 1997; Liu and Samuel, 1999a).
Figure 1. Generation of multiple mouse ADAR1 isoforms by alternative splicing.
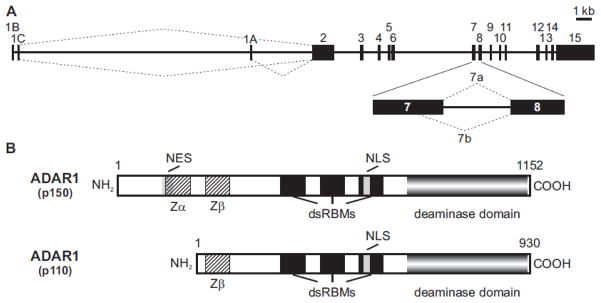
A) A schematic representation of the mouse ADAR1 gene is shown indicating the presence of alternative exon 1 sequences that can generate constitutive (1B and 1C) and interferon-induced (1A) mRNA isoforms by alternative splicing to encode distinct p110 and p150 proteins, respectively; kb, kilobase. An alternative splicing event in exon 7 leads to additional ADAR1 RNA and protein diversity, generating RNA isoforms (7a and 7b) encoding proteins differing in size by 26 amino acids. B) The major mouse ADAR1 protein isoforms are presented indicating their relative size in amino acids, as well as the location of the putative nuclear localization (NLS) and export (NES) signals, Z-DNA binding domains (Zα and Zβ), dsRNA-binding motifs (dsRBMs) and the catalytic adenosine deaminase domain.
IFN-alpha treatment of a human glioblastoma cell line induces a robust increase in p150 expression accompanied by significant changes in the editing of 5HT2C receptor RNAs (Yang et al., 2004). ADAR1 is also induced by a variety of inflammatory mediators including endotoxin, lipopolysaccharide, and tumor necrosis factor (Meltzer et al., 2010; Rabinovici et al., 2001; Wu et al., 2009). Oral inoculation of Salmonella in mice leads to systemic acute inflammation and expression of ADAR1 p150 RNA. However, the consequences of such treatment on ADAR1 protein levels or RNA editing patterns are not known (George et al., 2005; Shtrichman et al., 2002).
To investigate potential changes in RNA editing patterns in response to a viral CNS infection, we have used reovirus serotype-3 strain Dearing (T3D) infection of neonatal mice as an experimental model system. Reoviruses are nonenveloped, icosahedral viruses with genome consisting of 10 segments of dsRNA and are commonly used to study neurotropism and neuro-inflammation (Danthi et al., 2013; Oberhaus et al., 1997; Richardson-Burns and Tyler, 2004). Reovirus is a potent inducer of type I interferon and produces a lethal meningoencephalitis in newborn animals associated with the apoptotic death of infected neurons (Danthi et al., 2008; Oberhaus et al., 1997; Richardson-Burns et al., 2002). Here we show that neonatal mice infected with reovirus T3D display large increases in p150 expression in all brain regions examined, yet the observed increase in p150 affected few editing sites. These findings suggest that steady-state editing patterns for ADAR targets are not primarily regulated by p150 expression levels.
Materials and Methods
Reovirus-infection of neonatal mice
Timed-pregnant dams (C57BL/6J) were purchased from The Jackson Laboratories (Bar Harbor, ME). Litters were divided into mixed-gender groups and treated with either endotoxin-free phosphate-buffered saline (PBS) (Amresco; Solon, OH) or reovirus T3D in PBS (Antar et al., 2009; Furlong et al., 1988). Neonatal pups (2–3 days old) were innoculated by intracranial (IC) injection in the left hemisphere with 5 μl PBS or 102 plaque-forming units (PFU) of T3D reovirus in 5 μl PBS using a 10 μl Hamilton syringe with a 25 gauge needle. Mice were monitored daily until 10–13 days post-infection when a portion of the animals were generally moribund (defined by rapid or shallow breathing, lethargy, or paralysis), and were euthanized (Frierson et al., 2012). Mouse body weights were determined prior to euthanasia. All procedures were carried out in accordance with an IACUC-approved protocol. For determination of viral titer, dissected brain regions were immersed in fresh PBS and homogenized. The viral titer for each tissue sample was performed by plaque assay as described previously (Tyler et al., 1985).
Dissection of brain regions
Mice were euthanized by cervical dislocation under anesthesia before decapitation. Whole brain was removed from the skull and dissections of defined brain regions were performed. After removal of the brain, the olfactory bulbs were removed. Using a straight razor, the frontal cortex was isolated by slicing at approximately 2.3 mm anterior to bregma; the dorsal boundary of the frontal cortex, delineated by the rhinal fissure, was separated and removed from the tissue below it. The hippocampus, including CA1-3 and the dentate gyrus, was subsequently removed by separation of the cerebral hemispheres, using forceps to gently roll out both the right and left hippocampal structures from the surrounding cortex. Finally, the entire cerebellum was removed based on clear physical distinction from the surrounding brain tissue. Each brain region was dissected, weighed and flash frozen in liquid nitrogen prior to storage at −80°C.
RNA characterization
All tissues were homogenized in Trizol® reagent and RNA was isolated following the manufacturer’s instructions (Life Technologies; Grand Island, NY). cDNA synthesis was performed using a High Capacity cDNA Kit with random primers following the manufacturer’s instructions (Applied Biosystems; Foster City, CA). A single antisense riboprobe was designed to differentiate between ADAR1 transcripts encoding the p110 and p150 protein iso-forms (Fig. 3A). A 449 base-pair RT-PCR amplicon encompassing the exon 1B/exon 2 junction of the ADAR1B transcript was cloned into vector pBluescript II KS− (Agilent Technologies; Santa Clara, CA). RNA labeled with [α-32P]-uridine 5′-triphosphate (Perkin Elmer; Boston, MA) was transcribed (specific activity = 2.2 × 10⁶ cpm/mmol) with T3 or T7 RNA polymerase, and ribonuclease protection analyses were performed as 4 described (Emeson et al., 1989). Products were resolved in a denaturing 4–6% polyacrylamide gel containing 8M urea. A cyclophilin antisense probe was also generated as an internal loading control as previously described (nucleotides +34–144, GenBank accession number M19533) (Singh et al., 2007). The relative expression of protected fragments was quantified using a Typhoon 9400 phosphorimager (GE Healthcare, Piscataway, NJ) with ImageQuant TL software and normalized to the number of adenosine residues in each protected fragment.
Figure 3. Widespread increase in ADAR1A RNA expression in response to reovirus infection.

A) A schematic diagram of an antisense riboprobe specific for the ADAR1B mRNA is shown as well as the expected sizes of ribonuclease protection products generated from 1B- and 1A-containing ADAR1 transcripts. B) Ribonuclease protection analysis of total ADAR1 RNA expression in dissected brain regions for individual mice intracranially-injected with PBS (control) or T3D reovirus. Ctx, frontal cortex; Hip, hippocampus; Cbl, cerebellum. The migration positions for protected fragments generated from ADAR1A and ADAR1B RNAs are indicated as well as a cyclophilin loading control. C) Quantification of ribonuclease protection analysis. Band intensities for ADAR1A and ADAR1B RNA isoforms were normalized to the internal cyclophilin control for each dissected brain region. Means ± SEM (n ≥ 5 animals/treatment group) were statistically compared by unpaired t-test; *p ≤ 0.05, ***p ≤ 0.001.
Semi-quantitative analysis of ADAR1 alternative splicing patterns was performed by endpoint RT-PCR using primers in exons 1A (sense, 5′-AATGGATCCGGCACTATGTCTCAAGGG-TTC-3′), 1B (sense, 5′-GCTCTAGAGAGACTACGCGTTGGGACTAGCC-3′) and 2 (antisense, 5′-ATATCTCGAGCCGGAAGTGTGAGCAAAGCCCGT-3′) or exons 6 (sense, 5′-ATGAATCTA-TGGCTCCCAA-3′) and 8 (antisense, 5′ GCTTCAATGCTCTGACCAAC-3′) and amplified for 40 cycles. Viral RNA was detected using reovirus S1 transcript specific primers (sense, 5′-CCTCG-CCTACGTGAAGAAGT-3′; antisense, 5′-AGCACCCAACTGGGTAACAC-3′). Resultant amplicons were resolved on a 2% agarose gel and visualized by ethidium bromide fluorescence, which was quantified using a Syngene gel imager (Cambridge, UK) with Genetools software.
Western blotting analysis
Samples for Western blotting were prepared as described previously (Hummon et al., 2007). Frozen tissue samples were homogenized in TRIzol® reagent. After performing steps for the isolation of nucleic acids, the remaining organic phase was dialyzed against 0.1% SDS for three changes of buffer at 4°C using a dialysis cassette (Thermo-Scientific; Pittsburgh, PA). Protein from samples formed gelatinous clumps that were solubilized in 25 mM Tris-HCl, 4 M Urea, 0.5% SDS, pH 8.0 (Hummon et al., 2007). Residual insoluble material was removed by centrifugation. Protein samples were combined with 4X LDS NuPage sample buffer prior to being resolved by electrophoresis on a 4–12% Bis-Tris Midi gel (Life Technologies). Electrophoresis was followed by semi-dry transfer to a nitrocellulose membrane (Protran; PerkinElmer; Boston, MA), which was blocked with Li-Cor® Odyssey® blocking buffer (Licor Biosciences; Lincoln, NE) or 0.1% non-fat dry milk, and probed with antisera directed against ADAR1 (sc-73408; Santa Cruz Biotechnology; Santa Cruz, CA), ADAR2 (Exalpha Biologicals, Shirley, MA), ADAR3 (sc-73410; Santa Cruz Biotechnology), reovirus protein σNS (Becker et al., 2003), and β-tubulin (sc-9104; Santa Cruz Biotechnology). Washes were performed with 0.1% Tween-20 in TBS at room temperature. Secondary antisera consisted of fluorescently labeled anti-mouse (#926–32212), anti-goat (#926–68024), anti-rabbit (#926–32213), and anti-guinea pig (#926–68030) immunoglobulin (Licor Biosciences; Lincoln, NE). Images were quantified using Li-Cor® Odyssey® software.
High-throughput sequence analysis of editing profiles
RNA editing profiles for ADAR substrates were quantified using next-generation sequencing with a variation of the high-throughput multiplexed transcript analysis (HTMTA) (Morabito et al., 2010) as schematized in Figure 7. First-strand cDNA was synthesized in a 10 μl reaction from 1 μg of RNA using avian myoblastosis virus reverse transcriptase (Promega, Madison, WI) according to the manufacturer’s instructions in a reaction containing 0.25 μg of each substrate-specific primer with either T3 (5′-ATTAACCC-TCACTAAAGGGA-3′) or T7 (5′-TAATACGACTCACTATAGGG-3′) RNA polymerase promoter extensions for the sense and antisense primers, respectively (Supplementary Table 1). Parallel control reactions lacking reverse transcriptase were performed for all samples. The total reverse-transcription volume was included in a 46.5 μl PCR amplification reaction with Phusion DNA polymerase (Finnzymes, Woburn, MA) according to the manufacturer’s recommendations. All reactions were incubated at 98°C for 30s followed by 5 cycles of amplification (98°C for 10s, 55°C for 30s, 72°C for 45s) before addition of 1 μl of exonuclease I (New England Biolabs, Ipswich, MA) and incubated at 37°C for 20 minutes to remove unincorporated, single-stranded primers. Exonuclease I was inactivated by incubation at 80°C for 20 minutes before addition of a universal antisense primer matching the 20 nucleotide (nt) T7 RNA polymerase promoter with a 34-nt adapter sequence that can anneal to the Illumina flowcell surface (Adapter B). One of twenty-four 6-nt barcoded universal sense primers (Supplementary Table 2) matching the calculated as the percentage of edited (G) reads for each substrate divided by the total 20 nt T3 RNA polymerase promoter with a 58-nt adapter sequence (Adapter A) also was added to the reaction (Bentley et al., 2008), which was amplified for an additional 25 cycles (98°C for 15s, 56°C for 30s, 72°c for 60s). Amplified products for each RNA target were pooled, separated in a 2% agarose gel and purified from excised gel slices using the Wizard SV Gel and PCR Purification Kit (Promega, Madison, WI). The concentration of gel-purified fragments was measured by spectrophotometry (A260), and ~20 ng of each sample was pooled with up to 24 other products containing unique barcodes and subjected to single-end sequencing using the Illumina Hi-seq 2000 system (Illumina, San Diego, CA). Total sequence reads obtained per RNA sample (Supplementary Table 3) were culled to an appropriate data set by meeting a series of inclusion criteria including: 1) barcode sequences are identifiable; 2) nucleotides at the editing site(s) are either A or G; and 3) the sequence reads precisely match the number reference sequence(s) (Supplementary Table 2). The extent of editing at each site was of reads (G + A) for each target.
Figure 7. Deep sequencing strategy for multiplex quantification of editing profiles.

A schematic diagram is presented for RT-PCR amplification of a region of an mRNA target flanking an A-to-I editing site (✱). In general, target-specific primers in adjacent exons containing either T3 (blue) or T7 (red) RNA polymerase promoter extensions for the sense and antisense primers, respectively (Supplementary Table 1) were used for PCR amplification (5 cycles) before digestion of the remaining single-stranded primers using Exonuclease I. A second round of amplification (25 cycles) was performed with universal primers in which the oligonucleotide contained sequences matching the T3 promoter, one of 24 unique 6-nt barcode sequences (yellow) for sample identification, as well as an adapter sequence (Adapter A; green) or sequences matching the T7 and an adapter sequence (Adapter B; purple) for high-throughput single-end sequencing on the Illumina platform.
Histochemistry
Phosphate-buffered saline (PBS) and reovirus T3D-injected mice were sacrificed and brains removed as described above. Whole brains were immersion fixed in phosphate-buffered 4% paraformaldehyde/4% sucrose for at least 48 hours and transferred to PBS. Brains were sent to NeuroScience Associates (NSA) Labs (Knoxville, TN) for processing into a ‘brain block’ in which multiple brains are aligned and encased in a gelatin matrix, sliced into 30–40 μM free-floating sections, and stored in cryopreservative solution at −20°C. Sections were rinsed in Tris-buffered saline (TBS) to remove the cryopreservative and antigen retrieval was performed by immersing sections in L.A.B. antigen retrieval solution (Polysciences; Warrington, PA) and incubating at 37°C for 15 minutes. After rinsing in TBS, sections were immersed in 0.6% hydrogen peroxide for 15 minutes to quench endogenous peroxidases, followed by rinsing in TBS and blocking of endogenous biotin using an avidin/biotin blocking kit per manufacturer’s instructions (Vector Labs; Burlingame, CA). Tissues were permeabilized in TBS with 0.4% Triton X-100 for 15–30 minutes. Sections were stained using either antiserum to ADAR1 (goat anti-ADAR1 (C-16); Santa Cruz Biotechnology, Dallas, Texas), antiserum to GFAP (Invitrogen, Grand Island, NY), or biotinylated tomato lectin (Vector Labs; Burlingame, CA). For ADAR1 immunostaining, sections were blocked with 5% normal horse serum for 20 minutes before incubation in ADAR1 antiserum (1:100 in TBS) for 30 minutes. Sections were rinsed in TBS and incubated with horse anti-goat biotinylated antibody (1:600) (Vector Labs; Burlingame, CA) for 30 minutes. GFAP immunehistochemistry was performed with the M.O.M. kit (Vector Labs; Burlingame, CA) for mouse antibodies on mouse tissue as described by the manufacturer. GFAP antiserum was used at a 1:200 dilution. For lectin cytochemistry, sections were blocked using Carbo-Free Block (Vector Labs; Burlingame, CA) per manufacturer’s instructions and incubated for 30 minutes with tomato lectin diluted 1:500 in TBS. For the incorporation of the horseradish peroxidase (HRP), all sections were incubated with A.B.C. reagent using the ELITE A.B.C. kit (Vector Labs, Burlingame, CA) per manufacturer’s instructions. The chromagen substrates diaminobenzidine (DAB) and ImmPact Nova Red (Vector Labs, Burling-ame, CA) were used to visualize peroxidase activity. After incubition with DAB or Nova Red (2–3 minutes), the reaction was halted by rinsing in water for 5 minutes. Sections were mounted onto gelatin subbed glass slides (NSA labs; Knoxville, TN) in acetate buffer (pH 6) and allowed to dry overnight. Sections were then bonded to the slides by placing in 95% ethanol for 1 min, 95% ethanol/37% formalin (9:1 respectively) for 5 minutes, and rinsing in 95% ethanol. Cresyl violet staining was performed by rehydrating slides and incubating in 0.1% cresyl violet solution for 5–10 minutes at 60°C. Slides were rinsed in tap water, dehydrated through alcohol, cleared in xylene and mounted with DPX (Electron Microscopy Services, Hatfield, PA). Staining was visualized using light microscopy.
Results
Widespread CNS infection in response to reovirus treatment
To assess the effects of reo-virus T3D infection on ADAR1 expression and potential changes in RNA editing profiles, neonatal mice (postnatal day 2–3) were administered 100 plaque-forming units (PFU) of virus by intracranial (IC) injection. T3D produces a typical pattern of neurotropism in which neurons are infected primarily within the cortex, thalamus, hippocampus, and cerebellum (Oberhaus et al., 1997). The 50% lethal dose (LD50) of T3D by IC injection is less than 5 PFU/mouse (Mann et al., 2002). Based on patterns of reovirus tropism and the expression of specific ADAR substrates, we focused our analyses on three discrete brain regions, the frontal cortex, hippocampus, and cerebellum. Plaque assays revealed the absence of virus in any brain regions from vehicle (phosphate-buffered saline; PBS)-injected mice (data not shown), yet high viral titers varying from 1.3 × 10⁹–1.7 × 10¹¹ PFU/g tissue were observed in tissue isolated from reovirus-infected animals, demonstrating a robust infection in each brain region (Fig. 2A). While similar viral titers were seen in the hippocampus and cerebellum, the mean viral titer in the frontal cortex was ~100-fold lower (Fig. 2A), despite the fact that this brain region was nearest to the site of viral inoculation, presumably reflecting region specific differences in viral tropism (Oberhaus et al., 1997; Richardson-Burns and Tyler, 2004). At the time of euthanasia (postnatal day 12–13), virus-infected mice were were weak, showed significantly decreased body weight (Fig. 2B), and exhibited choreiform movements and erratic behavior (Dionne et al., 2011b; Tardieu et al., 1983), indicative of advanced encephalitis. As an index of the severity of viral infection, the body weights of T3D-treated animals varied considerably (Fig. 2B), perhaps reflecting the broad range of viral load that differed by up to four orders of magnitude in discrete brain regions from individual mice (Fig. 2A).
Figure 2. Viral titers and body weights of mice infected with T3D reovirus.
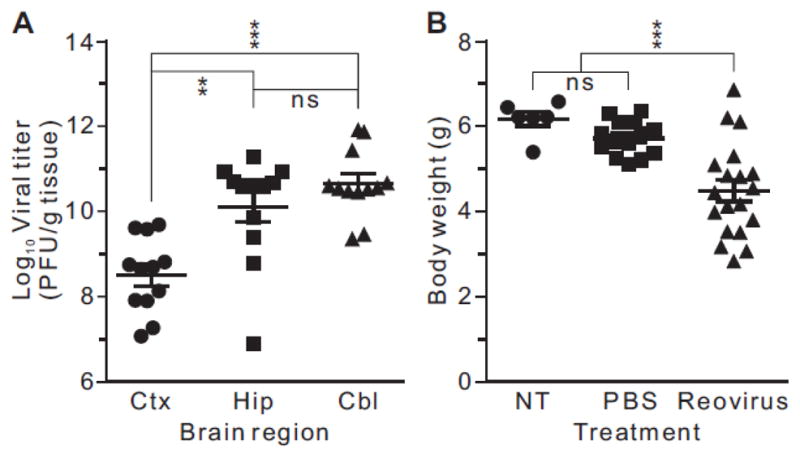
A) Reovirus titers in dissected brain regions (Ctx, frontal cortex; Hip, hippocampus; Cbl, cerebellum) were determined by plaque assay at the time of sacrifice. Means ± SEM (n = 12 for each brain region) were statistically compared by mixed models ANOVA (repeated measures) with Tukey’s adjustment; ns, not significant, **p<0.01, ***p<0.001. B) The body weights of control mice (no treatment) or animals intracranially-injected with PBS or T3D reovirus at postnatal day 2 (P2) were determined at the time of sacrifice (postnatal day 13). Means ± SEM (no treatment, n = 6; PBS, n = 14; reovirus, n = 19) were statistically compared by ANOVA with Dunnett’s multiple comparison test; ns, not significant, ***p<0.001.
ADAR1 alternative splicing patterns are altered in response to reovirus infection
Little information exists about changes in ADAR1 RNA isoform expression in the brain in response to inflammatory stimuli. In a study of mice infected with orally-administered Salmonella, steady-state level of ADAR1A RNA increased dramatically in peripheral organs (e.g., liver), while they increased only slightly in whole brain, with levels staying well below those of the constitutive ADAR1B transcript (George et al., 2005). Since different cascades of cytokines are elicited in response to viral or bacterial infection, the induction of ADAR1A transcripts may be preferentially sensitive to specific cytokine subtypes acting through distinct signaling pathways, as has been observed for other interferon-stimulated genes (ISGs) (Schoggins and Rice, 2011). To quantify potential changes in ADAR1 RNA isoform expression in response to reovirus infection, we employed ribonuclease (RNase) protection and reverse transcription-PCR (RT-PCR) strategies with tissue samples from dissected frontal cortex, hippocampus and cerebellum of T3D and PBS-injected mice. A radiolabeled, antisense riboprobe was generated for RNase protection studies to distinguish between ADAR1 mRNA isoforms containing alternatively spliced interferon-inducible (1A) and constitutively (1B) expressed exons (Fig. 3A). ADAR1A (p150-encoding) transcripts were expressed at a fraction of the level observed for ADAR1B (p110-encoding) transcripts in all brain regions isolated from control (PBS-treated) mice (Figs. 3B, 3C). In sharp contrast, T3D-infected animals showed a robust increase in the steady-state level of ADAR1A mRNAs with no significant change in ADAR1B transcripts. In the frontal cortex, ADAR1A transcripts reached a steady-state level of expression nearly equivalent to that of the ADAR1B mRNAs, while they increased to approximately double that of ADAR1B transcripts in the hippocampus and cerebellum (Figs. 3B, 3C). Comparisons between dissected brain regions from T3D-infected mice revealed that the fold-increase in ADAR1A expression correlated with the viral titer (Fig. 2A), where the smallest (3-fold) and largest (9-fold) changes were observed in the cortex and cerebellum, respectively (Figs. 3B, 3C).
While the RNase protection strategy was effective for quantifying ADAR1 isoform expression in response to reovirus infection (Fig. 3), RNAs containing exon 1C or unspliced ADAR1 pre-mRNA also would be expected to generate a 377 nt protected fragment, although the level of ADAR1C RNA expression is extremely low in the brain (George et al., 2005). We developed a semi-quantitative RT-PCR strategy to more specifically assess changes in ADAR1A and ADAR1B mRNA expression using sense primers specific for exons 1A and 1B with a common antisense primer in exon 2. Results using this approach were in good agreement with the RNase protection strategy (Fig. 3), demonstrating a significant increase in the percentage of ADAR1A mRNA isolated from all brain regions in T3D-infected animals (Fig. 4). ADAR1A transcripts represented less than 10% of the total ADAR1 RNA in PBS-treated control animals, whereas mice infected with reovirus showed a 3.5- to 6-fold increase in ADAR1A levels (Figs. 4A, 4B). In peripheral tissues, ADAR1A transcripts represented the major ADAR1 RNA isoform in control mice (Figs. 4A, 4B). Infection with reovirus significantly increased the percentage of ADAR1A transcripts expressed in the heart. However, since the liver and spleen solely expressed the ADAR1A isoform in control animals, no further increase in the relative ratio of this RNA isoform could be observed in response to viral treatment. Despite introduction of virus by IC administration into the brain, RT-PCR analysis demonstrated the presence of reovirus S1 mRNA in all examined tissues, indicating the spread of viral particles outside the CNS to infect peripheral organs (Fig. 4A) (Boehme et al., 2011; Dionne et al., 2011a; Dionne et al., 2011c).
Figure 4. Semi-quantitative analysis of ADAR1A (p150) and ADAR1B (p110) RNA expression in brain and peripheral tissues.

A) ADAR1 expression was quantified by end-point RT-PCR from multiple tissues in control and reovirus-infected animals using primers in exons 1A, 1B and 2, and the expected migration positions of the PCR amplicons for each alternatively spliced ADAR1 isoform are indicated. The presence of reovirus-derived S1 RNA was also determined. B) Quantification of ADAR1 alternative splicing was assessed by ethidium bromide fluorescence of RT-PCR amplicons. Means ± SEM (n = 4 animals/treatment group) were statistically compared by unpaired t-test; *p<0.05, **p ≤ 0.01, ***p ≤ 0.001.
In addition to alternative splicing events that give rise to transcripts with multiple exon 1 structures, ADAR1 RNA expression is further diversified by competition between alternative 5′-splice sites in exon 7 (Fig. 1). This RNA processing event produces two distinct mRNA isoforms (7a and 7b) that differ by 78 nucleotides to generate ADAR1 proteins that contain or lack a 26-amino acid linker region between the third dsRBM and the catalytic domain in both human and mouse isoforms (Liu et al., 1997; Yang et al., 2003) to affect site-selective editing efficiency of ADAR1 targets (George et al., 2005; Liu et al., 1999a; Liu et al., 1997; Liu and Samuel, 1999a). A rare ADAR1 splicing event, referred to as 7c, results from removal of the entire exon 7 region in mature ADAR1 mRNAs (Yang et al., 2003).
Previous studies have suggested that alternative splicing within exon 7 is sensitive to inflammatory stimuli (Yang et al., 2003). To determine whether reovirus infection modulates alternative splicing of ADAR1 within this region of the pre-mRNA, we used a semi-quantitative RT-PCR strategy to determine the relative ratio of 7a and 7b transcripts in dissected brain regions and peripheral tissues using specific oligonucleotide primers in exons 6 and 8. We found that 7a transcripts represent the predominant ADAR1 RNA species in control animals for all brain regions examined, whereas roughly equivalent levels of 7a and 7b are produced in peripheral organs (Figs. 5A, B). Expression of the 7c RNA isoform was not detected in any samples (data not shown). Reovirus infection resulted in an increase in the relative ratio of 7b to 7a in all brain regions, yet no changes in the relative expression of these isoforms were observed in infected heart, liver or spleen (Figs. 5A, B).
Figure 5. Differential expression of ADAR1 exon 7 splice variants in response to reovirus infection.

A) The expression of ADAR1 isoforms using alternative 5′-splice sites in exon 7 was quantified by end-point RT-PCR from multiple tissues in control and reovirus-infected animals using primers in exons 6 and 8; the expected migration positions of the PCR amplicons for each alternatively spliced ADAR1 isoform are indicated. B) The relative ratio of ADAR1 alternatively spliced isoforms was quantified by ethidium bromide fluorescence of RT-PCR products. Means ± SEM (n = 4 animals/treatment group) were statistically compared by unpaired t-test; *p ≤ 0.05, **p ≤ 0.01.
ADAR1 (p150) protein expression is increased in response to reovirus infection
The absence of changes in ADAR1B mRNA coupled with the observed increase ADAR1A mRNA in virally-infected animals (Figs. 3, 4), predicted parallel effects on the expression of the encoded p110 and p150 protein isoforms. To quantify steady-state levels of ADAR1 proteins in reovirus-infected mice, we employed a Western blotting strategy using a monoclonal ADAR1 antibody directed against a shared region of both proteins comprising all three double-stranded RNA binding domains (Fig. 1). Tissues from control and reovirus-infected animals were homogenized in TRIzol® reagent for the simultaneous isolation of both RNA and protein, as described previously (Hummon et al., 2007), for subsequent ADAR1 isoform analysis. Consistent with the low level of ADAR1A transcripts seen in uninfected animals (Figs. 3, 4), no p150 protein was detected in any brain region examined, although the constitutively-expressed p110 isoform was easily identified in all samples (Fig. 6A, B). In contrast to control mice, the p150 isoform was clearly present in infected samples from all three brain regions where it represented approximately 35% of total ADAR1 protein in the hippocampus and cerebellum and 10% in the cortex (Figs. 6A, B). This relatively low level of p150 in the cortex is consistent with a lower viral titer compared to other brain regions (Fig. 2A) and is also reflected by the absence of detectable expression for the reovirus replication protein σNS (Fig. 6A), despite the fact that a more-sensitive RT-PCR strategy confirmed cortical infection by detection of reovirus S1 RNA transcripts (Fig. 4A). While p150 was not detectable in control animals, the reovirus-mediated change in relative expression shown in Fig. 6B might reflect not only the increase in p150 but also changes in p110 expression. However, when normalized to an internal β-tubulin control, the expression of p110 was not changed in the cortex or cerebellum in response to viral infection, but was significantly increased in the hippocampus (Fig. 6C). While previous studies have indicated that the inflammatory response does not affect ADAR1B or p110 expression (George and Samuel, 1999a; George et al., 2005), increased levels of this protein isoform could reflect region-specific internal translation initiation at AUG249 from increased ADAR1A transcripts (Figs. 3, 4). Western blotting for other ADAR family members, using antisera directed against ADAR2 and ADAR3, revealed no significant changes in expression in the cortex or cerebellum, although a significant decrease for ADAR2 was observed in the hippocampus (Fig. 6C).
Figure 6. Analysis of ADAR protein expression in response to reovirus infection.

A) Representative Western blots of ADAR protein expression in whole cell lysates isolated from dissected brain regions of individual mice are shown; Ctx, frontal cortex; Hip, hippocampus; Cbl, cerebellum. The migration positions for ADAR1 protein isoforms (p150 and p110), ADAR2, ADAR3 and a β-tubulin loading control are shown. Western blotting analysis for a reovirus-specific protein (σNS) is also shown; a non-specific band in the (σNS) blots is indicated by an asterisk. B and C) Quantitative analysis of alterations in ADAR1 isoform expression for control (□) and reovirus-infected (■) mice. Due to the absence of detectable p150 in control animals, data are presented as the percentage of total ADAR1 protein expression represented by p150 (B) or normalized to an internal β-tubulin control (C). Means ± SEM (n = 4 animals/treatment group) were statistically compared by unpaired t-test; *p ≤ 0.05, **p ≤ 0.01, ***p ≤ 0.001.
High-throughput sequencing reveals few editing changes in reovirus-infected tissues
Increases in the editing of ADAR1 substrates occur in response to IFN in glioblastoma cell lines. IFN significantly increases the editing of RNAs encoding the DNA-repair enzyme NEIL1 (Yeo et al., 2010), and selectively increases p150 protein expression, concomitant with an increase in the editing of ADAR1 sites and a decrease in the editing of ADAR2 sites within transcripts encoding the 2C-subtype of serotonin (5HT2C) receptor (Yang et al., 2004). Observed decreases in ADAR2-directed editing, with no change in steady-state ADAR2 expression, may represent an antagonistic relationship between ADAR1 and ADAR2 activity (Cenci et al., 2008; Wang et al., 2004; Yang et al., 2004) resulting from their ability to form heterodimers (Valente and Nishikura, 2007) or non-productively compete for binding to a single RNA target (Cenci et al., 2008; Singh et al., 2007).
To quantify potential changes in RNA editing profiles in response to reovirus infection in the murine CNS, we developed a high-throughput sequencing approach to simultaneously analyze a wide variety of ADAR substrates in infected and control samples from frontal cortex, hippocampus and cerebellum based upon a strategy previously developed in our laboratory for multiplex analysis of editing patterns for 5HT2C RNAs (Morabito et al., 2010). To minimize the number of synthetic oligonucleotide primers necessary for simultaneous analysis of multiple RNA targets, we modified our previous approach to include two amplification steps as schematized in Figure 7. Target-specific primers were used for five cycles of amplification for each substrate and to incorporate sequences for T3 and T7 RNA polymerase promoters into the 5′- and 3′-ends of the RT-PCR amplicons, respectively (Suppl. Table 1). Following exonuclease I digestion to remove unincorporated PCR primers, a second round of PCR amplification was performed with universal primers matching the T3 and T7 sequences to further amplify the targets and incorporate both adapter sequences necessary for single-end sequencing on the Illumina platform (Bentley et al., 2008) and one of 24 index (barcode) sequences allowing for multiplex analysis (Suppl. Table 2). The barcodes consisted of 6-nt sequences that allowed unambiguous identification of a sample with up to two sequencing errors within the barcode itself. The sequencing data were culled to an appropriate dataset ranging from approximately 21,000 to 1,000,000 reads (Suppl. Table 3) that met a series of inclusion criteria (see Experimental Methods) when compared to a reference sequence for each substrate (Suppl. Table 4). The extent of editing at each site was calculated as the percentage of edited (G) reads for each substrate divided by the total number of reads (G + A) for each target.
For each brain region, we quantified editing for 12 transcripts, many of which encode proteins that are important for nervous system function (Hood and Emeson, 2012; Rula and Emeson, 2007). The percentage of site-selective editing for each substrate in control and reovirus-infected animals is summarized in Table 1. Surprisingly, high-throughput sequencing revealed few significant changes in editing between RNAs isolated from PBS- and reovirus-treated animals. The extent of inter-animal variability was quite low due to the large number of sequence reads for each ADAR substrate. Small, but significant, reovirus-dependent alterations in editing for cytoplasmic FMR1 interacting protein 2 (Cyfip2) and filamin A (Flna) in the hippocampus and bladder cancer-associated protein (Blcap) in the cortex were observed. While no significant changes in editing were observed at any of the five sites within 5HT2C tran-scripts (Table 1), combinatorial editing at these five positions can generate up to 32 mRNA isoforms encoding 24 different receptor proteins (Burns et al., 1997; Niswender et al., 1998). To further assess reovirus-mediated changes in 5HT2C editing profiles, we examined the relative abundance of each of the 32 predicted mRNA isoforms isolated from control and T3D-infected animals (Fig. 8). The pattern of editing for 5HT2C transcripts in control animals was similar to that previously described using high-throughput sequencing strategies where the major RNA isoform in the mouse encoded valine, asparagine and valine (VNV) at amino acid positions 156, 158 and 160 of the receptor protein (Abbas et al., 2010; Morabito et al., 2010). While there were significant changes in a limited subset of mRNA isoforms, the absolute magnitude of the changes was modest and the mRNA isoform distribution was largely maintained despite widespread reovirus infection throughout all three brain regions.
Table 1.
Quantitative analysis of RNA editing patterns in brain regions from control (PBS) and reovirus-infected mice
| % Editing | ||||||||
|---|---|---|---|---|---|---|---|---|
|
| ||||||||
| Transcript | Gen name | Editing site | Cerebellum | Hippocampus | Cortex | |||
| PBS | reovirus | PBS | reovirus | PBS | reovirus | |||
| Bladder cancer associated protein | Blcap | Y/C | 44.21 ± 0.22 | 46.56 ± 3.23 | 45.22 ± 1.16 | 45.98 ± 2.74 | 48.12 ± 0.22 | 49.32 ± 0.41 |
| Q/R | 30.64 ± 0.17 | 33.04 ± 3.05 | 32.56 ± 1.25 | 33.73 ± 3.23 | 36.73 ± 0.26 | 38.44 ± 0.88 | ||
| K/R | 10.10 ± 0.27 | 11.69 ± 1.37 | 18.33 ± 1.01 | 19.31 ± 2.09 | 21.98 ± 0.08 | *23.75 ± 1.36 | ||
|
| ||||||||
| Ca2+-dependent secretion activator | Cadps | E/G | 9.23 ± 0.21 | 10.06 ± 0.75 | 17.65 ± 0.12 | 18.50 ± 0.86 | 23.51 ± 0.81 | 22.87 ± 0.37 |
|
| ||||||||
| Cytoplasmic FMR1 interacting protein 2 | Cyfip2 | K/E | 54.86 ± 0.62 | 55.30 ± 2.78 | 59.35 ± 0.35 | *57.46 ± 0.61 | 62.52 ± 0.12 | 61.78 ± 0.79 |
|
| ||||||||
| Filamin A, alpha | Flna | Q/R | 21.86 ± 0.44 | 18.04 ± 1.51 | 27.43 ± 1.74 | *15.19 ± 3.28 | 22.50 ± 0.36 | 23.07 ± 1.11 |
|
| ||||||||
| γ-aminobutyric acid A receptor, alpha 3 | Gabra3 | I/M | 69.60 ± 1.77 | 69.87 ± 2.12 | 72.93 ± 1.40 | 72.63 ± 1.24 | 86.20 ± 0.50 | 86.87 ± 0.49 |
|
| ||||||||
| Glutamate receptor, ionotropic, AMPA 2 | Gria2 | Q/R | 99.89 ± 0.01 | 99.89 ± 0.01 | 99.92 ± 0.00 | 99.92 ± 0.01 | 99.92 ± 0.00 | 99.92 ± 0.00 |
| R/G | 67.99 ± 0.29 | 68.62 ± 1.91 | 51.93 ± 0.58 | 53.37 ± 1.47 | 67.23 ± 0.36 | 69.63 ± 1.86 | ||
|
| ||||||||
| Glutamate receptor, ionotropic, AMPA 4 | Gria4 | R/G | 34.05 ± 0.37 | 40.12 ± 3.95 | 69.17 ± 0.49 | 69.50 ± 2.22 | 77.16 ± 0.41 | 74.58 ± 3.94 |
|
| ||||||||
| Glutamate receptor, ionotropic, kainate 1 | Grik1 | Q/R | 41.70 ± 1.01 | 42.29 ± 1.73 | 53.61 ± 0.94 | 54.46 ± 1.06 | 56.58 ± 0.12 | 57.68 ± 1.95 |
|
| ||||||||
| Glutamate receptor, ionotropic, kainate 2 | Grik2 | Q/R | 87.26 ± 0.86 | 87.35 ± 1.66 | 80.70 ± 0.66 | 79.04 ± 3.86 | 80.35 ± 2.34 | 83.84 ± 2.39 |
|
| ||||||||
| 5-hydroxytryptamine (serotonin) receptor 2C | Htr2c | A | 59.18 ± 3.08 | 69.57 ± 5.30 | 75.52 ± 2.24 | 78.67 ± 5.93 | 87.55 ± 0.25 | 85.29 ± 1.23 |
| B | 50.65 ± 2.73 | 61.38 ± 5.26 | 67.09 ± 2.28 | 69.96 ± 6.11 | 78.70 ± 0.58 | 77.10 ± 0.78 | ||
| E | 4.45 ± 0.63 | 7.60 ± 1.41 | 3.28 ± 0.11 | 3.41 ± 0.36 | 5.23 ± 0.18 | 8.34 ± 3.70 | ||
| C | 24.07 ± 0.26 | 27.53 ± 3.45 | 23.52 ± 0.53 | 24.46 ± 1.23 | 26.35 ± 0.61 | 28.98 ± 2.40 | ||
| D | 66.35 ± 1.10 | 63.81 ± 5.34 | 60.29 ± 0.96 | 59.40 ± 1.07 | 60.15 ± 0.55 | 61.50 ± 1.54 | ||
|
| ||||||||
| Insulin-like growth factor binding protein 7 | Igfbp7 | R/G | 43.12 ± 0.41 | 42.98 ± 1.59 | 53.05 ± 1.21 | 46.60 ± 2.37 | 49.41 ± 1.42 | 49.00 ± 1.27 |
|
| ||||||||
| Potassium voltage-gated channel, shaker-related subfamily, member 1 | Kcna | I/V | 24.18 ± 1.44 | 21.78 ± 0.95 | 14.88 ± 0.43 | 13.13 ± 0.74 | 16.68 ± 0.45 | 15.01 ± 0.61 |
For each transcript, the percentage of RNAs with the indicated site-specific A-to-I editing event is indicated (Means ± SEM; n = 4 animals/treatment group);
p< 0.05 by unpaired t-test.
Figure 8. Analysis of brain region-specific 5HT2C RNA editing to reo-profiles in response virus infection.

Editing profiles in dissected brain regions were determined by high-throughput sequence analysis (see Figure 7) and the thirty-two possible 5HT2C RNA isoforms resulting from RNA editing are represented as the percentage of total 5HT2C sequence reads (see Supplementary Table 3) for control (□) or reovirus-infected (■) animals. Means ± SEM (n≥4) were statistically compared by unpaired t-test; *p<0.05, ***p<0.001.
Increased ADAR1 (p150) in infected brain regions is not coexpressed with infiltrating inflammatory cells
The observation that increased ADAR1 (p150) expression does not result in significant changes in RNA editing profiles raises the possibility that elevated p150 levels may not occur in cells expressing the largely neuron-specific editing substrates quantified in our studies. A critical component of the CNS response to reovirus infection is innate immunity involving the activation and infiltration of glial cells, including microglia, the resident macrophage cell population of myeloid lineage (Chan et al., 2007; Napoli and Neumann, 2009), and astrocytes, key mediators of neuroinflammation and neuronal homeostasis (Frank-Cannon et al., 2009; Fuller et al., 2010). To determine whether reovirus-mediated increases in ADAR1A RNA and ADAR1 (p150) protein expression originated in infiltrating inflammatory cells, we used immunohistochemical and cytochemical approaches to compare the patterns of ADAR1 expression with the location of microglia and astrocytes in infected brain regions. ADAR1 immunoreactivity was detected predominantly in the Purkinje cell layer of the cerebellum in both PBS and reovirus-treated animals, although the number of detectable immunopositive cells and the intensity of labeling was significantly increased in the T3D-infected samples (Fig. 9A, B). Microglia were selectively labeled in brain sections from control and reovirus-treated animals using tomato lectin, a protein lectin with specific affinity for poly-N-acetyl lactosamine sugars that are found on the plasma membrane and in the cytoplasm of microglia, as well as blood vessels (Villacampa et al., 2013). Visualization of microglia with tomato lectin revealed few glial cells in control animals (Fig. 9C) in contrast to robust glial infiltration in infected tissue throughout all cerebellar layers, including the white matter, granule cell layer, Purkinje cell layer, and molecular layer (Fig. 9D). Although there was a partial overlap between the pattern of tomato lectin staining and ADAR1 expression in the Purkinje layer, this is not unexpected since one of the principal roles of activated microglia is to phagocytize infected neurons (Schittone et al., 2012). Astrocytes are also a critical supportive cell type for neuronal function and can be identified by the expression of the distinct intermediate filament, glial fibrillary acidic protein (GFAP). Immunohistochemical labeling for GFAP revealed a strong astrocyte presence in the white matter of PBS-injected animals (Fig. 9E) while astrocytes in reovirus-infected tissue were observed in both the white matter and infiltrating the granule cell layer (Fig. 9F). The absence of significant coexpression between ADAR1 and microglia/astrocyte markers in the cerebellum and other infected brain regions (data not shown), suggests that a majority of the observed increase in ADAR1A RNA and ADAR1 (p150) expression does not originate in these cellular components of innate immunity in the CNS.
Figure 9. Immunohistochemical analysis of ADAR1 expression in reovirus-infected cere-bella.

Coronal sections of cerebellum (30 μm) from PBS and reovirus-inoculated mice were labeled for ADAR1 expression along with microglia and astrocytes. A and B) ADAR1 immuno-reactivity (arrow heads) in the Purkinje cell layer (PL) from PBS and reovirus–infected animals. C and D) Cytochemical visualization of microglia using biotinylated tomato lectin. E and F) Immunolocalization of astrocytes (arrow heads) in the cerebella of control and reovirus–infected mice using an antiserum directed against glial fibrillary acidic protein (GFAP). All tissue sections were counterstained with cresyl violet to reveal cerebellar morphology. The scale bar for all panels (A–F) is presented at the bottom right in panel F; white matter (WM), granule cell layer (GL), Purkinje cell layer (PL), molecular layer (ML).
Discussion
The complexity of the CNS depends upon numerous cellular strategies for the maintenance of proper patterns of gene expression. The conversion of adenosine-to-inosine by RNA editing has been shown to represent a critical post-transcriptional mechanisms for generating multiple, functionally distinct protein isoforms from a single genomic locus (Hood and Emeson, 2012; Mallela and Nishikura, 2012). ADAR1 (p150) is induced in response to interferon challenge or pathogen infection (Heale et al., 2010; Patterson and Samuel, 1995; Rabinovici et al., 2001; Toth et al., 2006; Weier et al., 1995; Yang et al., 2004) and most studies have focused on experiments performed in vitro, where they examined the editing of specific viral RNAs, the cellular mechanisms of p150 induction, or its role in interferon signaling pathways (Gelinas et al., 2011; George et al., 2008; Pfaller et al., 2011). However, less is known about inflammation in the brain and how it may contribute to the pathophysiology of neuropsychiatric disorders (Lukasz et al., 2013; Makhija and Karunakaran, 2013; Venkatasubramanian and Debnath, 2013). For example, development of depression and anxiety frequently occurs as a side effect of chronic IFN therapy. Remarkably, these effects often are alleviated upon cessation of treatment (Dieperink et al., 2000; Myint et al., 2009; Udina et al., 2013). Aberrant editing of transcripts encoding the 5HT2C receptor has been associated with depression, anxiety, and schizophrenia (Gurevich et al., 2002; Niswender et al., 2001; Schmauss, 2003; Sodhi et al., 2005). While studies using tissue culture model systems have demonstrated an increase in p150 expression and changes in 5HT2C editing patterns in response to interferon stimulation (Yang et al., 2004), no data have been available concerning whether similar changes in ADAR1 expression or editing patterns are observed in the CNS under inflammatory conditions.
Since the IFN-inducible ADAR1 (p150) isoform is absent from all brain regions examined in control animals (Fig. 6), it is unlikely that this isoform plays a major role in determining normal patterns of editing for many ADAR targets in the CNS. However, p150 may be involved in dynamic editing changes in response to inflammatory stimuli. To test this hypothesis, we quantified changes in the expression pattern of ADAR1 isoforms after direct infection with reovirus T3D and found an increase in the steady-state level of ADAR1A transcripts (Figs. 3, 4) with a robust increase in p150 protein expression in reovirus-infected mice (Fig. 6). This finding is in contrast to a previous study that found increased ADAR1A transcript levels in peripheral tissues in response to Salmonella infection, whereas only a slight increase was observed in the brain (George et al., 2005). This disparity could result from differences between bacterial and viral infection that can produce distinct cytokine cascades (Schoggins and Rice, 2011) or different routes of pathogen inoculation in the two studies.
ADAR1 is implicated in the site-selective editing of numerous RNA substrates throughout the brain (Lehmann and Bass, 2000; Riedmann et al., 2008). If ADAR1 expression levels represent a rate-limiting step in the regulation of editing patterns for specific RNA substrates, then elevated p150 expression levels observed in response to reovirus infection should result in an increase in the editing of endogenous substrates. However, high-throughput sequence analysis of numerous ADAR targets identified few significant changes in editing profiles (Table 1). While this result was unexpected, various possibilities could explain such an experimental outcome. Such explanations include a lack of significant spatial overlap between the cell-specific expression pattern for the ADAR substrates that were examined (Table 1) and those cells in which p150 was selectively increased, including cells of the innate immune response. However, coexpression analysis of ADAR1 expression in control and reovirus-infected tissues demonstrated little overlap between neurons expressing ADAR1 and infiltrating microglia or astrocytes (Fig. 9)
While both p150 and p110 are active in the editing of ADAR targets in transfected cells and demonstrate similar target specificity (Liu et al., 1999b; Liu and Samuel, 1999b), limited data are available to demonstrate distinct roles for these ADAR1 isoforms in the editing of endogenous substrates. As p110 is the major ADAR1 isoform expressed in the brain under control conditions, it is likely that this isoform is responsible for the normal patterns of ADAR1-dependent editing seen in the nervous system. It is unclear what role p150 plays in the editing of endogenous RNA substrates, as it resides primarily in the cytoplasm at steady-state (Eckmann et al., 2001; Fritz et al., 2009; Patterson and Samuel, 1995; Strehblow et al., 2002), while most ADAR targets are modified in the nucleus prior to splicing (Bratt and Ohman, 2003; Ryman et al., 2007).
While the subcellular localization of p150 could affect its capacity to edit pre-mRNA targets in the nucleus, expression levels for the ADAR enzymes generally do not correlate with the extent of site-selective editing. For example, RNA transcripts encoding the GluR-2 subunit of the amino-3-hydroxy-5-methyl-4-isoxazolepropionic acid (AMPA)-subtype of glutamate receptor are edited (Q/R site) to near completion by embryonic day 15 when no specific immunoreactivity for ADAR2 could be detected within the forebrain (Jacobs et al., 2009). Similarly, ADAR1 and ADAR2 expression remained constant, both in developing rat brain and cultured cortical neurons, while the extent of editing for their respective sites increased markedly (Hang et al., 2008). The observed lack of correlation between editing efficiency and ADAR expression suggests that other cellular mechanisms may be involved in the determination of RNA editing patterns. Recently, proteins that act as positive and negative regulators of ADAR2 editing activity have been identified which are thought to act by affecting ADAR2 subcellular localization and stability (Garncarz et al., 2013; Marcucci et al., 2011; Tariq et al., 2013). ADAR1 is modified by sumoylation, resulting in decreased activity in vitro (Desterro et al., 2005). It is possible that ADAR1 editing activity also is modulated by other cellular processes or additional protein components similar to those identified for ADAR2.
Unique properties of individual substrates modified by A-to-I conversion also add another layer of complexity to editing regulation. ADAR substrates in Drosophila melanogaster (dADAR) appear to fall into “high” or “low” categories based upon structure and sequence determinants that affect their intrinsic ability to be selectively deaminated (Jepson et al., 2011). Higher levels of dADAR are required for the editing of “low efficiency sites”, whereas low levels of enzyme can effectively edit “high efficiency” sites. These findings point to complex, multi-layered cellular mechanisms modulating ADAR activity that could explain why little change in editing was observed despite a robust reovirus-mediated increase in expression of the p150 protein (Fig. 6). In fact, it is remarkable that normal editing levels can be maintained across a wide range of editing sites in multiple brain regions despite widespread virus infection and large increases in the expression of what is generally considered to be a key A-to-I editing enzyme.
Genetically-modified mice in which the expression of p150 is selectively ablated do not survive beyond embryonic day 11.5 (Ward et al., 2011), similar to mice lacking total ADAR1 expression (Wang et al., 2004), demonstrating that the p150 isoform is essential for viability. However, because editing levels were not assessed in these animals, it remains unknown what distinct function, if any, p150 serves in the editing of specific RNA targets. As p150 has been implicated in numerous cellular activities which are either editing-independent or involve unknown substrates (Cai et al., 2010; Herbert et al., 2002; Nie et al., 2005; Wang et al., 2006; Wang and Samuel, 2009; Zhang and Rabinovici, 2007), the precise functional role(s) for this ADAR1 isoform remain to be elucidated.
Supplementary Material
Acknowledgments
We are grateful to Drs. Annie Antar (Johns Hopkins University; Baltimore, MD) and Karl Boehme (University of Arkansas for Medical Sciences; Little Rock, AR) for performing reovirus inoculations and sharing technical expertise. We also wish to thank Dr. Travis Clark (Vanderbilt University; Nashville, TN) for his help in the design of index sequences (bar-codes) for high-throughput sequencing analysis. Immunohistochemistry experiments were performed in part through the use of the VUMC Cell Imaging Shared Resource.
Financial support: This work was supported by Public Health Service awards to the Vanderbilt Silvio O. Conte Center for Neuroscience Research (P50 MH096972; R.B.E.), R37 AI38296 (T.S.D.), the Vanderbilt Institute for Clinical and Translational Research (UL1 RR024975), the Vanderbilt-Ingram Cancer Center (CA68485) and the Vanderbilt Joel G. Hardman Chair in Pharmacology (R.B.E.).
Footnotes
Publisher's Disclaimer: This is a PDF file of an unedited manuscript that has been accepted for publication. As a service to our customers we are providing this early version of the manuscript. The manuscript will undergo copyediting, typesetting, and review of the resulting proof before it is published in its final citable form. Please note that during the production process errors may be discovered which could affect the content, and all legal disclaimers that apply to the journal pertain.
References
- Abbas AI, Urban DJ, Jensen NH, Farrell MS, Kroeze WK, Mieczkowski P, Wang Z, Roth BL. Assessing serotonin receptor mRNA editing frequency by a novel ultra high-throughput sequencing method. Nucleic acids research. 2010;38:e118. doi: 10.1093/nar/gkq107. [DOI] [PMC free article] [PubMed] [Google Scholar]
- Antar AA, Konopka JL, Campbell JA, Henry RA, Perdigoto AL, Carter BD, Pozzi A, Abel TW, Dermody TS. Junctional adhesion molecule-A is required for hematogenous dissemination of reovirus. Cell host & microbe. 2009;5:59–71. doi: 10.1016/j.chom.2008.12.001. [DOI] [PMC free article] [PubMed] [Google Scholar]
- Athanasiadis A. Zalpha-domains: at the intersection between RNA editing and innate immunity. Semin Cell Dev Biol. 2012;23:275–280. doi: 10.1016/j.semcdb.2011.11.001. [DOI] [PubMed] [Google Scholar]
- Balik A, Penn AC, Nemoda Z, Greger IH. Activity-regulated RNA editing in select neuronal subfields in hippocampus. Nucleic acids research. 2013;41:1124–1134. doi: 10.1093/nar/gks1045. [DOI] [PMC free article] [PubMed] [Google Scholar]
- Becker MM, Peters TR, Dermody TS. Reovirus sigma NS and mu NS proteins form cytoplasmic inclusion structures in the absence of viral infection. Journal of virology. 2003;77:5948–5963. doi: 10.1128/JVI.77.10.5948-5963.2003. [DOI] [PMC free article] [PubMed] [Google Scholar]
- Bentley DR, Balasubramanian S, Swerdlow HP, Smith GP, Milton J, Brown CG, Hall KP, Evers DJ, Barnes CL, Bignell HR, Boutell JM, Bryant J, Carter RJ, Keira Cheetham R, Cox AJ, Ellis DJ, Flatbush MR, Gormley NA, Humphray SJ, Irving LJ, Karbelashvili MS, Kirk SM, Li H, Liu X, Maisinger KS, Murray LJ, Obradovic B, Ost T, Parkinson ML, Pratt MR, Rasolonjatovo IM, Reed MT, Rigatti R, Rodighiero C, Ross MT, Sabot A, Sankar SV, Scally A, Schroth GP, Smith ME, Smith VP, Spiridou A, Torrance PE, Tzonev SS, Vermaas EH, Walter K, Wu X, Zhang L, Alam MD, Anastasi C, Aniebo IC, Bailey DM, Bancarz IR, Banerjee S, Barbour SG, Baybayan PA, Benoit VA, Benson KF, Bevis C, Black PJ, Boodhun A, Brennan JS, Bridgham JA, Brown RC, Brown AA, Buermann DH, Bundu AA, Burrows JC, Carter NP, Castillo N, Chiara ECM, Chang S, Neil Cooley R, Crake NR, Dada OO, Diakoumakos KD, Dominguez-Fernandez B, Earnshaw DJ, Egbujor UC, Elmore DW, Etchin SS, Ewan MR, Fedurco M, Fraser LJ, Fuentes Fajardo KV, Scott Furey W, George D, Gietzen KJ, Goddard CP, Golda GS, Granieri PA, Green DE, Gustafson DL, Hansen NF, Harnish K, Haudenschild CD, Heyer NI, Hims MM, Ho JT, Horgan AM, Hoschler K, Hurwitz S, Ivanov DV, Johnson MQ, James T, Huw Jones TA, Kang GD, Kerelska TH, Kersey AD, Khrebtukova I, Kindwall AP, Kingsbury Z, Kokko-Gonzales PI, Kumar A, Laurent MA, Lawley CT, Lee SE, Lee X, Liao AK, Loch JA, Lok M, Luo S, Mammen RM, Martin JW, McCauley PG, McNitt P, Mehta P, Moon KW, Mullens JW, Newington T, Ning Z, Ling Ng B, Novo SM, O’Neill MJ, Osborne MA, Osnowski A, Ostadan O, Paraschos LL, Pickering L, Pike AC, Chris Pinkard D, Pliskin DP, Podhasky J, Quijano VJ, Raczy C, Rae VH, Rawlings SR, Chiva Rodriguez A, Roe PM, Rogers J, Rogert Bacigalupo MC, Romanov N, Romieu A, Roth RK, Rourke NJ, Ruediger ST, Rusman E, Sanches-Kuiper RM, Schenker MR, Seoane JM, Shaw RJ, Shiver MK, Short SW, Sizto NL, Sluis JP, Smith MA, Ernest Sohna Sohna J, Spence EJ, Stevens K, Sutton N, Szajkowski L, Tregidgo CL, Turcatti G, Vandevondele S, Verhovsky Y, Virk SM, Wakelin S, Walcott GC, Wang J, Worsley GJ, Yan J, Yau L, Zuerlein M, Mullikin JC, Hurles ME, McCooke NJ, West JS, Oaks FL, Lundberg PL, Klenerman D, Durbin R, Smith AJ. Accurate whole human genome sequencing using reversible terminator chemistry. Nature. 2008;456:53–59. doi: 10.1038/nature07517. [DOI] [PMC free article] [PubMed] [Google Scholar]
- Berg KA, Clarke WP, Cunningham KA, Spampinato U. Fine-tuning serotonin2c receptor function in the brain: molecular and functional implications. Neuropharmacology. 2008;55:969–976. doi: 10.1016/j.neuropharm.2008.06.014. [DOI] [PMC free article] [PubMed] [Google Scholar]
- Boehme KW, Frierson JM, Konopka JL, Kobayashi T, Dermody TS. The reovirus sigma1s protein is a determinant of hematogenous but not neural virus dissemination in mice. Journal of virology. 2011;85:11781–11790. doi: 10.1128/JVI.02289-10. [DOI] [PMC free article] [PubMed] [Google Scholar]
- Bratt E, Ohman M. Coordination of editing and splicing of glutamate receptor pre-mRNA. RNA. 2003;9:309–318. doi: 10.1261/rna.2750803. [DOI] [PMC free article] [PubMed] [Google Scholar]
- Burd CG, Dreyfuss G. Conserved structures and diversity of functions of RNA-binding proteins. Science. 1994;265:615–621. doi: 10.1126/science.8036511. [DOI] [PubMed] [Google Scholar]
- Burns CM, Chu H, Rueter SM, Hutchinson LK, Canton H, Sanders-Bush E, Emeson RB. Regulation of serotonin-2C receptor G-protein coupling by RNA editing. Nature. 1997;387:303–308. doi: 10.1038/387303a0. [DOI] [PubMed] [Google Scholar]
- Cai L, Li Y, Liu F, Zhang W, Huo B, Zheng W, Ding R, Guo J, Zhao Q, Dou K. The influence of ADAR1’s regulation on lymphocyte cell function during rejection. Mol Biol Rep. 2010;37:2703–2709. doi: 10.1007/s11033-009-9804-z. [DOI] [PubMed] [Google Scholar]
- Cenci C, Barzotti R, Galeano F, Corbelli S, Rota R, Massimi L, Di Rocco C, O’Connell MA, Gallo A. Down-regulation of RNA editing in pediatric astrocytomas: ADAR2 editing activity inhibits cell migration and proliferation. J Biol Chem. 2008;283:7251–7260. doi: 10.1074/jbc.M708316200. [DOI] [PubMed] [Google Scholar]
- Chan WY, Kohsaka S, Rezaie P. The origin and cell lineage of microglia: new concepts. Brain research reviews. 2007;53:344–354. doi: 10.1016/j.brainresrev.2006.11.002. [DOI] [PubMed] [Google Scholar]
- Danthi P, Coffey CM, Parker JS, Abel TW, Dermody TS. Independent regulation of reovirus membrane penetration and apoptosis by the mu1 phi domain. PLoS pathogens. 2008;4:e1000248. doi: 10.1371/journal.ppat.1000248. [DOI] [PMC free article] [PubMed] [Google Scholar]
- Danthi P, Holm GH, Stehle T, Dermody TS. Reovirus receptors, cell entry, and proapoptotic signaling. Advances in experimental medicine and biology. 2013;790:42–71. doi: 10.1007/978-1-4614-7651-1_3. [DOI] [PMC free article] [PubMed] [Google Scholar]
- Der SD, Zhou A, Williams BR, Silverman RH. Identification of genes differentially regulated by interferon alpha, beta, or gamma using oligonucleotide arrays. Proceedings of the National Academy of Sciences of the United States of America. 1998;95:15623–15628. doi: 10.1073/pnas.95.26.15623. [DOI] [PMC free article] [PubMed] [Google Scholar]
- Desterro JM, Keegan LP, Jaffray E, Hay RT, O’Connell MA, Carmo-Fonseca M. SUMO-1 modification alters ADAR1 editing activity. Molecular biology of the cell. 2005;16:5115–5126. doi: 10.1091/mbc.E05-06-0536. [DOI] [PMC free article] [PubMed] [Google Scholar]
- Dieperink E, Willenbring M, Ho SB. Neuropsychiatric symptoms associated with hepatitis C and interferon alpha: A review. The American journal of psychiatry. 2000;157:867–876. doi: 10.1176/appi.ajp.157.6.867. [DOI] [PubMed] [Google Scholar]
- Dionne KR, Galvin JM, Schittone SA, Clarke P, Tyler KL. Type I interferon signaling limits reoviral tropism within the brain and prevents lethal systemic infection. Journal of neurovirology. 2011a;17:314–326. doi: 10.1007/s13365-011-0038-1. [DOI] [PMC free article] [PubMed] [Google Scholar]
- Dionne KR, Leser JS, Lorenzen KA, Beckham JD, Tyler KL. A brain slice culture model of viral encephalitis reveals an innate CNS cytokine response profile and the therapeutic potential of caspase inhibition. Experimental neurology. 2011b;228:222–231. doi: 10.1016/j.expneurol.2011.01.006. [DOI] [PMC free article] [PubMed] [Google Scholar]
- Dionne KR, Leser JS, Lorenzen KA, Beckham JD, Tyler KL. A brain slice culture model of viral encephalitis reveals an innate CNS cytokine response profile and the therapeutic potential of caspase inhibition. Experimental neurology. 2011c;228:222–231. doi: 10.1016/j.expneurol.2011.01.006. [DOI] [PMC free article] [PubMed] [Google Scholar]
- Eckmann CR, Neunteufl A, Pfaffstetter L, Jantsch MF. The human but not the Xenopus RNA-editing enzyme ADAR1 has an atypical nuclear localization signal and displays the characteristics of a shuttling protein. Mol Biol Cell. 2001;12:1911–1924. doi: 10.1091/mbc.12.7.1911. [DOI] [PMC free article] [PubMed] [Google Scholar]
- Emeson RB, Hedjran F, Yeakley JM, Guise JW, Rosenfeld MG. Alternative production of calcitonin and CGRP mRNA is regulated at the calcitonin-specific splice acceptor. Nature. 1989;341:76–80. doi: 10.1038/341076a0. [DOI] [PubMed] [Google Scholar]
- Fierro-Monti I, Mathews MB. Proteins binding to duplexed RNA: one motif, multiple functions. Trends in biochemical sciences. 2000;25:241–246. doi: 10.1016/s0968-0004(00)01580-2. [DOI] [PubMed] [Google Scholar]
- Frank-Cannon TC, Alto LT, McAlpine FE, Tansey MG. Does neuroinflammation fan the flame in neurodegenerative diseases? Molecular neurodegeneration. 2009;4:47. doi: 10.1186/1750-1326-4-47. [DOI] [PMC free article] [PubMed] [Google Scholar]
- Frierson JM, Pruijssers AJ, Konopka JL, Reiter DM, Abel TW, Stehle T, Dermody TS. Utilization of sialylated glycans as coreceptors enhances the neurovirulence of serotype 3 reovirus. Journal of virology. 2012;86:13164–13173. doi: 10.1128/JVI.01822-12. [DOI] [PMC free article] [PubMed] [Google Scholar]
- Fritz J, Strehblow A, Taschner A, Schopoff S, Pasierbek P, Jantsch MF. RNA-regulated interaction of transportin-1 and exportin-5 with the double-stranded RNA-binding domain regulates nucleocytoplasmic shuttling of ADAR1. Mol Cell Biol. 2009;29:1487–1497. doi: 10.1128/MCB.01519-08. [DOI] [PMC free article] [PubMed] [Google Scholar]
- Fuller S, Steele M, Munch G. Activated astroglia during chronic inflammation in Alzheimer’s disease--do they neglect their neurosupportive roles? Mutation research. 2010;690:40–49. doi: 10.1016/j.mrfmmm.2009.08.016. [DOI] [PubMed] [Google Scholar]
- Furlong DB, Nibert ML, Fields BN. Sigma 1 protein of mammalian reoviruses extends from the surfaces of viral particles. Journal of virology. 1988;62:246–256. doi: 10.1128/jvi.62.1.246-256.1988. [DOI] [PMC free article] [PubMed] [Google Scholar]
- Garncarz W, Tariq A, Handl C, Pusch O, Jantsch MF. A high throughput screen to identify enhancers of ADAR-mediated RNA-editing. RNA biology. 2013:10. doi: 10.4161/rna.23208. [DOI] [PMC free article] [PubMed] [Google Scholar]
- Gelinas JF, Clerzius G, Shaw E, Gatignol A. Enhancement of replication of RNA viruses by ADAR1 via RNA editing and inhibition of RNA-activated protein kinase. Journal of virology. 2011;85:8460–8466. doi: 10.1128/JVI.00240-11. [DOI] [PMC free article] [PubMed] [Google Scholar]
- George CX, Das S, Samuel CE. Organization of the mouse RNA-specific adenosine deaminase Adar1 gene 5′-region and demonstration of STAT1-independent, STAT2-dependent transcriptional activation by interferon. Virology. 2008;380:338–343. doi: 10.1016/j.virol.2008.07.029. [DOI] [PMC free article] [PubMed] [Google Scholar]
- George CX, Samuel CE. Characterization of the 5′-flanking region of the human RNA-specific adenosine deaminase ADAR1 gene and identification of an interferon-inducible ADAR1 promoter. Gene. 1999a;229:203–213. doi: 10.1016/s0378-1119(99)00017-7. [DOI] [PubMed] [Google Scholar]
- George CX, Samuel CE. Human RNA-specific adenosine deaminase ADAR1 transcripts possess alternative exon 1 structures that initiate from different promoters, one constitutively active and the other interferon inducible. Proceedings of the National Academy of Sciences of the United States of America. 1999b;96:4621–4626. doi: 10.1073/pnas.96.8.4621. [DOI] [PMC free article] [PubMed] [Google Scholar]
- George CX, Wagner MV, Samuel CE. Expression of interferon-inducible RNA adenosine deaminase ADAR1 during pathogen infection and mouse embryo development involves tissue-selective promoter utilization and alternative splicing. J Biol Chem. 2005;280:15020–15028. doi: 10.1074/jbc.M500476200. [DOI] [PubMed] [Google Scholar]
- Grabowski P. Alternative splicing takes shape during neuronal development. Curr Opin Genet Dev. 2011;21:388–394. doi: 10.1016/j.gde.2011.03.005. [DOI] [PubMed] [Google Scholar]
- Gurevich I, Tamir H, Arango V, Dwork AJ, Mann JJ, Schmauss C. Altered editing of serotonin 2C receptor pre-mRNA in the prefrontal cortex of depressed suicide victims. Neuron. 2002;34:349–356. doi: 10.1016/s0896-6273(02)00660-8. [DOI] [PubMed] [Google Scholar]
- Gustincich S, Sandelin A, Plessy C, Katayama S, Simone R, Lazarevic D, Hayashizaki Y, Carninci P. The complexity of the mammalian transcriptome. J Physiol. 2006;575:321–332. doi: 10.1113/jphysiol.2006.115568. [DOI] [PMC free article] [PubMed] [Google Scholar]
- Hang PN, Tohda M, Matsumoto K. Developmental changes in expression and self-editing of adenosine deaminase type 2 pre-mRNA and mRNA in rat brain and cultured cortical neurons. Neurosci Res. 2008;61:398–403. doi: 10.1016/j.neures.2008.04.007. [DOI] [PubMed] [Google Scholar]
- Hartner JC, Schmittwolf C, Kispert A, Muller AM, Higuchi M, Seeburg PH. Liver disintegration in the mouse embryo caused by deficiency in the RNA-editing enzyme ADAR1. J Biol Chem. 2004;279:4894–4902. doi: 10.1074/jbc.M311347200. [DOI] [PubMed] [Google Scholar]
- Heale BS, Eulalio A, Schulte L, Vogel J, O’Connell MA. Analysis of A to I editing of miRNA in macrophages exposed to Salmonella. RNA biology. 2010;7:621–627. doi: 10.4161/rna.7.5.13269. [DOI] [PMC free article] [PubMed] [Google Scholar]
- Herbert A, Alfken J, Kim YG, Mian IS, Nishikura K, Rich A. A Z-DNA binding domain present in the human editing enzyme, double-stranded RNA adenosine deaminase. Proceedings of the National Academy of Sciences of the United States of America. 1997;94:8421–8426. doi: 10.1073/pnas.94.16.8421. [DOI] [PMC free article] [PubMed] [Google Scholar]
- Herbert A, Rich A. Left-handed Z-DNA: structure and function. Genetica. 1999;106:37–47. doi: 10.1023/a:1003768526018. [DOI] [PubMed] [Google Scholar]
- Herbert A, Wagner S, Nickerson JA. Induction of protein translation by ADAR1 within living cell nuclei is not dependent on RNA editing. Mol Cell. 2002;10:1235–1246. doi: 10.1016/s1097-2765(02)00737-2. [DOI] [PubMed] [Google Scholar]
- Higuchi M, Maas S, Single FN, Hartner J, Rozov A, Burnashev N, Feldmeyer D, Sprengel R, Seeburg PH. Point mutation in an AMPA receptor gene rescues lethality in mice deficient in the RNA-editing enzyme ADAR2. Nature. 2000;406:78–81. doi: 10.1038/35017558. [DOI] [PubMed] [Google Scholar]
- Hood JL, Emeson RB. Editing of neurotransmitter receptor and ion channel RNAs in the nervous system. Current topics in microbiology and immunology. 2012;353:61–90. doi: 10.1007/82_2011_157. [DOI] [PMC free article] [PubMed] [Google Scholar]
- Hoopengardner B, Bhalla T, Staber C, Reenan R. Nervous system targets of RNA editing identified by comparative genomics. Science. 2003;301:832–836. doi: 10.1126/science.1086763. [DOI] [PubMed] [Google Scholar]
- Hummon AB, Lim SR, Difilippantonio MJ, Ried T. Isolation and solubilization of proteins after TRIzol extraction of RNA and DNA from patient material following prolonged storage. Biotechniques. 2007;42:467–470. 472. doi: 10.2144/000112401. [DOI] [PMC free article] [PubMed] [Google Scholar]
- Jacobs MM, Fogg RL, Emeson RB, Stanwood GD. ADAR1 and ADAR2 expression and editing activity during forebrain development. Dev Neurosci. 2009;31:223–237. doi: 10.1159/000210185. [DOI] [PMC free article] [PubMed] [Google Scholar]
- Jepson JE, Savva YA, Yokose C, Sugden AU, Sahin A, Reenan RA. Engineered alterations in RNA editing modulate complex behavior in Drosophila: regulatory diversity of adenosine deaminase acting on RNA (ADAR) targets. J Biol Chem. 2011;286:8325–8337. doi: 10.1074/jbc.M110.186817. [DOI] [PMC free article] [PubMed] [Google Scholar]
- Kawakubo K, Samuel CE. Human RNA-specific adenosine deaminase (ADAR1) gene specifies transcripts that initiate from a constitutively active alternative promoter. Gene. 2000;258:165–172. doi: 10.1016/s0378-1119(00)00368-1. [DOI] [PubMed] [Google Scholar]
- Lehmann KA, Bass BL. Double-stranded RNA adenosine deaminases ADAR1 and ADAR2 have overlapping specificities. Biochemistry. 2000;39:12875–12884. doi: 10.1021/bi001383g. [DOI] [PubMed] [Google Scholar]
- Licatalosi DD, Darnell RB. Splicing regulation in neurologic disease. Neuron. 2006;52:93–101. doi: 10.1016/j.neuron.2006.09.017. [DOI] [PubMed] [Google Scholar]
- Liu Y, Emeson RB, Samuel CE. Serotonin-2C receptor pre-mRNA editing in rat brain and in vitro by splice site variants of the interferon-inducible double-stranded RNA-specific adenosine deaminase ADAR1. J Biol Chem. 1999a;274:18351–18358. doi: 10.1074/jbc.274.26.18351. [DOI] [PubMed] [Google Scholar]
- Liu Y, Emeson RB, Samuel CE. Serotonin-2C receptor pre-mRNA editing in rat brain and in vitro by splice site variants of the interferon-inducible double-stranded RNA-specific adenosine deaminase ADAR1. The Journal of biological chemistry. 1999b;274:18351–18358. doi: 10.1074/jbc.274.26.18351. [DOI] [PubMed] [Google Scholar]
- Liu Y, George CX, Patterson JB, Samuel CE. Functionally distinct double-stranded RNA-binding domains associated with alternative splice site variants of the interferon-inducible double-stranded RNA-specific adenosine deaminase. J Biol Chem. 1997;272:4419–4428. doi: 10.1074/jbc.272.7.4419. [DOI] [PubMed] [Google Scholar]
- Liu Y, Samuel CE. Editing of glutamate receptor subunit B pre-mRNA by splice-site variants of interferon-inducible double-stranded RNA-specific adenosine deaminase ADAR1. J Biol Chem. 1999a;274:5070–5077. doi: 10.1074/jbc.274.8.5070. [DOI] [PubMed] [Google Scholar]
- Liu Y, Samuel CE. Editing of glutamate receptor subunit B pre-mRNA by splice-site variants of interferon-inducible double-stranded RNA-specific adenosine deaminase ADAR1. The Journal of biological chemistry. 1999b;274:5070–5077. doi: 10.1074/jbc.274.8.5070. [DOI] [PubMed] [Google Scholar]
- Lukasz B, O’Sullivan NC, Loscher JS, Pickering M, Regan CM, Murphy KJ. Peripubertal viral-like challenge and social isolation mediate overlapping but distinct effects on behaviour and brain interferon regulatory factor 7 expression in the adult Wistar rat. Brain, behavior, and immunity. 2013;27:71–79. doi: 10.1016/j.bbi.2012.09.011. [DOI] [PubMed] [Google Scholar]
- Makhija K, Karunakaran S. The role of inflammatory cytokines on the aetiopathogenesis of depression. The Australian and New Zealand journal of psychiatry. 2013 doi: 10.1177/0004867413488220. [DOI] [PubMed] [Google Scholar]
- Mallela A, Nishikura K. A-to-I editing of protein coding and noncoding RNAs. Crit Rev Biochem Mol Biol. 2012;47:493–501. doi: 10.3109/10409238.2012.714350. [DOI] [PubMed] [Google Scholar]
- Mann MA, Tyler KL, Knipe DM, Fields BN. Type 3 reovirus neuroinvasion after intramuscular inoculation: viral genetic determinants of lethality and spinal cord infection. Virology. 2002;303:213–221. doi: 10.1006/viro.2002.1698. [DOI] [PubMed] [Google Scholar]
- Marcucci R, Brindle J, Paro S, Casadio A, Hempel S, Morrice N, Bisso A, Keegan LP, Del Sal G, O’Connell MA. Pin1 and WWP2 regulate GluR2 Q/R site RNA editing by ADAR2 with opposing effects. The EMBO journal. 2011;30:4211–4222. doi: 10.1038/emboj.2011.303. [DOI] [PMC free article] [PubMed] [Google Scholar]
- Meltzer M, Long K, Nie Y, Gupta M, Yang J, Montano M. The RNA editor gene ADAR1 is induced in myoblasts by inflammatory ligands and buffers stress response. Clin Transl Sci. 2010;3:73–80. doi: 10.1111/j.1752-8062.2010.00199.x. [DOI] [PMC free article] [PubMed] [Google Scholar]
- Morabito MV, Ulbricht RJ, O’Neil RT, Airey DC, Lu P, Zhang B, Wang L, Emeson RB. High-throughput multiplexed transcript analysis yields enhanced resolution of 5-hydroxytryptamine 2C receptor mRNA editing profiles. Mol Pharmacol. 2010;77:895–902. doi: 10.1124/mol.109.061903. [DOI] [PMC free article] [PubMed] [Google Scholar]
- Myint AM, Schwarz MJ, Steinbusch HW, Leonard BE. Neuropsychiatric disorders related to interferon and interleukins treatment. Metabolic brain disease. 2009;24:55–68. doi: 10.1007/s11011-008-9114-5. [DOI] [PubMed] [Google Scholar]
- Napoli I, Neumann H. Microglial clearance function in health and disease. Neuroscience. 2009;158:1030–1038. doi: 10.1016/j.neuroscience.2008.06.046. [DOI] [PubMed] [Google Scholar]
- Nie Y, Ding L, Kao PN, Braun R, Yang JH. ADAR1 interacts with NF90 through double-stranded RNA and regulates NF90-mediated gene expression independently of RNA editing. Mol Cell Biol. 2005;25:6956–6963. doi: 10.1128/MCB.25.16.6956-6963.2005. [DOI] [PMC free article] [PubMed] [Google Scholar]
- Nishikura K. Functions and regulation of RNA editing by ADAR deaminases. Annu Rev Biochem. 2010;79:321–349. doi: 10.1146/annurev-biochem-060208-105251. [DOI] [PMC free article] [PubMed] [Google Scholar]
- Niswender CM, Herrick-Davis K, Dilley GE, Meltzer HY, Overholser JC, Stockmeier CA, Emeson RB, Sanders-Bush E. RNA editing of the human serotonin 5-HT2C receptor. alterations in suicide and implications for serotonergic pharmacotherapy. Neuropsychopharmacology. 2001;24:478–491. doi: 10.1016/S0893-133X(00)00223-2. [DOI] [PubMed] [Google Scholar]
- Niswender CM, Sanders-Bush E, Emeson RB. Identification and characterization of RNA editing events within the 5-HT2C receptor. Ann N Y Acad Sci. 1998;861:38–48. doi: 10.1111/j.1749-6632.1998.tb10171.x. [DOI] [PubMed] [Google Scholar]
- Oberhaus SM, Smith RL, Clayton GH, Dermody TS, Tyler KL. Reovirus infection and tissue injury in the mouse central nervous system are associated with apoptosis. Journal of virology. 1997;71:2100–2106. doi: 10.1128/jvi.71.3.2100-2106.1997. [DOI] [PMC free article] [PubMed] [Google Scholar]
- Patterson JB, Samuel CE. Expression and regulation by interferon of a double-stranded-RNA-specific adenosine deaminase from human cells: evidence for two forms of the deaminase. Mol Cell Biol. 1995;15:5376–5388. doi: 10.1128/mcb.15.10.5376. [DOI] [PMC free article] [PubMed] [Google Scholar]
- Patterson JB, Thomis DC, Hans SL, Samuel CE. Mechanism of interferon action: double-stranded RNA-specific adenosine deaminase from human cells is inducible by alpha and gamma interferons. Virology. 1995;210:508–511. doi: 10.1006/viro.1995.1370. [DOI] [PubMed] [Google Scholar]
- Pfaller CK, Li Z, George CX, Samuel CE. Protein kinase PKR and RNA adenosine deaminase ADAR1: new roles for old players as modulators of the interferon response. Curr Opin Immunol. 2011;23:573–582. doi: 10.1016/j.coi.2011.08.009. [DOI] [PMC free article] [PubMed] [Google Scholar]
- Poulsen H, Nilsson J, Damgaard CK, Egebjerg J, Kjems J. CRM1 mediates the export of ADAR1 through a nuclear export signal within the Z-DNA binding domain. Mol Cell Biol. 2001;21:7862–7871. doi: 10.1128/MCB.21.22.7862-7871.2001. [DOI] [PMC free article] [PubMed] [Google Scholar]
- Rabinovici R, Kabir K, Chen M, Su Y, Zhang D, Luo X, Yang JH. ADAR1 is involved in the development of microvascular lung injury. Circ Res. 2001;88:1066–1071. doi: 10.1161/hh1001.090877. [DOI] [PubMed] [Google Scholar]
- Richardson-Burns SM, Kominsky DJ, Tyler KL. Reovirus-induced neuronal apoptosis is mediated by caspase 3 and is associated with the activation of death receptors. Journal of neurovirology. 2002;8:365–380. doi: 10.1080/13550280260422677. [DOI] [PubMed] [Google Scholar]
- Richardson-Burns SM, Tyler KL. Regional differences in viral growth and central nervous system injury correlate with apoptosis. Journal of virology. 2004;78:5466–5475. doi: 10.1128/JVI.78.10.5466-5475.2004. [DOI] [PMC free article] [PubMed] [Google Scholar]
- Riedmann EM, Schopoff S, Hartner JC, Jantsch MF. Specificity of ADAR-mediated RNA editing in newly identified targets. RNA. 2008;14:1110–1118. doi: 10.1261/rna.923308. [DOI] [PMC free article] [PubMed] [Google Scholar]
- Rosenthal JJ, Seeburg PH. A-to-I RNA Editing: Effects on Proteins Key to Neural Excitability. Neuron. 2012;74:432–439. doi: 10.1016/j.neuron.2012.04.010. [DOI] [PMC free article] [PubMed] [Google Scholar]
- Rula EY, Emeson RB. Mouse models to elucidate the functional roles of adenosine-to-inosine editing. Methods Enzymol. 2007;424:333–367. doi: 10.1016/S0076-6879(07)24016-9. [DOI] [PubMed] [Google Scholar]
- Ryman K, Fong N, Bratt E, Bentley DL, Ohman M. The C-terminal domain of RNA Pol II helps ensure that editing precedes splicing of the GluR-B transcript. RNA. 2007;13:1071–1078. doi: 10.1261/rna.404407. [DOI] [PMC free article] [PubMed] [Google Scholar]
- Sanjana NE, Levanon EY, Hueske EA, Ambrose JM, Li JB. Activity-dependent A-to-I RNA editing in rat cortical neurons. Genetics. 2012;192:281–287. doi: 10.1534/genetics.112.141200. [DOI] [PMC free article] [PubMed] [Google Scholar]
- Schellekens H, Clarke G, Jeffery IB, Dinan TG, Cryan JF. Dynamic 5-HT2C receptor editing in a mouse model of obesity. PLoS One. 2012;7:e32266. doi: 10.1371/journal.pone.0032266. [DOI] [PMC free article] [PubMed] [Google Scholar]
- Schittone SA, Dionne KR, Tyler KL, Clarke P. Activation of innate immune responses in the central nervous system during reovirus myelitis. Journal of virology. 2012;86:8107–8118. doi: 10.1128/JVI.00171-12. [DOI] [PMC free article] [PubMed] [Google Scholar]
- Schmauss C. Serotonin 2C receptors: suicide, serotonin, and runaway RNA editing. Neuroscientist. 2003;9:237–242. doi: 10.1177/1073858403253669. [DOI] [PubMed] [Google Scholar]
- Schoggins JW, Rice CM. Interferon-stimulated genes and their antiviral effector functions. Curr Opin Virol. 2011;1:519–525. doi: 10.1016/j.coviro.2011.10.008. [DOI] [PMC free article] [PubMed] [Google Scholar]
- Shtrichman R, Heithoff DM, Mahan MJ, Samuel CE. Tissue selectivity of interferon-stimulated gene expression in mice infected with Dam(+) versus Dam(−) Salmonella enterica serovar Typhimurium strains. Infect Immun. 2002;70:5579–5588. doi: 10.1128/IAI.70.10.5579-5588.2002. [DOI] [PMC free article] [PubMed] [Google Scholar]
- Singh M, Kesterson RA, Jacobs MM, Joers JM, Gore JC, Emeson RB. Hyperphagia-mediated obesity in transgenic mice misexpressing the RNA-editing enzyme ADAR2. J Biol Chem. 2007;282:22448–22459. doi: 10.1074/jbc.M700265200. [DOI] [PubMed] [Google Scholar]
- Sodhi MS, Airey DC, Lambert W, Burnet PW, Harrison PJ, Sanders-Bush E. A rapid new assay to detect RNA editing reveals antipsychotic-induced changes in serotonin-2C transcripts. Mol Pharmacol. 2005;68:711–719. doi: 10.1124/mol.105.014134. [DOI] [PubMed] [Google Scholar]
- Strehblow A, Hallegger M, Jantsch MF. Nucleocytoplasmic distribution of human RNA-editing enzyme ADAR1 is modulated by double-stranded RNA-binding domains, a leucine-rich export signal, and a putative dimerization domain. Mol Biol Cell. 2002;13:3822–3835. doi: 10.1091/mbc.E02-03-0161. [DOI] [PMC free article] [PubMed] [Google Scholar]
- Tan BZ, Huang H, Lam R, Soong TW. Dynamic regulation of RNA editing of ion channels and receptors in the mammalian nervous system. Mol Brain. 2009;2:13. doi: 10.1186/1756-6606-2-13. [DOI] [PMC free article] [PubMed] [Google Scholar]
- Tardieu M, Powers ML, Weiner HL. Age dependent susceptibility to Reovirus type 3 encephalitis: role of viral and host factors. Annals of neurology. 1983;13:602–607. doi: 10.1002/ana.410130604. [DOI] [PubMed] [Google Scholar]
- Tariq A, Garncarz W, Handl C, Balik A, Pusch O, Jantsch MF. RNA-interacting proteins act as site-specific repressors of ADAR2-mediated RNA editing and fluctuate upon neuronal stimulation. Nucleic acids research. 2013;41:2581–2593. doi: 10.1093/nar/gks1353. [DOI] [PMC free article] [PubMed] [Google Scholar]
- Toth AM, Zhang P, Das S, George CX, Samuel CE. Interferon action and the double-stranded RNA-dependent enzymes ADAR1 adenosine deaminase and PKR protein kinase. Prog Nucleic Acid Res Mol Biol. 2006;81:369–434. doi: 10.1016/S0079-6603(06)81010-X. [DOI] [PubMed] [Google Scholar]
- Tyler KL, Bronson RT, Byers KB, Fields B. Molecular basis of viral neurotropism: experimental reovirus infection. Neurology. 1985;35:88–92. doi: 10.1212/wnl.35.1.88. [DOI] [PubMed] [Google Scholar]
- Udina M, Moreno-Espana J, Navines R, Gimenez D, Langohr K, Gratacos M, Capuron L, de la Torre R, Sola R, Martin-Santos R. Serotonin and interleukin-6: The role of genetic polymorphisms in IFN-induced neuropsychiatric symptoms. Psychoneuroendocrinology. 2013 doi: 10.1016/j.psyneuen.2013.03.007. [DOI] [PubMed] [Google Scholar]
- Valente L, Nishikura K. RNA binding-independent dimerization of adenosine deaminases acting on RNA and dominant negative effects of nonfunctional subunits on dimer functions. J Biol Chem. 2007;282:16054–16061. doi: 10.1074/jbc.M611392200. [DOI] [PMC free article] [PubMed] [Google Scholar]
- Venkatasubramanian G, Debnath M. The TRIPS (Toll-like receptors in immuno-inflammatory pathogenesis) Hypothesis: a novel postulate to understand schizophrenia. Progress in neuro-psychopharmacology & biological psychiatry. 2013;44:301–311. doi: 10.1016/j.pnpbp.2013.04.001. [DOI] [PubMed] [Google Scholar]
- Villacampa N, Almolda B, Gonzalez B, Castellano B. Tomato lectin histochemistry for microglial visualization. Methods in molecular biology. 2013;1041:261–279. doi: 10.1007/978-1-62703-520-0_23. [DOI] [PubMed] [Google Scholar]
- Wang H, Hou Z, Wu Y, Ma X, Luo X. p150 ADAR1 isoform involved in maintenance of HeLa cell proliferation. BMC Cancer. 2006;6:282. doi: 10.1186/1471-2407-6-282. [DOI] [PMC free article] [PubMed] [Google Scholar]
- Wang Q, Miyakoda M, Yang W, Khillan J, Stachura DL, Weiss MJ, Nishikura K. Stress-induced apoptosis associated with null mutation of ADAR1 RNA editing deaminase gene. J Biol Chem. 2004;279:4952–4961. doi: 10.1074/jbc.M310162200. [DOI] [PubMed] [Google Scholar]
- Wang Y, Samuel CE. Adenosine deaminase ADAR1 increases gene expression at the translational level by decreasing protein kinase PKR-dependent eIF-2alpha phosphorylation. J Mol Biol. 2009;393:777–787. doi: 10.1016/j.jmb.2009.08.070. [DOI] [PMC free article] [PubMed] [Google Scholar]
- Ward SV, George CX, Welch MJ, Liou LY, Hahm B, Lewicki H, de la Torre JC, Samuel CE, Oldstone MB. RNA editing enzyme adenosine deaminase is a restriction factor for controlling measles virus replication that also is required for embryogenesis. Proceedings of the National Academy of Sciences of the United States of America. 2011;108:331–336. doi: 10.1073/pnas.1017241108. [DOI] [PMC free article] [PubMed] [Google Scholar]
- Weier HU, George CX, Greulich KM, Samuel CE. The interferon-inducible, double-stranded RNA-specific adenosine deaminase gene (DSRAD) maps to human chromosome 1q21.1-21.2. Genomics. 1995;30:372–375. doi: 10.1006/geno.1995.0034. [DOI] [PubMed] [Google Scholar]
- Wu Y, Wang H, Zhang J, Ma X, Meng J, Li Y, Hou Z, Luo X. Adenosine deaminase that acts on RNA 1 p150 in alveolar macrophage is involved in LPS-induced lung injury. Shock. 2009;31:410–415. doi: 10.1097/SHK.0b013e31817c1068. [DOI] [PubMed] [Google Scholar]
- Yang JH, Luo X, Nie Y, Su Y, Zhao Q, Kabir K, Zhang D, Rabinovici R. Widespread inosine-containing mRNA in lymphocytes regulated by ADAR1 in response to inflammation. Immunology. 2003;109:15–23. doi: 10.1046/j.1365-2567.2003.01598.x. [DOI] [PMC free article] [PubMed] [Google Scholar]
- Yang W, Wang Q, Kanes SJ, Murray JM, Nishikura K. Altered RNA editing of serotonin 5-HT2C receptor induced by interferon: implications for depression associated with cytokine therapy. Brain Res Mol Brain Res. 2004;124:70–78. doi: 10.1016/j.molbrainres.2004.02.010. [DOI] [PubMed] [Google Scholar]
- Yeo J, Goodman RA, Schirle NT, David SS, Beal PA. RNA editing changes the lesion specificity for the DNA repair enzyme NEIL1. Proceedings of the National Academy of Sciences of the United States of America. 2010;107:20715–20719. doi: 10.1073/pnas.1009231107. [DOI] [PMC free article] [PubMed] [Google Scholar]
- Zhang F, Rabinovici R. Adenosine deaminase acting on RNA 1 accelerates cell cycle through increased translation and activity of cyclin-dependent kinase 2. Shock. 2007;27:214–219. doi: 10.1097/01.shk.0000238072.51653.f2. [DOI] [PubMed] [Google Scholar]
Associated Data
This section collects any data citations, data availability statements, or supplementary materials included in this article.