

Abstract
Dopamine (DA) dysregulation within fronto-striatal circuitry may underlie impulsivity in alcohol and other substance use disorders. To date, no one has directly demonstrated DA release during a task requiring the control of impulsive behavior. The current study was conducted to determine whether a response inhibition task (stop signal task; SST) would elicit detectable extrastriatal DA release in healthy controls. We hypothesized that DA release would be detected in regions previously implicated in different aspects of inhibitory control. [18F]Fallypride (FAL) PET imaging was performed in nine healthy males (24.6 ± 4.1 y.o.) to assess changes in cortical DA during a SST relative to a baseline “Go” task. On separate days, subjects received one FAL scan during the SST, and one FAL scan during a “Go” control; task-order was counter-balanced across subjects. Parametric BPND images were generated and analyzed with SPM8. Voxel-wise analysis indicated significant SST-induced DA release in several cortical regions involved in inhibitory control, including the insula, cingulate cortex, orbitofrontal cortex, precuneus, and supplementary motor area. There was a significant positive correlation between stop signal reaction time and DA release in the left orbitofrontal cortex, right middle frontal gyrus, and right precentral gyrus. These data support the feasibility of using FAL PET to study DA release during response inhibition, enabling investigation of relationships between DA function and impulsive behavior.
Keywords: dopamine, positron emission tomography, fallypride, stop signal task, D2 receptor, impulsivity
INTRODUCTION
Impulsive behaviors are a hallmark of several forms of psychopathology, including addiction (Jentsch and Taylor, 1999), as addicts are often unable to restrain the impulse to pursue and consume addictive substances even in the face of detrimental consequences. There are many facets of impulsivity that are relevant for addiction (Evenden, 1999; Perry and Carroll, 2008), but one of the most frequently studied aspects is motor inhibition, which is often characterized by the ability to inhibit a pre-potent response. Impaired performance on motor inhibition tasks is a common characteristic across addicted and at-risk populations (e.g., Courtney et al., 2013; Goudriaan et al., 2006; Li et al., 2009; Nigg et al., 2006). Motor response inhibition is often indexed with stop signal reaction time (SSRT) as derived from the stop signal task (SST). SSRT is defined as the time required to withdraw (Stop) a ballistic hand movement (Logan, 1994; Logan et al., 1984). Specifically, subjects are required to respond quickly to “Go” stimuli, with intermittent “Stop” stimuli signaling the need to withhold that motor response. Subjects with impaired motor inhibition are less able to inhibit their motor response, and thus have longer SSRTs (Lipszyc and Schachar, 2010).
A number of human functional magnetic resonance imaging (fMRI) studies suggest that successful response inhibition, as indexed by SSRT, is strongly associated with the blood oxygen level dependent (BOLD) signal in a network of fronto-basal ganglia circuitry (Aron and Poldrack, 2006; Chambers et al., 2006; Congdon et al., 2010), particularly in the inferior frontal cortex (IFC), anterior insula (AI), anterior cingulate cortex (ACC), presupplementary motor area (pre-SMA), subthalamic nucleus (STN), globus pallidus (GP), and putamen (PUT). Dopamine (DA) is a neurotransmitter that is critical for modulating activity in many of these regions (Frank, 2005). Additionally, a growing body of evidence suggests that cortical dopaminergic neurotransmission plays a substantial role in mediating impulsive behavior, both generally, and specifically with respect to motor response inhibition. Animal studies have demonstrated increases in frontal DA during an impulsive choice task (delay-discounting) (Winstanley et al., 2006). Selectively altering frontal DA concentrations via lesions increases impulsive choice (Kheramin et al., 2004), whereas pharmacologically increased DA reduces impulsive choice (Robinson et al., 2008), as indicated by shifts in discounting. St. Onge et al. (2011) also recently reported that prefrontal cortex (PFC)-specific blockade of D2 receptors increased risky choice in rats. In humans, evidence for a link between cortical dopaminergic transmission and impulsivity is gradually emerging, and several lines of evidence are converging to support such a relationship. Catechol-O-methyltransferase (COMT) is the enzyme responsible for the majority of dopamine catabolism in the frontal cortex (Chen et al., 2004). A recent human study found that treatment with tolcapone, a COMT inhibitor, was associated with less impulsive choice, presumably via decreases in frontal cortical DA (Kayser et al., 2012). In line with this, Boettinger et al. (2007) reported that human subjects with a more active form of COMT display relatively higher impulsive behavior. Taken together, these preclinical and human reports have been instrumental in highlighting the importance of dopaminergic signaling in impulsive behavior. However, it is important to note that many of the above studies employed measures of impulsivity distinct from the stop signal paradigm. Although some facets of impulsivity are likely related across different operational definitions, there is evidence to suggest a disconnect between certain impulsive measures, such as the delay discounting and stop signal tasks (Dalen et al., 2004; de Wit, 2009; Solanto et al., 2001). Thus, the specific processes by which DA modulates human motor response inhibition processes are still largely unknown.
Human and small animal studies attempting to elucidate the neuropharmacology of SST performance have yielded equivocal results. Several studies reported that atomoxetine (ATM), a selective norepinephrine (NE) reuptake inhibitor, improves SSRT in both humans (Chamberlain et al., 2006, 2009) and small animals (Bari et al., 2009, 2011; Robinson et al., 2008). Furthermore, although atomoxetine increases both cortical DA and NE (Bymaster et al., 2002), its ability to improve SSRT was shown to be unaffected by cortical DA blockade (Bari et al., 2011). In contrast, D2-specific blockade in the dorsal striatum was shown to selectively impair SST performance (i.e., increase SSRT, Eagle et al., 2011). In a human study, Nandam et al. (2011) reported that the DA transporter blocker methylphenidate (MP), but not ATM, improved SSRT. Similarly, in a separate human study, the D2-specific agonist cabergoline improved SSRT, without affecting overall reaction time (Nandam et al., 2013). These discrepancies across the literature indicate that motor response inhibition is likely under control of several neurotransmitter systems, although interpretation is likely complicated by interspecies differences in anatomy and neurotransmission, as well as the complexity of the cognitive process.
To date, there has been only one comparison of SST performance with an in vivo measure of dopamine receptor availability (Ghahremani et al., 2012), which found significant correlations between baseline dorsal striatal D2/D3 receptor availability and SSRT (as derived from performance outside the scanner). Furthermore, the authors reported that baseline dorsal caudate D2/D3 receptor availability was correlated with the BOLD signal during SST in the dorsal caudate and several frontal cortical regions (e.g., ACC, IFG, OFC). However, while this investigation provided novel evidence linking SST performance to baseline striatal dopamine D2/D3 receptor availability, the role of cortical dopaminergic neurotransmission during the performance of a behavioral response inhibition task remains unclear. In an attempt to address this issue, we conducted an proof-of-principle study in healthy subjects to determine whether changes in D2/D3 receptor availability (indicative of changes in dopamine) during a SST could be detected using positron emission tomography (PET) and [18F]fallypride (FAL). Subjects were scanned under two conditions: one during performance of a SST, and one during performance of a control attention task requiring only “Go” responses. We hypothesized that the SST would induce changes in dopamine in cortical regions similar to those reported in BOLD fMRI studies of response inhibition.
MATERIALS AND METHODS
All study procedures were approved by the Indiana University Institutional Review Board and performed in accordance with the ethical standards of the Belmont Report. Subjects were recruited by local advertising in the greater Indianapolis area. Written informed consent was obtained after the study was completely described to the subjects. Nine healthy, right-handed, adult men completed study procedures. Subjects underwent a screening interview that included the Edinburgh handedness inventory (Oldfield, 1971), a 30-day Time Line Follow Back (TLFB; Sobell et al., 1986) calendar for recent drinking, and the Alcohol Use Disorder Identification Test (AUDIT; Saunders et al., 1993) to screen for risky drinking behavior. Exclusion criteria were: age <18 or >45 years of age, contraindications for MRI, current use of medications with central nervous system action, current use of tobacco or recreational drugs, consumption of ≥15 drinks per week, or >4 drinks on one occasion, AUDIT scores >8, reported history of neurological and/or psychiatric disorders, and a positive urine toxicology screen (Q-10, Proxam) as administered at screening, and on the day of PET imaging. Subjects received two [18F]fallypride (FAL) PET scans, conducted on separate days, and with scan order counterbalanced across subjects. The baseline FAL scan was acquired while subjects performed a control attention task. The challenge FAL scan was acquired during performance of a behavioral response inhibition task (stop signal task, SST). Initiation of the tasks began 5 min prior to FAL injection. Individual task presentation lasted for ~6 min. Tasks were presented four times in a row with a ~5 min break between runs. Total task time was ~45 min. During breaks and after completion of the final tasks, a fixation cross was displayed to help maintain subject wakefulness. Tasks were presented to subjects on a computer monitor situated outside the gantry. The monitor screen was fully visible to the subject. Prior to tracer injection, study personnel ensured that the subject was able to easily see, read, and perform the task without significant head movement. Task responses were made via a wireless mouse that was placed on a table adjacent to the scanner bed; tray table position was adjusted for a comfortable height and distance for the subject. Both “Go” and SST tasks were modified versions used by Kareken et al. (2013) and programmed in E-prime 2.0 software (Psychology Software Tools, Sharpsburg, PA).
Stop-signal task
Four SST task runs were presented to the subjects. Each SST run consisted of a combination of 80 “Go” trials and 40 “Stop” trials. During “Go” trials, subjects were presented with horizontal blue arrows that pointed left or right. Subjects were instructed to press the “left” mouse button for a left arrow, and the “right” mouse button for a right arrow. Subjects were instructed to respond as quickly and accurately as possible. “Stop” trials consisted of a red “up” arrow that appeared immediately after a blue arrow presentation. Subjects were instructed that, when they saw the red arrow, they were to withhold their response to the immediately preceding blue arrow. Across stop trials, an adaptive staircase algorithm adjusted the temporal delay between “Go” and “Stop” stimuli in 50 ms increments, to achieve a target “Stop” inhibition rate of 50%. That is, for each run, the “Stop” signal delay (SSD) time was set initially at 250 ms, and then either increased or decreased by 50 ms after successful or failed “Stop” response, respectively. SSD was programmed to be between 0 and 1450 ms. For each subject, average SSD was computed across all four runs, using only the data after the point at which the subject successfully converged to 50% stop inhibition. The mean, median, and standard deviation of reaction time on “Go” trials were calculated only for “Go” trials in which participants responded correctly. To calculate stop signal reaction time (SSRT), all Go-RTs were arranged from smallest to largest. The average SSD was then subtracted from that subject’s xth percentile “Go” RT, where x corresponds to the stop failure rate (Band et al., 2003). Thus, if a subject successfully inhibited their response on 55% of “Stop” trials, the Go-RT corresponding to the 55th percentile of the subject’s Go-RT distribution would then be selected, and the average SSD subtracted from this Go-RT to yield SSRT.
Go attention task
During “Go” trials, subjects were presented with horizontal blue arrows that pointed left or right. Subjects were instructed to press the “left” mouse button for a left arrow, and the “right” mouse button for a right arrow. Subjects were instructed to respond as quickly and accurately as possible.
Image acquisition
A magnetized prepared rapid gradient echo (MP-RAGE) magnetic resonance image (MRI) was acquired using a Siemens 3T Trio-Tim for anatomic coregistration and processing of PET data. [18F]fallypride (FAL) was synthesized at the Department of Radiology and Imaging Sciences radiochemistry facilities in the Biomedical Research Training Center, according to previously described methods (Gao et al., 2010). FAL PET scans were acquired on an ECAT HR+ (3D mode; septa retracted). FAL PET scans were initiated with an IV infusion of 170.63 ± 33.4 MBq FAL over the course of 1.5 min. Injected mass was 0.052 ± 0.03 nmol kg−1. The dynamic PET acquisition was split into two segments for subject comfort (Christian et al., 2006). The first half of dynamic acquisition was 60 min (6 × 30 s, 7 × 60 s, 5 × 120 s, 8 × 300 s). Following this segment, the subject was removed from the scanner for a ~15 min break period to stretch and use the restroom if needed. The second half of dynamic acquisition lasted 50 min (10 × 300 s).
Image processing
Dynamic PET data were reconstructed with Siemens ECAT software, v7.2.2. Three-dimensional data were rebinned into 2D sinograms with Fourier rebinning. Sinograms were corrected for randoms, scatter, and attenuation, and images were generated with filtered back-projection with a 5- mm Hanning filter. MRI and dynamic PET images were converted to Neuroimaging Informatics Technology Initiative (NIfTI) format (http://nifti.nimh.nih.gov/) and processed with SPM8. A mean PET image that contained a mixture of blood flow and specific binding was created using the realignment algorithm. This mean PET was coregistered to the subject’s anatomic MRI using the mutual information algorithm in SPM8. Each frame of PET data was subsequently coregistered to the MRI-registered mean PET image to correct for subject motion. Each subject’s MRI was spatially normalized to Montreal Neurological Institute (MNI) space and the transformation matrix obtained from the spatial normalization step was then applied to the motion-corrected PET data from each subject.
Voxel-wise analysis
Dopamine (DA) D2/D3 receptor availability was indexed with binding potential relative to nondisplaceable binding (BPND), which is operationally defined as fND*Bavail/KD (Innis et al., 2007). The cerebellum (vermis excluded) was used as the reference region (tissue that contains few to no D2/D3 receptors). Individual gray matter cerebellar regions of interest (ROIs) were created for each subject in order to extract cerebellar time activity curves. BPND was estimated at each brain voxel with Logan reference graphical analysis (Logan et al., 1996) using the cerebellar time activity curve as in input function. t* was set at 25 data points in “stretched” time. The resulting parametric BPND images were smoothed with an 8-mm Gaussian kernel (Costes et al., 2005; Picard et al., 2006; Ziolko et al., 2006). In areas of high D2/D3 receptor density, like the striatum, >2.5 h of scanning is required to accurately estimate BPND (Christian et al., 2000, 2006). As subjects in our study were scanned for ~2 h, we implemented a gray matter mask to exclude the striatum. In addition, parametric BPND image voxels with very low values (<0.1) were excluded from further analysis to ensure that only reliably estimated BPND values from both scans were considered.
Statistical analysis
Voxel-wise, one-tailed paired t tests were used to detect significant changes in FAL BPND between scan conditions. Tests were run in both directions to test for both increases and decreases in BPND during the SST relative to the attention task condition. Significant clusters were defined at P<0.005 (uncorrected) and cluster size k>10 voxels. Each significant cluster was defined as a region of interest (ROI), and average regional BPND values were extracted from the “Go” baseline and SST parametric images with the Mars- BaR toolbox (http://marsbar.sourceforge.net/). This allowed us to calculate percent change in BPND: (%ΔBPND)=((BPND,GO – BPND, SS)/BPND,GO) × 100 for each cluster, and to test for bivariate correlations with SSRT using SPSS 20.0. Data from significant regression analyses were tested for outliers using Cook’s D (Bollen and Jackman, 1985). Data are presented as mean ± s.d., unless otherwise specified.
RESULTS
Subject characteristics
Subjects were 24.6 ± 4.1 years old (range 19–32), and had 15.7 ± 1.3 years of education. All subjects were light social-drinkers: average alcohol consumption was 1.91 ± 2.5 drinks per week; AUDIT scores were 3.0 ± 1.7.
Task performance
Behavioral results from the “Go” control attention task and SST are shown in Table I. Data for the “Go” task from one subject was unavailable because of computer failure. Behavioral SST data from two subjects were excluded because they failed to converge to 50% stop inhibition throughout the course of the task.
TABLE I.
Performance on the “Go” attention task and Stop Signal taska
| “Go” task performance (n=8) | |
| Correct trials (%) | 98.5 ± 1.4 |
| Median Go-RT (ms) | 378 ± 45 |
| Stop signal task performance (n=7) | |
| Correct “Go” trials (%) | 96.5 ± 7.6 |
| Correct “Stop” trials (%) | 56.3 ± 9.5 |
| Median Go-RT (ms) | 577 ± 140 |
| SSRT (ms) | 232 ± 23 |
Data are mean ± s.d. RT, reaction time; SSRT, stop signal reaction time.
Changes in FAL BPND during the stop signal task
Voxel-wise paired t tests revealed several cortical regions where BPND during the SST (BPND, SS) was significantly lower than BPND during the “Go” attention task (BPND, GO) (Fig. 1, Table II), indicative of dopamine (DA) release in these regions during the SST. BPND, GO was significantly lower than BPND, SS in the anterior cingulate gyrus (Fig. 2, Table II), indicative of decreased DA in this region during the SST.
Fig. 1.
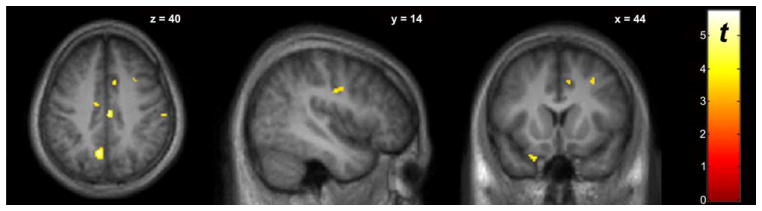
Whole-brain voxel-wise paired t-test comparing BPND between baseline “Go” and SST scan conditions (n=9). The “hot” colorscale indicates voxels where BPND, BL was significantly higher than BPND, SS (increased DA during SST). Display threshold P<0.005, uncorrected, k>10. Significant clusters are listed in Table II.
TABLE II.
Voxel-wise results of changes in dopamine (DA) during the SSTa
| Region/cluster | MNI coordinates
|
Cluster size (k) | Peak voxel (Z-score) | Baseline BPND (mean ± SD) | SST BPND (mean ± SD) | ΔBPND (mean ± SD) | ||
|---|---|---|---|---|---|---|---|---|
| x | y | z | ||||||
| Regions of increased DA | ||||||||
| Frontal | ||||||||
| SFG/SMA | −10 | 4 | 58 | 23 | 3.28 | 0.32 ± 0.087 | 0.28 ± 0.10 | 8.2 ± 5.2 |
| MFG | 30 | 10 | 44 | 37 | 2.99 | 0.29 ± 0.089 | 0.25 ± 0.10 | 19 ± 15 |
| 20 | −16 | 64 | 22 | 2.77 | 0.20 ± 0.078 | 0.16 ± 0.077 | 25 ± 19 | |
| 36 | 24 | 48 | 26 | 3.34 | 0.38 ± 0.076 | 0.35 ± 0.092 | 11 ± 8.2 | |
| OFC/IFG | −22 | 14 | −28 | 13 | 3.00 | 0.88 ± 0.17 | 0.83 ± 0.15 | 6.8 ± 4.1 |
| Parietal | ||||||||
| Precuneus | −8 | −62 | 36 | 141 | 3.52 | 0.39 ± 0.10 | 0.35 ± 0.10 | 1.2 ± 5.7 |
| 14 | −58 | 62 | 33 | 3.30 | 0.29 ± 0.069 | 0.26 ± 0.062 | 15 ± 12 | |
| IPL/SMG | 64 | −36 | 34 | 28 | 3.33 | 0.37 ± 0.15 | 0.32 ± 0.13 | 12 ± 3.8 |
| Angular gyrus | 50 | −62 | 30 | 26 | 3.15 | 0.59 ± 0.17 | 0.55 ± 0.17 | 7.1 ± 5.0 |
| Paracentral lobule | 6 | −32 | 68 | 22 | 3.06 | 0.19 ± 0.10 | 0.16 ± 0.087 | 12 ± 9.0 |
| Postcentral gyrus | 62 | −14 | 16 | 85 | 3.01 | 0.53 ± 0.21 | 0.47 ± 0.19 | 8.2 ± 5.4 |
| Precentral gyrus | 46 | −10 | 32 | 22 | 2.81 | 0.26 ± 0.072 | 0.22 ± 0.076 | 16 ± 13 |
| Temporal | ||||||||
| Fusiform gyrus | −28 | −50 | −16 | 25 | 3.21 | 0.69 ± 0.20 | 0.64 ± 0.18 | 5.9 ± 4.0 |
| −40 | −38 | −26 | 45 | 3.12 | 0.89 ± 0.26 | 0.83 ± 0.23 | 16 ± 11 | |
| STG | 60 | −50 | 14 | 21 | 3.18 | 0.62 ± 0.19 | 0.58 ± 0.19 | 6.5 ± 5.0 |
| 62 | −36 | 12 | 51 | 3.06 | 0.61 ± 0.16 | 0.56 ± 0.16 | 17 ± 8.3 | |
| Other | ||||||||
| Cingulate cortex | 4 | −20 | 40 | 14 | 3.34 | 0.61 ± 0.11 | 0.58 ± 0.11 | 5.9 ± 3.6 |
| 10 | 12 | 42 | 22 | 3.00 | 0.49 ± 0.11 | 0.45 ± 0.12 | 9.3 ± 6.5 | |
| −10 | −12 | 40 | 11 | 2.81 | 0.27 ± 0.083 | 0.22 ± 0.070 | 6.5 ± 4.0 | |
| Uncus | −32 | −14 | −38 | 10 | 3.01 | 1.1 ± 0.37 | 1.0 ± 0.35 | 15 ± 10 |
| Regions of decreased DA | ||||||||
| ACC | −2 | 30 | −4 | 16 | 3.13 | 0.22 ± 0.11 | 0.27 ± 0.11 | −34 ± 32 |
Regions of increased DA were taken from the BPND, BL>BPND, SS contrast. Regions of decreased DA were taken from the BPND, SS>BPND, BL contrast. MNI, Montreal Neurological Institute; k, cluster size; SST, stop signal task; STG, superior temporal gyrus; IPL, inferior parietal lobe; SMG, supramarginal gyrus; SMA, supplementary motor area; ITG, inferior temporal gyrus; MFG, middle frontal gyrus; SFG, superior frontal gyrus; IFG, inferior frontal gyrus; OFC, orbitofrontal cortex; ACC, anterior cingulate cortex. Statistical threshold was P<.005, uncorrected, k>10 voxels.
Fig. 2.
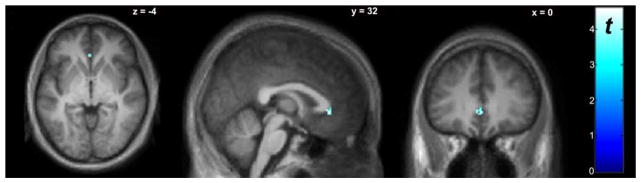
Whole-brain voxel-wise paired t test comparing BPND between baseline “Go” and SST scan conditions (n=9). The “cool” colorscale indicates voxels where BPND, SS was significantly higher than BPND, BL (indicating decreased DA during SST). Display threshold P<0.005, uncorrected, k>10. Significant clusters are listed in Table II.
Association between ΔBPND and stop signal task performance
Of the 21 extracted clusters in which there was a significant change in BPND (Figs. 1 and 2, Table II), ΔBPND significantly negatively correlated with SSRT (n=7) in the left orbitofrontal cortex (OFC; r=−0.842, P=0.017), right middle frontal gyrus (MFG; r=−0.833, P=0.020), and right precentral gyrus (r=−0.877, P=0.009). None of the data points in any of the three regressions met the criteria as undue influence points, which was defined by threshold D<0.57. D value ranges were: L-OFC, 0.000–0.268; R-MFG, 0.017–0.432; R-precentral gyrus, 0.015–0.403.
DISCUSSION
The principle finding of the current study is that changes in cortical D2/D3 receptor availability were detectable during a stop signal task (SST) relative to a control attention task. To our knowledge, this is the first demonstration of apparent in vivo changes in cortical DA during a motor response inhibition task. The anatomic locations of significant clusters of ΔBPND correspond well to neural correlates of inhibiting motor responses that have been characterized in humans with fMRI (Aron and Poldrack, 2006; Chambers et al., 2009; Congdon et al., 2010). These, and other reports, have emphasized the importance of the IFC, SMA, pre-SMA, ACC, STN, and striatum in successful response inhibition (Zandbelt and Vink, 2010). While fMRI provides excellent spatial localization and has good temporal sampling ability, other in vivo techniques such as PET are needed to elucidate the specific neurochemical substrates of the SST. Using [18F]fallypride (FAL) PET, we demonstrated SST-induced changes in dopaminergic signaling in several cortical regions that are implicated in behavioral response inhibition. In particular, we observed significant increases in DA in motor-related brain regions such as the SMA and precentral gyrus (Fig. 1, Table II), which are thought to be crucial regions in the stopping process (Floden and Stuss, 2006; Li et al., 2006). Other cortical regions that exhibited significant SST-induced changes in DA have previously been shown to activate during SST performance, including frontal (middle and superior frontal gyri), parietal (precuneus, paracentral lobule, postcentral gyrus supramarginal gyrus, angular gyrus), temporal (fusiform gyrus, superior temporal gyrus), and cingulate cortex areas (Cai and Leung, 2009; Congdon et al., 2010; Courtney et al., 2013; Ghahremani et al., 2012; Kareken et al., 2013).
The precuneus is one of the core regions of the “default mode network” (DMN; Bressler and Menon, 2010), which engages in the absence of a directed task and is believed to mediate “switching” cognitive processes on and off (Li et al., 2007; Zhang and Li, 2010). Dopaminergic transmission affects precuneus activity during cognitive task performance. For example, Argyelan et al. (2008) showed that cognitively-induced change in precuneus activity was affected by a DA agonist. Tomasi et al. (2009) found that deactivation of the precuneus during a visuospatial attention task was negatively associated with striatal dopamine transporter availability. The SST-related increases in dopamine in the precuneus that were observed in this study may indicate a role for dopamine in deactivating the DMN in order to engage processes relevant for motor response task performance.
In the present analysis, we also report that task-induced changes in D2/D3 receptor availability were negatively correlated with SSRT in three cortical sub-regions, the left orbitofrontal cortex, right middle frontal gyrus, and right precentral gyrus (Table II). These regions have been identified as belonging to a common network that exhibits SST-induced activation, in which activation was also significantly associated with SSRT (Congdon et al., 2010). Another fMRI study confirmed that SST-induced BOLD responses in these regions were associated with SSRT (Ghahremani et al., 2012). These reports lend support to our interpretation of the present data, which is that cortical dopamine in these regions may contribute to performance of a motor response inhibition task. However, the literature on the cortical neurochemistry and neuroanatomy underlying motor inhibition performance is admittedly more complicated.
Human imaging studies have not definitively discerned the precise locations and neurotransmitter systems relevant for response inhibition. There is much debate over which specific brain regions are important for stopping a motor response. While numerous studies cite the IFC as an essential locus for successful inhibition (Aron et al., 2003; Swick et al., 2008), there is also evidence supporting the OFC (Horn et al., 2003), and precentral gyrus (Li et al., 2006) as neural hubs for response inhibition modulation. A recent fMRI study in adolescents reported differential activation of brain networks during a SST that was dependent on substance abuse and ADHD phenotypes (Whelan et al., 2012). This suggests that interindividual variability may affect which specific brain regions are recruited for task performance.
Global manipulations of DA function provide indirect evidence about dopaminergic regulation of brain activity during impulse control. Administration of a DA agonist increases regional cerebral blood flow (rCBF) in the OFC and precentral gyrus, and decreases rCBF in the MFG (Bradberry et al., 2012), indicating that activity in these regions is under control of DA transmission. During motor inhibition tasks, DA perturbation has similar effects on brain activity. DA antagonism results in decreased activation of the precentral gyrus during a motor inhibition task (Luijten et al., 2013). Conversely, increasing brain DA levels leads to increased activation of MFG and precentral gyrus during a SST (Li et al., 2010). Furthermore, the change in MFG activation is positively correlated with improvement of SSRT, suggesting that DA may be an important modulator of MFG activity during SST performance. Overall, the data from the literature, combined with that from the current study, suggest that the association of OFC, MFG, and precentral gyrus activation with performance on a response inhibition task may be modulated, in part, by DA. However, replication of these results in a larger cohort is necessary to further understand these associations.
The present study has several limitations. The sample size is relatively small, and thus presents a risk of both Type I and Type II errors. We readily acknowledge that this is a preliminary analysis, and replication in a larger sample is needed to support our interpretations. However, task-induced DA changes in this study overlap well with regions that have been demonstrated to elicit BOLD responses during a stop signal task (Aron and Poldrack, 2006; Chambers et al., 2009; Congdon et al., 2010). This suggests that our findings are physiologically relevant and not merely the result of a Type I error. Another potential limitation of the current study is that we did not examine the striatum. Ghahremani et al. (2012) recently reported that baseline striatal D2/D3 receptor availability was negatively correlated with SSRT. Additionally, several fMRI studies have shown striatal activation during successful response inhibition (Congdon et al., 2010; Vink et al., 2005; Zandbelt and Vink, 2010). However, because we were primarily interested in cortical DA, our study design used a 2-h scan: long enough to accurately estimate cortical, but not striatal BPND. Finally, our interpretation that the observed changes in BPND are a direct function of DA must be taken with caution. The study design did not sustain the stop-signal task for the duration of the scan acquisition. It is possible that the cessation of the stop-signal task could result in regionally heterogeneous changes in blood flow parameters, which, in turn, could potentially confound estimation of BPND from the challenge data. Additionally, it would be useful to have pharmacological validation that changes in DA are responsible for the reported effects (e.g., tyrosine depletion studies).
In conclusion, we detected significant changes in cortical D2/D3 receptor availability during a stop signal task compared to a control attentional task. Percent change in receptor availability was correlated with task performance in three cortical regions that have been shown to be important for successful response inhibition. The present results demonstrate the feasibility of using [18F]fallypride PET to detect apparent changes in DA during a stop signal challenge, and the potential to use the SST as a probe for studying cortical dopaminergic contributions to disorders marked by impulsive behavior.
Acknowledgments
The authors thank Christine Herring and James Walters for assistance with recruitment and data collection; Kevin Perry for acquisition of PET data; Michele Beal and Courtney Robbins for assistance with MR scanning; and Dr. Bruce Mock, Dr. Clive Brown-Proctor, Dr. Qi-Huang Zheng, Barbara Glick- Wilson and Brandon Steele for [18F]fallypride synthesis. They also thank Dr. Bill Eiler for help coding the stop-signal paradigm in E-prime 2.0.
Contract grant sponsor: Indiana University-Purdue University at Indianapolis Research.
References
- Argyelan M, Carbon M, Ghilardi MF, Feigin A, Mattis P, Tang C, Dhawan V, Eidelberg D. Dopaminergic suppression of brain deactivation responses during sequence learning. J Neurosci. 2008;28:10687–10695. doi: 10.1523/JNEUROSCI.2933-08.2008. [DOI] [PMC free article] [PubMed] [Google Scholar]
- Aron AR, Poldrack RA. Cortical and subcortical contributions to Stop signal response inhibition: Role of the subthalamic nucleus. J Neurosci. 2006;26:2424–2433. doi: 10.1523/JNEUROSCI.4682-05.2006. [DOI] [PMC free article] [PubMed] [Google Scholar]
- Aron AR, Fletcher PC, Bullmore ET, Sahakian BJ, Robbins TW. Stop-signal inhibition disrupted by damage to right inferior frontal gyrus in humans. Nat Neurosci. 2003;6:115–116. doi: 10.1038/nn1003. [DOI] [PubMed] [Google Scholar]
- Band GP, van der Molen MW, Logan GD. Horse-race model simulations of the stop-signal procedure. Acta Psychol (Amst) 2003;112:105–142. doi: 10.1016/s0001-6918(02)00079-3. [DOI] [PubMed] [Google Scholar]
- Bari A, Eagle DM, Mar AC, Robinson ES, Robbins TW. Dissociable effects of noradrenaline, dopamine, and serotonin uptake blockade on stop task performance in rats. Psychopharmacology (Berl) 2009;205:273–283. doi: 10.1007/s00213-009-1537-0. [DOI] [PMC free article] [PubMed] [Google Scholar]
- Bari A, Mar AC, Theobald DE, Elands SA, Oganya KC, Eagle DM, Robbins TW. Prefrontal and monoaminergic contributions to stop-signal task performance in rats. J Neurosci. 2011;31:9254–9263. doi: 10.1523/JNEUROSCI.1543-11.2011. [DOI] [PMC free article] [PubMed] [Google Scholar]
- Boettiger CA, Mitchell JM, Tavares VC, Robertson M, Joslyn G, D’Esposito M, Fields HL. Immediate reward bias in humans: Fronto-parietal networks and a role for the catechol-O-methyltransferase 158(Val/Val) genotype. J Neurosci. 2007;27:14383– 14391. doi: 10.1523/JNEUROSCI.2551-07.2007. [DOI] [PMC free article] [PubMed] [Google Scholar]
- Bollen KA, Jackman RW. Regression diagnostics an expository treatment of outliers and influential cases. Sociol Methods Res. 1985;13:510–542. [Google Scholar]
- Bradberry TJ, Metman LV, Contreras-Vidal JL, van den Munckhof P, Hosey LA, Thompson JL, Schulz GM, Lenz F, Pahwa R, Lyons KE. Common and unique responses to dopamine agonist therapy and deep brain stimulation in Parkinson’s disease: An H215O PET study. Brain Stimul. 2012;5:605–615. doi: 10.1016/j.brs.2011.09.002. [DOI] [PMC free article] [PubMed] [Google Scholar]
- Bressler SL, Menon V. Large-scale brain networks in cognition: Emerging methods and principles. Trends Cogn Sci. 2010;14:277– 290. doi: 10.1016/j.tics.2010.04.004. [DOI] [PubMed] [Google Scholar]
- Bymaster FP, Katner JS, Nelson DL, Hemrick-Luecke SK, Threlkeld PG, Heiligenstein JH, Morin SM, Gehlert DR, Perry KW. Atomoxetine increases extracellular levels of norepinephrine and dopamine in prefrontal cortex of rat: A potential mechanism for efficacy in attention deficit/hyperactivity disorder. Neuropsychopharmacology. 2002;27:699–711. doi: 10.1016/S0893-133X(02)00346-9. [DOI] [PubMed] [Google Scholar]
- Cai W, Leung HC. Cortical activity during manual response inhibition guided by color and orientation cues. Brain Res. 2009;1261:20–28. doi: 10.1016/j.brainres.2008.12.073. [DOI] [PMC free article] [PubMed] [Google Scholar]
- Chamberlain SR, Muller U, Blackwell AD, Clark L, Robbins TW, Sahakian BJ. Neurochemical modulation of response inhibition and probabilistic learning in humans. Science. 2006;311:861–863. doi: 10.1126/science.1121218. [DOI] [PMC free article] [PubMed] [Google Scholar]
- Chamberlain SR, Hampshire A, Muller U, Rubia K, Del Campo N, Craig K, Regenthal R, Suckling J, Roiser JP, Grant JE, Bullmore ET, Robbins TW, Sahakian BJ. Atomoxetine modulates right inferior frontal activation during inhibitory control: A pharmacological functional magnetic resonance imaging study. Biol Psychiatry. 2009;65:550–555. doi: 10.1016/j.biopsych.2008.10.014. [DOI] [PubMed] [Google Scholar]
- Chambers CD, Bellgrove MA, Stokes MG, Henderson TR, Garavan H, Robertson IH, Morris AP, Mattingley JB. Executive “brake failure” following deactivation of human frontal lobe. J Cogn Neurosci. 2006;18:444–455. doi: 10.1162/089892906775990606. [DOI] [PubMed] [Google Scholar]
- Chambers CD, Garavan H, Bellgrove MA. Insights into the neural basis of response inhibition from cognitive and clinical neuroscience. Neurosci Biobehav Rev. 2009;33:631–646. doi: 10.1016/j.neubiorev.2008.08.016. [DOI] [PubMed] [Google Scholar]
- Chen J, Lipska BK, Halim N, Ma QD, Matsumoto M, Melhem S, Kolachana BS, Hyde TM, Herman MM, Apud J, Egan MF, Kleinman JE, Weinberger DR. Functional analysis of genetic variation in catechol-O-methyltransferase (COMT): Effects on mRNA, protein, and enzyme activity in postmortem human brain. Am J Hum Genet. 2004;75:807–821. doi: 10.1086/425589. [DOI] [PMC free article] [PubMed] [Google Scholar]
- Christian BT, Narayanan TK, Shi B, Mukherjee J. Quantitation of striatal and extrastriatal D-2 dopamine receptors using PET imaging of [(18)F]fallypride in nonhuman primates. Synapse. 2000;38:71–79. doi: 10.1002/1098-2396(200010)38:1<71::AID-SYN8>3.0.CO;2-2. [DOI] [PubMed] [Google Scholar]
- Christian BT, Lehrer DS, Shi B, Narayanan TK, Strohmeyer PS, Buchsbaum MS, Mantil JC. Measuring dopamine neuromodulation in the thalamus: using [F-18]fallypride PET to study dopamine release during a spatial attention task. Neuroimage. 2006;31:139–152. doi: 10.1016/j.neuroimage.2005.11.052. [DOI] [PubMed] [Google Scholar]
- Congdon E, Mumford JA, Cohen JR, Galvan A, Aron AR, Xue G, Miller E, Poldrack RA. Engagement of large-scale networks is related to individual differences in inhibitory control. Neuroimage. 2010;53:653–663. doi: 10.1016/j.neuroimage.2010.06.062. [DOI] [PMC free article] [PubMed] [Google Scholar]
- Costes N, Merlet I, Ostrowsky K, Faillenot I, Lavenne F, Zimmer L, Ryvlin P, Le Bars D. A 18F-MPPF PET normative database of 5-HT1A receptor binding in men and women over aging. J Nucl Med. 2005;46:1980–1989. [PubMed] [Google Scholar]
- Courtney KE, Ghahremani DG, Ray LA. Fronto-striatal functional connectivity during response inhibition in alcohol dependence. Addict Biol. 2013;18:593–604. doi: 10.1111/adb.12013. [DOI] [PMC free article] [PubMed] [Google Scholar]
- Dalen L, Sonuga-Barke EJ, Hall M, Remington B. Inhibitory deficits, delay aversion and preschool AD/HD: Implications for the dual pathway model. Neural Plast. 2004;11:1–11. doi: 10.1155/NP.2004.1. [DOI] [PMC free article] [PubMed] [Google Scholar]
- de Wit H. Impulsivity as a determinant and consequence of drug use: A review of underlying processes. Addict Biol. 2009;14:22–31. doi: 10.1111/j.1369-1600.2008.00129.x. [DOI] [PMC free article] [PubMed] [Google Scholar]
- Eagle DM, Wong JC, Allan ME, Mar AC, Theobald DE, Robbins TW. Contrasting roles for dopamine D1 and D2 receptor subtypes in the dorsomedial striatum but not the nucleus accumbens core during behavioral inhibition in the stop-signal task in rats. J Neurosci. 2011;31:7349–7356. doi: 10.1523/JNEUROSCI.6182-10.2011. [DOI] [PMC free article] [PubMed] [Google Scholar]
- Evenden JL. Varieties of impulsivity. Psychopharmacology (Berl) 1999;146:348–361. doi: 10.1007/pl00005481. [DOI] [PubMed] [Google Scholar]
- Floden D, Stuss DT. Inhibitory control is slowed in patients with right superior medial frontal damage. J Cogn Neurosci. 2006;18:1843–1849. doi: 10.1162/jocn.2006.18.11.1843. [DOI] [PubMed] [Google Scholar]
- Frank MJ. Dynamic dopamine modulation in the basal ganglia: A neurocomputational account of cognitive deficits in medicated and nonmedicated Parkinsonism. J Cogn Neurosci. 2005;17:51–72. doi: 10.1162/0898929052880093. [DOI] [PubMed] [Google Scholar]
- Gao M, Wang M, Mock BH, Glick-Wilson BE, Yoder KK, Hutchins GD, Zheng Q-H. An improved synthesis of dopamine D2/D3 receptor radioligands [11C]fallypride and [18F]fallypride. Appl Radiat Isotopes. 2010;68:1079–1086. doi: 10.1016/j.apradiso.2009.09.071. [DOI] [PubMed] [Google Scholar]
- Ghahremani DG, Lee B, Robertson CL, Tabibnia G, Morgan AT, De Shetler N, Brown AK, Monterosso JR, Aron AR, Mandelkern MA, Poldrack RA, London ED. Striatal dopamine D(2)/D(3) receptors mediate response inhibition and related activity in frontostriatal neural circuitry in humans. J Neurosci. 2012;32:7316–7324. doi: 10.1523/JNEUROSCI.4284-11.2012. [DOI] [PMC free article] [PubMed] [Google Scholar]
- Goudriaan AE, Oosterlaan J, de Beurs E, van den Brink W. Neurocognitive functions in pathological gambling: A comparison with alcohol dependence, Tourette syndrome and normal controls. Addiction. 2006;101:534–547. doi: 10.1111/j.1360-0443.2006.01380.x. [DOI] [PubMed] [Google Scholar]
- Horn NR, Dolan M, Elliott R, Deakin JF, Woodruff PW. Response inhibition and impulsivity: An fMRI study. Neuropsychologia. 2003;41:1959–1966. doi: 10.1016/s0028-3932(03)00077-0. [DOI] [PubMed] [Google Scholar]
- Innis RB, Cunningham VJ, Delforge J, Fujita M, Gjedde A, Gunn RN, Holden J, Houle S, Huang SC, Ichise M, Iida H, Ito H, Kimura Y, Koeppe RA, Knudsen GM, Knuuti J, Lammertsma AA, Laruelle M, Logan J, Maguire RP, Mintun MA, Morris ED, Parsey R, Price JC, Slifstein M, Sossi V, Suhara T, Votaw JR, Wong DF, Carson RE. Consensus nomenclature for in vivo imaging of reversibly binding radioligands. J Cereb Blood Flow Metab. 2007;27:1533–1539. doi: 10.1038/sj.jcbfm.9600493. [DOI] [PubMed] [Google Scholar]
- Jentsch JD, Taylor JR. Impulsivity resulting from frontostriatal dysfunction in drug abuse: Implications for the control of behavior by reward-related stimuli. Psychopharmacology (Berl) 1999;146:373–390. doi: 10.1007/pl00005483. [DOI] [PubMed] [Google Scholar]
- Kareken DA, Dzemidzic M, Wetherill L, Eiler W, 2nd, Oberlin BG, Harezlak J, Wang Y, O’Connor SJ. Family history of alcoholism interacts with alcohol to affect brain regions involved in behavioral inhibition. Psychopharmacology (Berl) 2013;228:335–345. doi: 10.1007/s00213-013-3038-4. [DOI] [PMC free article] [PubMed] [Google Scholar]
- Kayser AS, Allen DC, Navarro-Cebrian A, Mitchell JM, Fields HL. Dopamine, corticostriatal connectivity, and intertemporal choice. J Neurosci. 2012;32:9402–9409. doi: 10.1523/JNEUROSCI.1180-12.2012. [DOI] [PMC free article] [PubMed] [Google Scholar]
- Kheramin S, Body S, Ho MY, Velazquez-Martinez DN, Bradshaw CM, Szabadi E, Deakin JF, Anderson IM. Effects of orbital prefrontal cortex dopamine depletion on inter-temporal choice: A quantitative analysis. Psychopharmacology (Berl) 2004;175:206–214. doi: 10.1007/s00213-004-1813-y. [DOI] [PubMed] [Google Scholar]
- Li CS, Huang C, Constable RT, Sinha R. Imaging response inhibition in a stop-signal task: Neural correlates independent of signal monitoring and post-response processing. J Neurosci. 2006;26:186–192. doi: 10.1523/JNEUROSCI.3741-05.2006. [DOI] [PMC free article] [PubMed] [Google Scholar]
- Li CS, Yan P, Bergquist KL, Sinha R. Greater activation of the “default” brain regions predicts stop signal errors. Neuroimage. 2007;38:640–648. doi: 10.1016/j.neuroimage.2007.07.021. [DOI] [PMC free article] [PubMed] [Google Scholar]
- Li CS, Luo X, Yan P, Bergquist K, Sinha R. Altered impulse control in alcohol dependence: Neural measures of stop signal performance. Alcohol Clin Exp Res. 2009;33:740–750. doi: 10.1111/j.1530-0277.2008.00891.x. [DOI] [PMC free article] [PubMed] [Google Scholar]
- Li CS, Morgan PT, Matuskey D, Abdelghany O, Luo X, Chang JL, Rounsaville BJ, Ding YS, Malison RT. Biological markers of the effects of intravenous methylphenidate on improving inhibitory control in cocaine-dependent patients. Proc Natl Acad Sci USA. 2010;107:14455–14459. doi: 10.1073/pnas.1002467107. [DOI] [PMC free article] [PubMed] [Google Scholar]
- Lipszyc J, Schachar R. Inhibitory control and psychopathology: A meta-analysis of studies using the stop signal task. J Int Neuropsychol Soc. 2010;16:1064–1076. doi: 10.1017/S1355617710000895. [DOI] [PubMed] [Google Scholar]
- Logan GD. On the ability to inhibit thought and action: A users’ guide to the stop signal paradigm. In: Dagenbach D, Carr TH, editors. Inhibitory processes in attention, memory, and language. Vol. 1994. 1994. pp. 189–239. [Google Scholar]
- Logan GD, Cowan WB, Davis KA. On the ability to inhibit simple and choice reaction time responses: A model and a method. J Exp Psychol Hum Percept Perform. 1984;10:276–291. doi: 10.1037//0096-1523.10.2.276. [DOI] [PubMed] [Google Scholar]
- Logan J, Fowler JS, Volkow ND, Wang GJ, Ding YS, Alexoff DL. Distribution volume ratios without blood sampling from graphical analysis of PET data. J Cereb Blood Flow Metab. 1996;16:834–840. doi: 10.1097/00004647-199609000-00008. [DOI] [PubMed] [Google Scholar]
- Luijten M, Veltman DJ, Hester R, Smits M, Nijs IM, Pepplinkhuizen L, Franken IH. The role of dopamine in inhibitory control in smokers and non-smokers: A pharmacological fMRI study. Eur Neuropsychopharmacol. 2013;23:1247–1256. doi: 10.1016/j.euroneuro.2012.10.017. [DOI] [PubMed] [Google Scholar]
- Nandam LS, Hester R, Wagner J, Cummins TD, Garner K, Dean AJ, Kim BN, Nathan PJ, Mattingley JB, Bellgrove MA. Methylphenidate but not atomoxetine or citalopram modulates inhibitory control and response time variability. Biol Psychiatry. 2011;69:902–904. doi: 10.1016/j.biopsych.2010.11.014. [DOI] [PubMed] [Google Scholar]
- Nandam LS, Hester R, Wagner J, Dean AJ, Messer C, Honeysett A, Nathan PJ, Bellgrove MA. Dopamine D(2) receptor modulation of human response inhibition and error awareness. J Cogn Neurosci. 2013;25:649–656. doi: 10.1162/jocn_a_00327. [DOI] [PubMed] [Google Scholar]
- Nigg JT, Wong MM, Martel MM, Jester JM, Puttler LI, Glass JM, Adams KM, Fitzgerald HE, Zucker RA. Poor response inhibition as a predictor of problem drinking and illicit drug use in adolescents at risk for alcoholism and other substance use disorders. J Am Acad Child Adolesc Psychiatry. 2006;45:468–475. doi: 10.1097/01.chi.0000199028.76452.a9. [DOI] [PubMed] [Google Scholar]
- Oldfield RC. The assessment and analysis of handedness: The Edinburgh inventory. Neuropsychologia. 1971;9:97–113. doi: 10.1016/0028-3932(71)90067-4. [DOI] [PubMed] [Google Scholar]
- Perry JL, Carroll ME. The role of impulsive behavior in drug abuse. Psychopharmacology (Berl) 2008;200:1–26. doi: 10.1007/s00213-008-1173-0. [DOI] [PubMed] [Google Scholar]
- Picard F, Bruel D, Servent D, Saba W, Fruchart-Gaillard C, Schollhorn-Peyronneau MA, Roumenov D, Brodtkorb E, Zuberi S, Gambardella A, Steinborn B, Hufnagel A, Valette H, Bottlaender M. Alteration of the in vivo nicotinic receptor density in ADNFLE patients: A PET study. Brain. 2006;129 (Part 8):2047–2060. doi: 10.1093/brain/awl156. [DOI] [PubMed] [Google Scholar]
- Robinson ES, Eagle DM, Mar AC, Bari A, Banerjee G, Jiang X, Dalley JW, Robbins TW. Similar effects of the selective noradrenaline reuptake inhibitor atomoxetine on three distinct forms of impulsivity in the rat. Neuropsychopharmacology. 2008;33:1028– 1037. doi: 10.1038/sj.npp.1301487. [DOI] [PubMed] [Google Scholar]
- Saunders JB, Aasland OG, Babor TF, de la Fuente JR, Grant M. Development of the alcohol use disorders identification test (AUDIT): WHO collaborative project on early detection of persons with harmful alcohol consumption—II. Addiction. 1993;88:791–804. doi: 10.1111/j.1360-0443.1993.tb02093.x. [DOI] [PubMed] [Google Scholar]
- Sobell MB, Sobell LC, Klajner F, Pavan D, Basian E. The reliability of a timeline method for assessing normal drinker college students’ recent drinking history: Utility for alcohol research. Addict Behav. 1986;11:149–161. doi: 10.1016/0306-4603(86)90040-7. [DOI] [PubMed] [Google Scholar]
- Solanto MV, Abikoff H, Sonuga-Barke E, Schachar R, Logan GD, Wigal T, Hechtman L, Hinshaw S, Turkel E. The ecological validity of delay aversion and response inhibition as measures of impulsivity in AD/HD: A supplement to the NIMH multimodal treatment study of AD/HD. J Abnorm Child Psychol. 2001;29:215–228. doi: 10.1023/a:1010329714819. [DOI] [PubMed] [Google Scholar]
- St Onge JR, Abhari H, Floresco SB. Dissociable contributions by prefrontal D1 and D2 receptors to risk-based decision making. J Neurosci. 2011;31:8625–8633. doi: 10.1523/JNEUROSCI.1020-11.2011. [DOI] [PMC free article] [PubMed] [Google Scholar]
- Swick D, Ashley V, Turken AU. Left inferior frontal gyrus is critical for response inhibition. BMC Neurosci. 2008;9:102. doi: 10.1186/1471-2202-9-102. [DOI] [PMC free article] [PubMed] [Google Scholar]
- Tomasi D, Volkow ND, Wang R, Telang F, Wang GJ, Chang L, Ernst T, Fowler JS. Dopamine transporters in striatum correlate with deactivation in the default mode network during visuospatial attention. PLoS One. 2009;4:e6102. doi: 10.1371/journal.pone.0006102. [DOI] [PMC free article] [PubMed] [Google Scholar]
- Vink M, Kahn RS, Raemaekers M, van den Heuvel M, Boersma M, Ramsey NF. Function of striatum beyond inhibition and execution of motor responses. Hum Brain Mapp. 2005;25:336–344. doi: 10.1002/hbm.20111. [DOI] [PMC free article] [PubMed] [Google Scholar]
- Whelan R, Conrod PJ, Poline JB, Lourdusamy A, Banaschewski T, Barker GJ, Bellgrove MA, Buchel C, Byrne M, Cummins TD, Fauth-Buhler M, Flor H, Gallinat J, Heinz A, Ittermann B, Mann K, Martinot JL, Lalor EC, Lathrop M, Loth E, Nees F, Paus T, Rietschel M, Smolka MN, Spanagel R, Stephens DN, Struve M, Thyreau B, Vollstaedt-Klein S, Robbins TW, Schumann G, Garavan H. Adolescent impulsivity phenotypes characterized by distinct brain networks. Nat Neurosci. 2012;15:920–925. doi: 10.1038/nn.3092. [DOI] [PubMed] [Google Scholar]
- Winstanley CA, Theobald DE, Dalley JW, Cardinal RN, Robbins TW. Double dissociation between serotonergic and dopaminergic modulation of medial prefrontal and orbitofrontal cortex during a test of impulsive choice. Cereb Cortex. 2006;16:106–114. doi: 10.1093/cercor/bhi088. [DOI] [PubMed] [Google Scholar]
- Zandbelt BB, Vink M. On the role of the striatum in response inhibition. PLoS One. 2010;5:e13848. doi: 10.1371/journal.pone.0013848. [DOI] [PMC free article] [PubMed] [Google Scholar]
- Zhang S, Li CS. A neural measure of behavioral engagement: Task-residual low-frequency blood oxygenation level-dependent activity in the precuneus. Neuroimage. 2010;49:1911–1918. doi: 10.1016/j.neuroimage.2009.09.004. [DOI] [PMC free article] [PubMed] [Google Scholar]
- Ziolko SK, Weissfeld LA, Klunk WE, Mathis CA, Hoge JA, Lopresti BJ, DeKosky ST, Price JC. Evaluation of voxel-based methods for the statistical analysis of PIB PET amyloid imaging studies in Alzheimer’s disease. Neuroimage. 2006;33:94–102. doi: 10.1016/j.neuroimage.2006.05.063. [DOI] [PubMed] [Google Scholar]