Abstract
Ion mobility is not a newly discovered phenomenon. It has roots going back to Langevin at the beginning of the 20th century. Our group initially got involved by accident around 1990 and this paper is a brief account of what has transpired here at UCSB the past 25 years in response to this happy accident. We started small, literally, with transition metal atomic ions and transitioned to carbon clusters, synthetic polymers, most types of biological molecules and eventually peptide and protein oligomeric assembly. Along the way we designed and built several generations of instruments, a process that is still ongoing. And perhaps most importantly we have incorporated theory with experiment from the beginning; a necessary wedding that allows an atomistic face to be put on the otherwise interesting but not fully informative cross section measurements.
Keywords: Ion mobility, Mass spectrometry, Instrumentation, Modeling, Bio-macromolecules, Structure
1. Introduction
The concept of ion mobility has been around for a long time. It grew out of a fascination with electricity in the 18th century. Of the many experiments that took place, I will mention only two. Benjamin Franklin, in 1752, performed his famous kite experiment using a conducting cord terminated in an insulating silk ribbon and observed sparks jumping over the insulator to ground [1]. Inspired by this and other experiments, Coulomb, in 1795, built up a static charge on amber by rubbing it and noticed the charge gradually dissipated. He theorized that dust particles in the air collided with the amber, absorbed some of the charge and were repulsively ejected from the surface [2]. Fast-forwarding a hundred years, J.J. Thomson began his experiments at the Cavendish laboratory in Cambridge along with his student Rutherford, attempting to understand the nature of the charge carriers created by the recently discovered X-rays [3]. It was Thomson's student Rutherford that made the connection between the charge carriers and atmospheric aerosol particles [4]. Of course both of them would later receive Nobel Prizes for work that grew out of these early experiments. However, it was their French colleague Pierre Langevin that really began what has evolved into modern ion mobility. His experiments were among the first that directly measured ion mobility [5,6] but it was his exhaustive theoretical analysis that has stood the test of time [7] and laid the foundation for current analysis of the diffusion of ions through gases that we use today [8,9].
In this article I will give a retrospective of the ion mobility method (or ion mobility spectrometry, IMS) initially developed in our group in 1990 and its evolution to the present day. I realize that many others contributed to the growth of this powerful technique using different approaches from ours, some of which are found in articles in this special issue. However, in order to do justice to the entire filed, a much longer article would have to be written than the space available allows. In addition, the theme of this issue is tracing roots of developments to the 1960s. In my case these roots are found in the drift tube work of McDaniel [8] and the development of the flowing afterglow technique, especially as developed in Boulder, Colorado [10,11]. An article related to this latter development written by Veronica Bierbaum is found elsewhere in this issue so the details can be found there.
We got our first experimental experience with ion mobilities when we built a new ion source to add to the front end of our ZAB-2F reverse-geometry mass spectrometer [12]. This source was temperature variable from 80 to 550 K and had a coaxial electron beam for ionization. A schematic is given in Fig. S1 in the Supplemental information. The intention of building the source was to measure both association (three-body) rate constants and equilibrium constants of simple diatomic and triatomic gases. In vetting the source we measured mobilities of several rare gas ions in rare gas neutral bath atoms and extended current measurements in the literature at the time. However, we did not really get rolling on IMS until 1990 when our good friend serendipity tapped us on the shoulder. By this time we had constructed a home-built reverse geometry (i.e., magnet then electric sector) instrument and following the electric sector we had added some deceleration and pulsing lenses and a new temperature dependent drift cell [13,14]. Inspired by the selected ion flow tube (SIFT) instrument of Adams and Smith [15] we decided such an instrument would add a new experimental dimension to our group. In particular we were interested in looking at the reaction chemistry of transition metal ions with alkanes [16,17] and other hydrocarbons which was a hot topic at the time [16–22].
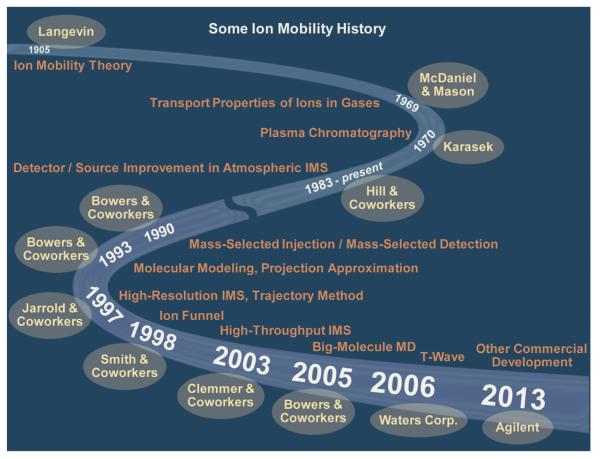
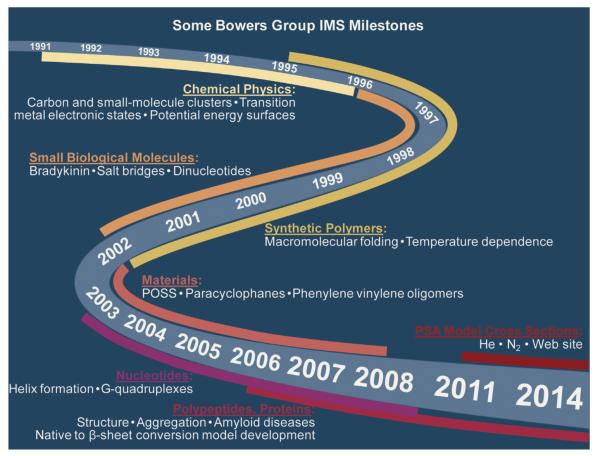
We will talk about the instrument we developed to do the work described above and how serendipity redirected our efforts in the next section where specific advances are outlined. Here we would like to conclude our introductory remarks by giving a broad brush to IMS advances as shown in Figs. 1 and 2. In Fig. 1 we outline the most important events that allowed our group to get involved with IMS and contribute to it. As mentioned above the real giants were Langevin and McDaniel who developed the physics underlying ion mobility. Other important events are noted and the people or companies responsible for them highlighted. Herb Hill especially deserves mention as the prime mover of the early analytical development of the technique [23] and contributes an article elsewhere in this special issue. Martin Jarrold and coworkers [24] developed the first high resolution version of drift cell IMS which inspired our high resolution instruments (more later). The whole field might simply have died out had Smith and coworkers [25] at PNNL not come up with the ion-funnel. And finally Waters Corp. deserves much credit for developing their novel T-wave version of IMS that put the technique in the hands of the broader research community [26].
Fig. 1.
Major contributions and approximate dates to advances in IMS. Names are given where appropriate. The advances noted are limited to drift cell IMS with the exception of the T-wave development by Waters Corp.
Fig. 2.
Major milestones for the evolution of IMS in the Bowers group at UCSB. Approximate dates are given in the center ribbon with time windows for the features noted given by the outer ribbons.
Milestones of my group are given in Fig. 2 and the time spans associated with them. We will comment at least briefly on these developments, as well as several others shown in Fig. 1 in the following sections. What should be appreciated is our efforts began with atomic and smaller molecular systems and gradually progressed to more and more complex systems and assemblies. Associated with this development was an essential theory component, especially the growing sophistication of the molecular dynamics required to connect our cross section measurements to real atomic structures. We started with atomic transition metal ions and at present are deeply involved with assembly of complex and biologically important peptide and protein molecules. As we progressed we realized that new, more accurate algorithms were needed to augment our early projection approximation (PA) for determining cross sections from model structures. While the PA is very fast it is only accurate for molecules/assemblies with up to 200 atoms [27,28] and it rapidly becomes a lower limit for larger systems since it does not accurately account for concave portions of the structure. Understanding this limitation, Jarrold and coworkers [29,30] developed an elegant trajectory scattering method (TJM) that worked well for larger systems but rapidly became very time consuming as systems became larger than small proteins. Since the IMS field continues to progress to larger and larger systems a new algorithm was required. The goal was to maintain some of the speed of the projection approximation and retain the accuracy of the trajectory method. Christian Bleiholder, while a postdoc in my group, did just that by development of the projection superposition approximation (PSA) [31–35]. This new method is 100–1000 times faster than the trajectory method and maintains its accuracy. A brief summary will be given later in the paper.
2. IMS milestones
Below I summarize (usually) short stories about events that have had an important impact on IMS development in our group these past 25 years. Some are instrumental and some deal with new systems and analysis methods but all were important to us. In Supporting Information I give a brief primer of the IMS method so that those not familiar with it can follow the narrative given in the next sections.
2.1. Electronic state chromatography
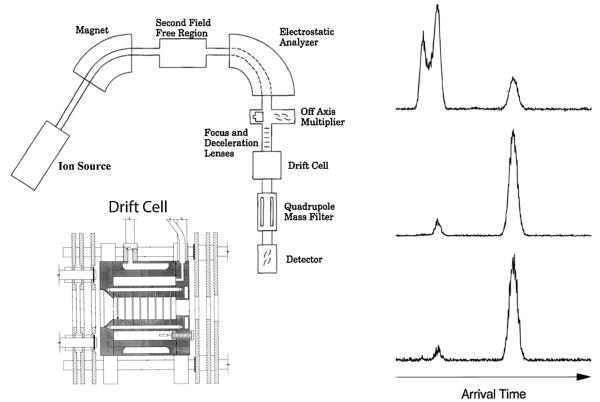
I mentioned in Section 1 that serendipity played a major role in getting us into ion mobility. We had developed a successful collaborative program with Jack Beauchamp's group at Caltech extracting details of potential energy surfaces and reaction dynamics of the interaction of 1st row transition metal ions with hydrocarbons. The primary tool we used was measurement of kinetic energy release distributions from metastable reactions of M+(alkane) systems formed in the ion source of the ZAB-2F [16–22]. Our goal was to expand these studies by measuring reaction kinetics. In order to do this, we constructed the instrument [13] shown in Fig. 3. We would form transition metal ions in the source, mass select them and inject them into the reaction cell which was temperature variable. In order to thermalize the metal ions we would have only a small fraction of reactant neutral (<1%) in a helium bath gas in the cell. To get rate constants we needed the reaction time in the cell. We installed an electronic gate at the entrance to the cell to admit a short pulse of ions and then measured an arrival time distribution (ATD) at the detector. We did these experiments in the absence of reactant neutral. To our surprise and consternation we obtained a bimodal ATD for the atomic cobalt ion. After weeks of trying different Co+ sources and eliminating the possibility of organic contaminants (these were mass selected experiments) we were convinced we had pure Co+. The answer, in hindsight, was simple. Our Co+ sources were making both ground state Co+(3d8) and excited state Co+(3d74s1) ions. When the small 3d8 ions interacted with helium they formed transient Co+(3d8). He clusters but the large size of the s-orbital prevented this from occurring for Co+(3d74s1) ions. Hence the Co+(3d74s1) ions traversed the cell much more quickly than the Co+(3d8) ions leading to the bimodal ATD [13,14].
Fig. 3.
Left panel: At top a schematic of the overall instrument with the components labeled. At bottom a schematic of the temperature-dependent drift cell. Right panel: ATD for V+ atomic ions; top from electron impact on VCl4, middle from CID of VCl+ injected at high energy; bottom from VO+ injected at high energy. The peak at longest time in all cases corresponds to ground state 5D 3 (3d4), the doublet in the top ATD to 3F (3d34s1) and 5F (3d34s1) excited states and the shorter time peaks in the lower two ATDs to the 5F (3d34s1) excited state. Figure adapted in part from Refs. [13] and [37].
As you can imagine we got very excited about this “chance” result. We found sources of most first row transition metal ions and measured the ATDs of each, often with variable source conditions. Since transitions between d- and s-electrons are parity forbidden we were able to form and unambiguously identify electronic state distributions in essentially all cases [36]. In the case of Ti+ we were able to not only separate the a4F(4s13d2) ground state and the b4F(3d3) first excited state we could also separate the a4F(4s13d2) and a2F(4s13d2) spin states, results we were able to demonstrate for V+ ions as well (see Fig. 3) [37]. We did make use of this new separation method to study state selected chemistry between transition metal ions and hydrocarbons [16,17] which added a nice new wrinkle to the reasons we built the instrument in the first place. In addition, we used the new instrument to accurately measure binding energies and entropies of metal ions with a variety of ligand systems by taking advantage of the mass selection of the reactant ion and the T-dependence of the drift cell [38,39].
2.2. Clusters and the age of carbon
At the time of the discovery described in Section 2.1 above, our group had been involved with clusters for some time, usually forming them in a high pressure ion source. Our primary focus was on atmospherically interesting clusters and their photodissociation dynamics [40,41]. However, the new instrument allowed us to greatly expand our efforts into transition metal cluster chemistry [42,43] and carbon cluster properties [44,45]. These new studies were made possible by integrating a “Smalley” type laser desorption source in place of the regular ion source. The real breakthrough occurred when Gert von Helden, a PhD student in my group, realized we could not only separate transition metal ion electronic states but we should also be able to separate carbon cluster ion shapes! By 1990 it was known that C60 was mysteriously formed in carbon arcs and that it had the soccer-ball shape [46,47], confirming early speculation by Smalley, Kroto and Curl [48]. However, essentially nothing was known about smaller carbon clusters or the growth mechanism in the plasma.
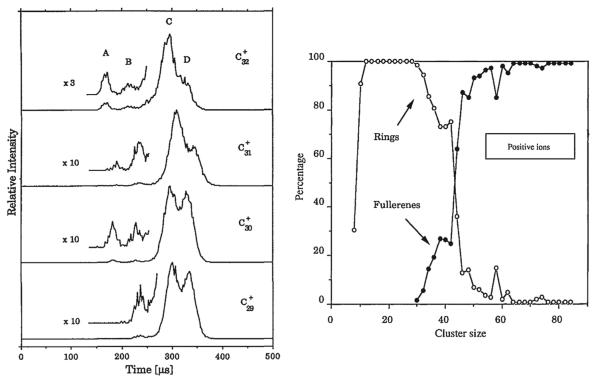
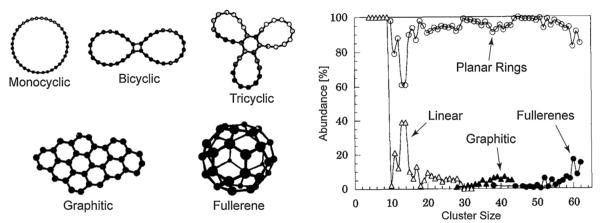
That all changed one afternoon during the inaugural Gas Phase Ion Gordon Conference in Ventura. I drove back to Santa Barbara after lunch and Gert showed me this incredible result. Single peak ATDs were observed for C3+, C4+, C5+, C6+ but C7+ showed a beautifully bimodalATD. We immediately understood the implication:C4+ to C6+ were linear but C7+ was both linear and cyclic [49]! We made a view graph and I used my clout as a founder of the Gordon Conference to show the results during the evening session. Gert rapidly marched up the cluster size ladder until reaching C82+ [50]. A small selection of these results are given in Fig.4. There are clearly four features present in the ATDs for C30+, C31+ and C32+ but only three features for C29+ [51]. The new feature at C30+ at shortest times was the smallest fullerene we could detect in our experiments (peak A). The major features in this size range were planar ring structures: bicyclic (D) and tricyclic (C). The small feature (B), first appearing at C29+ was later identified as a graphitic fragment.
Fig. 4.
Left panel: ATDs for C29+, C30+, C31+ and C32+. ATD features are A = fullerene, B = graphitic, C = tricyclic planar ring, D = bicyclic planar ring. Right panel: plot of % total abundance for rings and fullerenes versus cluster size for Cn+ cluster ions. Figure adapted from Refs. [53] and [51].
The graph of percentage of structures found versus cluster size for positive ions is interesting (Fig. 4). At smallest sizes linear structures dominate (not shown) but above n = 10 rings are king. Fullerenes come on the scene at n = 30 and become dominant above n = 45. How does this transition occur? We did a simple experiment to find out. The results shown in Fig. 4 were obtained by injecting the mass selected carbon cluster ions into the drift cell at low energy. However, when injected at higher energy both annealing and fragmentation occurred. For example C37+ is dominantly tricyclic (60%) and bicyclic (40%) rings at low energy. However, when injected at high energy, things change, as shown in Scheme 1. The fragmentation is about evenly split between the formation of fullerenes (loss of C and C3) and monocyclic rings (loss of C14, C18, and C22). Hence the kinetically favored ring systems give way to energetically favored fullerene systems when energized and this process increases in probability with cluster size. In addition, monocyclic rings are shown to be energetically favored over bicyclic and tricyclic rings, and some ring sizes are strongly favored over other ring sizes.
Scheme 1.
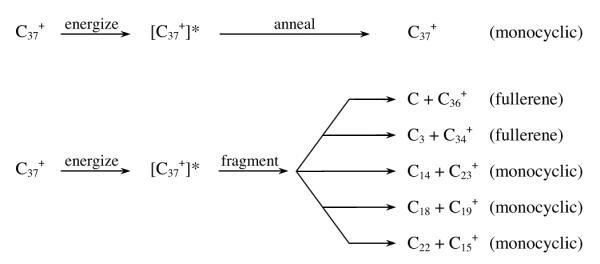
Outcomes from energizing a specific carbon cluster.
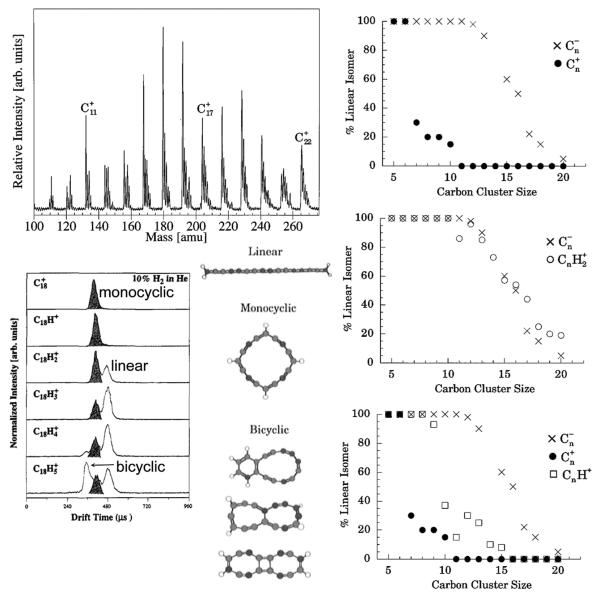
The role of charge is large in carbon clusters. The results for negative cluster ions are shown in Fig. 5 [52]. Linear species are detected almost to C30−, but notice linear C10− is 100% and linear C11− is 0% showing the most dramatic change observed. Planar rings then totally dominate and only near and above C60− does it appear fullerenes begin to compete. The effect of charge can be shown in another way. CnH2+ is isoelectronic with Cn−. Consequently we did an experiment where the helium expansion gas in the laser ablation source was seeded with H2 [53]. Selected results are given in Fig. 6. The ATDs for C18+ to C18H5+ are revealing. As expected C18+ is a pure monocyclic ring. However, a linear isomer appears at C18H2+ and is dominant at C18H4+. Also a bicyclic ring appears at C18H4+ and is very prominent at C18H5+. Structures consistent with these results are given in the middle panel. Finally at the far right a plot of % linear versus cluster size is given. For Cn+, linear isomers are gone by n = 10 (top). The middle panel compares Cn− and CnH2+ with essentially identical isomeric preferences shown confirming their isoelectronic character. The bottom panel shows that CnH+ splits the difference between Cn+ and Cn−, and suggests that CnH+ ions provide good structural models for Cn neutral species. And finally, addition of hydrogen completely quenches fullerene formation but does induce the beginnings of what appear to be polycyclic aromatic hydrocarbons (PAHs).
Fig. 5.
Left panel: Isomeric forms of C36. Right panel: Plot of total % of isomer abundance versus cluster size for linear, ring, graphitic and fullerene isomers for Cn-cluster ions. Figure adapted from Ref. [52].
Fig. 6.
Upper left: Mass spectrum from a carbon laser desorption source with a 90% He and 10% H2 expansion gas. Lower left: ATDs of the C18Hn+ peaks for n = 0 to 5. Lower middle: structures for various isomers of C18H4+. Right panels: plot of percent linear isomer versus n for the three cases shown. Figure adapted in part from Ref. [53].
Before leaving this topic one additional system will be mentioned. Castleman and coworkers [54–56] observed that magic numbers appeared in mass spectra for metal-carbon composites of stoichiometric formula M8C12+. They proposed these species had a structure with the metal atoms at the corners of a cube and C2 molecules raised off each cubic face giving a dodecahedral Th symmetry to the structure. Castleman termed this new class of molecules Met-Cars and spent considerable effort attempting to make them in bulk but did not succeed. What did happen was a flurry of theoretical efforts attempting to predict different stable M8C12 structures [57–59] including unique metal “cubic” structures proposed by Pauling [60] and Khan [61]. The lowest energy structures predicted by theory were D3d isomers of the Th icosahedral structure described above, all of which had significant metal–metal bonding (see Ref. [59] for structures).
Since there was no spectroscopic experimental way to distinguish these structures, because they could not be isolated in bulk, we decided to look at them using IMS [62,63]. The experiments involved laser desorption from a titanium rod and a helium expansion gas seeded with 1% CH4. A mass spectrum showed peaks separated by 12 mass units and a very dominant “magic” peak corresponding to Ti8C12+. There were also significant peaks at Ti7C12+ and Ti8C13+. We measure cross sections for all of them and compared them with the theoretical structures. For the main Ti8C12+ species we got best agreement with the icosahedral Th structure proposed by Castleman (+1.4% deviation) and a distorted form of this structure theoretically predicted to be lower energy (+3.4%). The cubic structures of Pauling (−8.2%) and Khan (−17.2%) could be ruled out. The dodecahedron basic structure was consistent with our models for Ti7C12+, Ti8C11+ and Ti8C13+ all of which agreed within 2% of experiment. Hence, IMS was shown to be a unique and valuable structural tool, not only for carbon clusters but for mixed carbon/metal clusters as well.
2.3. MALDI: polymers, nucleotides and peptides
Up to this point the only systems we could access were those formed by electron impact or by our Smalley type laser desorption cluster source. Our interests were getting broader including both synthetic and biologically interesting polymers. Hence, we designed a novel matrix assisted laser desorption ionization (MALDI) source that allowed long sampling times necessary for IMS studies [64]. A schematic of this source is given in Fig. S2 in Supplementary material. Basically we combined analyte and matrix into a paste and coated a cylinder with it. We then inserted the cylinder onto a translation/rotation drive. The laser was focused to intersect the edge of the cylinder and eject material at right angles which was then accelerated and introduced into the mass spectrometer/IMS instrument. Some brief comments follow on examples of polymers, nucleotides and peptides.
2.3.1. Polymers
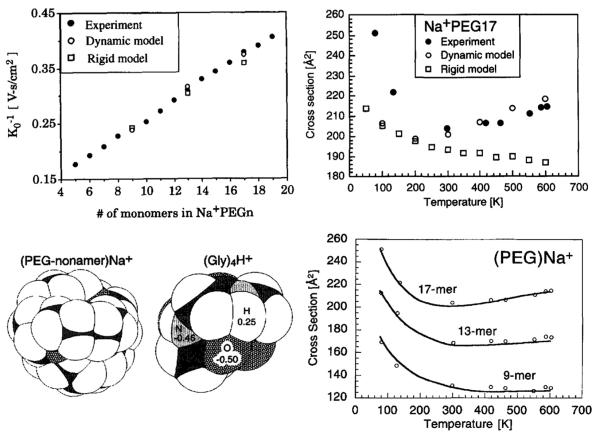
The first systems we looked at were polyethylene glycol (PEG) polymers [64,65] and the related 18-crown-6 crown ethers [66], all cationized by sodium ions [64–66] or by all of the alkali ions [67,68]. First the Na+ cationized PEG results. All ATDs for PEG3–PEG19 were single, narrow peaks indicating a single dynamically averaged structure of this size range (see Fig. S2). The results are summarized in Fig. 7. A plot of the reciprocal of the reduced mobility of Na+(PEG)n versus n is given in the top left panel showing a near linear increase with size. In the top right panel the Na+PEG17 cross section is shown as a function of temperature from 80 to 600 K. The cross section sharply drops between 80 and 300 K and then slowly increases between 300 and 600 K. At fist this was a very puzzling result. In order to begin to understand it we measured the C60+ cross section from 80 to 600 K and observed it decreased monotonically from 80 to 600 K. Since we knew the shape of C60+ was not changing over this temperature range, the C60+–He interaction potential must be involved.
Fig. 7.
Upper left: K0−1 versus n in Na+(PEG)n polymers. Upper right: cross section for Na+(PEG)17 versus temperature. Lower left: lowest energy structures of Na+(PEG)9 and (Gly)4H+. In both structures white represents hydrogen, gray oxygen or nitrogen, black carbon. Lower right: cross section versus temperature for Na+(PEG)17, Na+(PEG)13 and Na+(PEG)9. Open circles experiment and lines theory (see text). Figure adapted from Refs. [28] and [64].
The increase in cross section above 300 K for Na+PEG17 suggested the molecule might be unraveling as temperature increased. Hence molecular dynamics simulations were indicated to test this possibility. As a consequence the following protocol was initiated [65]. We used a variable parameter 12-6-4 model for the interaction potential, MM3 to set the Lennard-Jones (LJ) parameters [69] and the Amber suite of programs for the MD calculations [70] with parameters optimized for crown ethers [71]. Theoretical models are compared with experiment in the top right panel of Fig. 7: a rigid model where the lowest energy structure is maintained throughout and a dynamic model where the lowest energy structure is allowed to change with temperature. Clearly the rigid model does a poor job of reproducing the Na+PEG17 data at any temperature while the dynamic model does a good job from 300 to 600 K but fails below 300 K. At low temperature is where the interaction potential comes into play indicating the MM3 parameters are flawed.
This issue is addressed in the lower half of Fig. 7. In the left hand panel the lowest energy MD structures of Na+PEG9 and (Gly)4H+ are given. The temperature dependence of these systems was measured (data not shown) and fit with a generalized interaction potential to yield H–He LJ parameters. In addition the C60+ T-dependence yielded C–He LJ parameters [28]. These were then used in place of the MM3 parameters and yielded the solid lines given in the right hand lower panel for Na+PEG9, Na+PEG13 and Na+PEG17. Clearly there is now excellent agreement with experiment over the entire temperature range. This early attempt at understanding the structure and dynamics of flexible molecules taught us that the ion–neutral interaction potential was very important and that molecular dynamics simulations were essential for understanding structures and their change with temperature. The first point was crucial in theoretical developments for calculating cross sections from model structures [28,29,31–35] and the second that MD simulations were required in obtaining appropriate model structures.
We pursued synthetic polymer structures seeking to understand general trends in their folding. We were greatly assisted in these efforts through collaboration with Jim Scrivens who was then employed at ICI in the UK. Systems included poly(ethylene terephthalate) (or PET) [72,73] poly(methyl methacrylate) [74], polystyrene [75] and others. The PET systems [72,73] gave us the first examples of multiple structures of synthetic polymers and emphasized the importance of temperature dependence studies to analyze them. More on this point in the nucleotide section.
Finally Mike Berman, our grant monitor from the Air Force Office of Scientific Research (AFOSR), convinced us to study polyhedral oligomeric silsesquioxane (POSS) systems [76]. The most common POSS unit is a cube with silicon atoms at the corners and oxygen atoms bridging each edge yielding an Si8O12 core unit. Other POSS cages were possible as well (Fig. 8). The Air Force was interested in attaching POSS units to polymer backbones to make lightweight, chemically resistant coatings for aircraft and other high flying objects. Each silicon atom had three SiO bonds and a dangling bond that could be used for polymer attachment (or else capped with an appropriate ligand). The idea was to eventually look at large systems and so AFOSR funded a new instrument with a MALDI source, a reflectron-TOF front end, a reaction/drift cell and a 4000 amu quadrupole analyzer before the detector [77]. A schematic is given in Fig. 8, left panel. In the right panel we give schematics of the most common POSS cages, of which R8T12 was the one we investigated for the most part [77–79]. Table 1 shows the excellent agreement obtained between measured cross sections by IMS (formed by both ESI and MALDI), cross sections calculated from X-ray structures and cross sections obtained from MD modeling of the sodiated systems. While this work indicated IMS was a valuable tool in POSS structural studies, our collaborators at Edwards AFB eventually were not able to sustain their synthetic studies and unfortunately the work had to be abandoned.
Fig. 8.
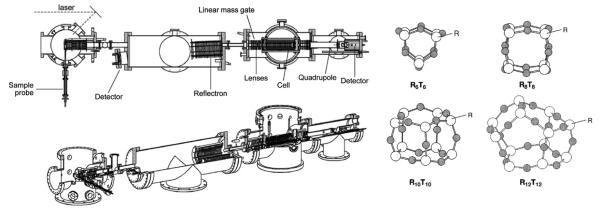
Left panel: schematic of MALDI instrument. Components noted on upper diagram. Right panel: schematic representations of POSS cages. Silicon atoms are open circles and oxygen atoms, gray circles. Ligands cap all silicon atoms. Figure adapted from Refs. [76] and [77].
Table 1.
Collision cross-sections (Å2) of selected POSS compounds [76].
| Name | X-raya,b | ESI (Na+) | MALDI (Na+) | Theory (Na+) |
|---|---|---|---|---|
| Cy6T6 | 224 | 221 | 225 | 222 |
| Bz8T8 | 265 | |||
| Ph8T8 | 260 | 263 | 267 | |
| Sty8T8c | 341 | 340 | 338 | |
| 330 | 328 | |||
| 324 | 320 | |||
| 310 | 307 | |||
| 293 | 295 | |||
| Vi10T10 | 189 | 193 | 192 | |
| Vi12T12 | 212 | 214 | 216 | 216 |
| H14T14 | 137 | 139 | ||
| Cp4D4(OH)4 | 154 | 157 | 153 | |
| Cy6T4D2(OH)2 | 222 | 220 | 222 | 222 |
| Cy7T4D3(OH)3 | 248 | 247 | 254 | 251 |
Structures obtained from Dr. Tim Haddad at ERC Inc.–Air Force Research Laboratory.
Calculated value for the neutral species.
There were five different conformations of the styrl groups capping the silicon atoms observed in the ATD [77].
2.4. Nucleotides
We first got interested in nucleotides when Franz Hillenkamp approached me at the ASMS meeting in Long Beach in 2000. Franz was excited and wondered if I had seen his poster (I had not! There were about 1500 posters that year and we were not yet involved with nucleotides). Undeterred he told me that he and Mike Gross thought nucleotide fragmentation involved zwitterions [80,81]. He wondered if we could use IMS to see if zwitterions were implicated. I asked how big were the nucleotides, and he said tetramers or hexamers. In ignorance I said “no problem” and gave the problem to an excellent student in my group, Jennifer Gidden.
2.4.1. Small systems: folding barriers
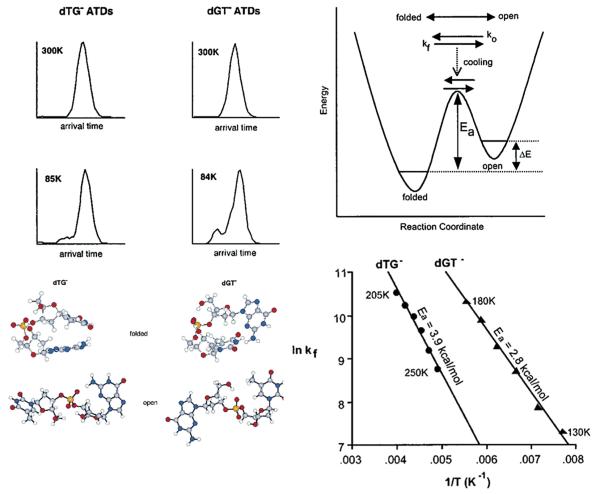
Jennifer ordered some tetranucleotides (all forms with 3T and 1G base, as indicated in the Hillenkamp/Gross work) and we dutifully put them in our MALDI source. The zwitterion forms were implicated in the Hillenkamp/Gross work in the fragmentation of the deprotonated negative ions. This presented some initial technical problems as we had only done positive ions to that point using our MALDI source. Once these were solved, real issues arose. We needed to match our experimental cross sections with MD generated model structures and we did not know how to proceed, not having modeled nucleotides before. Hence, we backed off and started with dinucleotides [82,83]. This turned out to be a wise choice. An example is given in Fig. 9 for the dTG− and dGT− pair. At low temperature the ATD becomes bimodal revealing two non-interconverting isomers. A schematic potential energy surface indicates what is occurring. As temperature drops the interconversion rate slows eventually stopping when the barrier height is reached. By modeling the shape of the ATD as a function of temperature [84] it was possible to extract the unfolding rate constant and via a plot of lnkf vs. 1/T obtain the isomerization barrier. By looking at all 16 possible dinucleotides we were able to retrieve 12 barrier heights varying from 0.8 to 12.9 kcal/mol. We found 3 structural families: an open form and two folded forms, one involving π-stacking of the bases and the other hydrogen bonding between the bases.
Fig. 9.
Upper left: ATDs of dTG- and dGT- at 300 and 85 K. Lower left: structures corresponding to the features in the ATDs. The open structures come at longest times. Upper right: schematic potential energy surface showing how the ATDs evolve with temperature when injected into the cell at high temperature. Lower right: lnkf versus 1/T plots obtained from a kinetic fitting of the ATDs as a function of temperature (see text). Figure adapted from Ref. [82].
We did make a good faith effort to see if zwitterions were present in the trinucleotides dGTT−, dTGT− and dTTG−. The ideas was to protonate the G-base and deprotonate both phosphate linkers. We modeled this structure for dTGT− along with singly deprotonated phosphates for all three systems and found the data fit only the single deprotonated isoform [85]. Hence, zwitterions are not present as ground state structures but might be transitional structures during dissociation.
2.4.2. Larger systems: helix onset
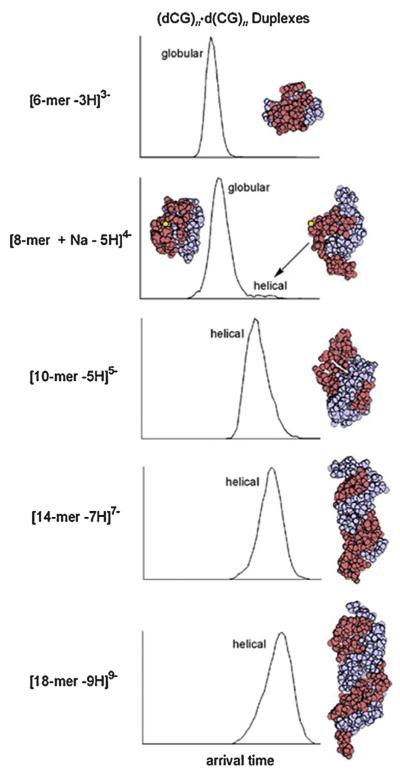
DNA is the iconic molecule in biology, made famous when its double stranded helical structure was determined [86]. It turns out there are several helical structures. The dominant one is the B-helix, a right-handed helix that DNA forms in solution [87]. Another common form is the A-helix, also right-handed but fatter and shorter than the B-helix and formed in “low humidity” circumstances [88]. And finally, there is the Z-helix, left-handed and longer and skinnier than the B-helix formed under high salt conditions [89]. While DNA duplexes had long been observed using mass spectrometry [90,91] there was almost no information on their detailed structure. We hoped IMS could address that point. Our initial studies [92] involved d(CG)n · d(CG)n duplexes with n = 2–9. The results are summarized in Fig. 10 and Table 2. We had developed protocols for making duplexes from single strands [92]. We first did CD measurements and observed unambiguous B-helix formation for n as small as 3 and robust B-helix formation for n ≥ 7. IMS data were then taken on our new electrospray instrument [93] that will be discussed in the peptide section. In Fig. 10 we show the n = 3 duplex is globular, the n = 4 duplex (i.e., an 8-mer) nearly purely globular but by n = 5 the duplex is purely helical and remains so for larger n. In Table 2 we show that the helix formed is an A-helix – the one favored in “low humidity” environments. We had evidence that we were forming B-helix in the solutions we sprayed so we opined that there was a B → A transition as the solvent evaporated before IMS could be done.
Fig. 10.
Sequence of ATDs and lowest-energy structures from MD simulations for the duplexes shown. The cross sections and structural assignments are given in Table 3. Figure adapted from Ref. [92].
Table 2.
Experimental and theoretical collision cross sections (Å2) of the d(CG)n duplexes [92].
| Theorya |
|||||
|---|---|---|---|---|---|
| Duplex | Expt | Globular | A-helix | B-helix | Z-helix |
| [4mer + Na − 4H]3− | 352 |
|
407 | 392 | 405 |
| [6mer − 3H]3− | 430 |

|
533 | 515 | 502 |
| [8mer + Na − 5H]4− | 536, 667 |

|

|
643 | 654 |
| [10mer − 5H]5− | 718 | 640 |

|
783 | 763 |
| [14mer − 7H]7− | 1006 | ||||
| [14mer − 9H]9− | 1013 | 850 |

|
1034 | 1035 |
| [14mer + NH4 − 8H]7− | 1011 | ||||
| [18mer − 9H]9− | 1268 | ||||
| [18mer − 11H]11− | 1272 | 991 |

|
1221 | 1205 |
| [18mer + NH4 − 10H]9− | 1265 | ||||
The assigned structures from the theoretical modeling are enclosed in boxes.
At this point Jennifer Gidden had finished her PhD and handed the reins of the nucleotide project to Erin Baker. Erin decided to extend the size of the d(CG)n d(CG)n duplexes and to initiate MD simulations to follow structural changes [94]. While the details will not be given here, Erin found the following. Experimentally for 4 ≤ n ≤ 10, the duplex structures were A-helix, for 10 ≤ n ≤ 15 the structures were both A-helix and B1-helix and for n ≤ 15 the structures were both B1-helix and B2-helix. These results were fully consistent with the MD results. For n = 9, when starting from the solution state B-helix structure, the B1 structure was formed in the first hundred picoseconds and was retained for 2 nanoseconds (the extent of the run). However, for n = 15 the B-helix formed first a B2-helix (within 10 picoseconds), retained this structure for 200 picoseconds and then transformed to a B1-helix. The B2-helix was very similar to the solution B-helix except for minor restructuring of the major groove due to loss of water. The B1-helix, however, developed a major kink along the helix axis and thus formed a more compact structure than the B2-helix but was still longer than the comparable A-helix. A major take home message from this work is that DNA will retain its solution structure, with only small changes if the duplex is big enough, over the lifetime of the IMS measurement (milliseconds to hundreds of milliseconds) and that IMS is a valuable probe of biopolymer structure.
While other DNA structures were of interest to us, like knots, hairpins and cruciforms [95], the real target became G-quadruplexes and their role in telomere maintenance and gene silencing. I first became aware of them from a cover article in C&E News on telomeres about the time we found we could not understand simple tetranucleotides and were retreating to dinucleotides. I pointed to the cover and told Jennifer Gidden this is where we are heading and she gave me one of those “oh, sure” looks and I smiled and walked away. G-quadruplexes are next.
2.4.3. G-quadruplexes: an IMS success story
While duplex DNA is certainly the dominant biological form of polynucleotides, as noted above, there are other important forms. Perhaps most important of these other forms is the G-quadruplex. A G-quadruplex is a stack of four G-bases (i.e., G-quartets). G-quadruplexes are formed in G-rich regions of DNA such as the telomeres that cap chromosomes [96], where T1 = TTAGGG repeats itself hundreds to thousands of times, and in the promoter regions of many genes [97]. In fact now that the human genome has been sequenced, over 300,000 G-rich regions have been identified [98]. Our interest was initially piqued when magic numbers of guanine [99,100] or guanosine [101] clusters were reported in electrospray mass spectra. And while structures were inferred from these results they were not proven. Hence we decided to investigate the self-assembly of guanosine in ammonium acetate buffer solutions to see if IMS would reveal structures [102].
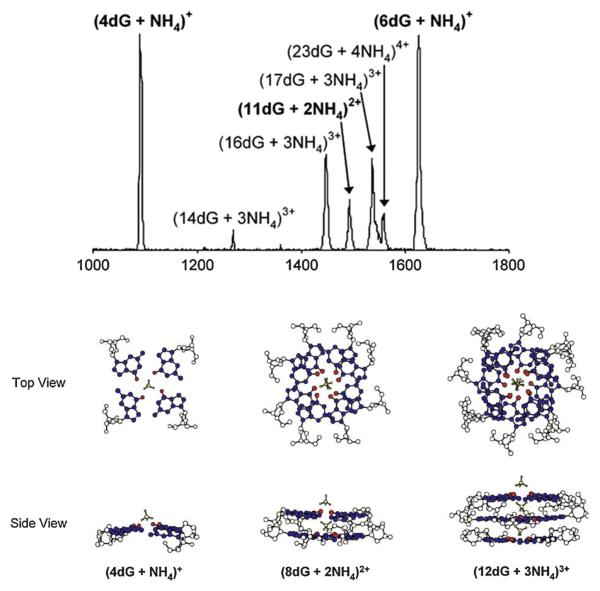
A partial ESI mass spectrum is given in the top panel of Fig. 11. While ATDs and corresponding cross sections were obtained for all peaks, we will only focus on two of them. Here the ATD of the peak at m/z = 1086 labeled (4dG + NH4)+ has three peaks which were unambiguously identified as (4dG + NH4)+, (8dG + 2NH4)2+ and (12dG + 3NH4)3+. In each case the cross sections corresponded with the G-quartet structure given in the bottom panel of Fig. 11, where both top and side views are given. The G-quartet structure turned out to be robust with all peaks shown in the mass spectrum dominated by G-quartet structures even when complete G-quartet could not be formed (as in (11dG + 3NH4)3+, for example). Extensive molecular dynamics simulations were done to investigate intrinsic stabilities of globular and single G-quartet structures with globular structures 10 kcal/mol more stable than the single G-quartet structure. Nonetheless, only the G-quartet structure was observed experimentally for (4dG + NH4)+ (σGQ = 288 Å2, σGlob = 227 Å2 and σExp = 288 Å2). For (8dG + 2NH4)2+ the molecular dynamics scatter plot was dominated by the two stacked G-quartets structures, which were found to be 10 kcal/mol more stable than the globular structures, and for (12dG + 3NH4)3+ only G-quartet structures were found in the scatter plots. In both these latter 2 cases excellent agreement with experiment was found.
Fig. 11.
Upper panel: Mass spectrum of self-assembled guanosine. Lower panel: structures of the three peaks in the ATD of the nominal (4dG + NH4)+ mass spectral peak. Figure adapted from Ref. [102].
Finally, a similar analysis was done for the (6dG + NH4)+ peak at m/z = 1620. Here four features were found in the ATD corresponding to (6dG + NH4)+, its dimer, trimer and tetramer. The monomer (6dG + NH4)+ peak yielded a cross section that correlated to globular but all other features were composed G-quartets with the tetramer corresponding to six stacked G-quartets. The important message here is that G-quartets are very stable structures and if it is possible to form them in multiple layers (i.e., in G-quadruplexes) it appears that they will form in appropriate stretches of DNA.
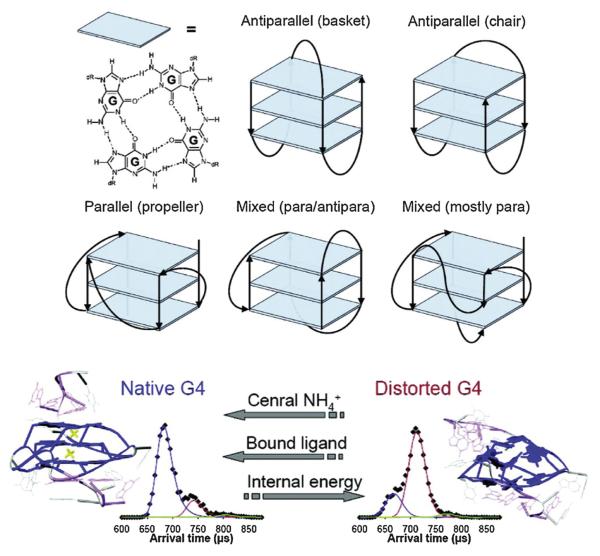
We tested this conclusion with a number of studies [103–106]. The difference between guanosine self assembly and G-quad-ruplexes is that there needs to be DNA linkers to generate each G-quartet planar region and these can be of varying length and composition. This leads to a number of different G-quadruplex geometries with the most common ones shown in Fig. 12. Our first study was a collaboration with Jon Sessler [103] on the stabilizing effect of specific oligopyrrole macrocycles on T4 telomere repeats (i.e., (TTAGGG)4). It was found that T4 formed antiparallel chair and/or basket structures and that the stabilizing effect of the macrocycle depended strongly on its size, with size matching of the cyclopyrrole to the G-quartet yielding the most stable adduct.
Fig. 12.
Upper panel: common forms of G-quadruplexes formed by stacking of linked G-quartets. Lower panel: ATDs shown (at left) a stabilized form of a G-quadruplex (largest peak at early time) and (at right) a destabilized G-quadruplex (ATD peak at longer time). Energy destabilizes but addition of NH4+ between G-quartet layers or planar ligands externally stacked stabilizes the G-quadruplex. Figure adapted from Ref. [105].
Next, we looked at a series of potential stabilizing ligands, three of which were strong telomerase inhibitors and two commonly used multi-ring planar ligands [105]. We used different telomere repeat lengths [104] and also two stretches of G-rich DNA found in the c-myc cancer gene promoter region that were known to form G-quadruplexes in solution. We also looked at the effect of cations (NH4+) in stabilizing the quadruplexes. The net results are summarized in Fig. 12 and Table 3: Both ligands and NH4+ stabilize the quadruplexes and introducing energy destabilizes them. All ligands we found to end-stack stabilize with no intercalation observed. The primary take home messages are that quadruplex structures found in solution, as confirmed by CD [102–106] and NMR [107], are maintained following solvent evaporation and IMS analysis. These results parallel those found for DNA double helix structures for n ≥ 15 as discussed earlier. Hence, DNA structures are much less dependent on solvent than peptides and most small proteins, a topic we will deal with next.
Table 3.
Comparison of solution and solvent-free G-quadruplex structures.a
| Systemb,c | Solution | Solvent-free |
|---|---|---|
| NMR/CD | IMS/modeling | |
| 4 × T1 | Parallel | Parallel |
| 2 × T1 | Mixed | Antiparallel |
| T3.5 | Antiparallel | Antiparallel |
| T4 | Antiparallel | Antiparallel |
| T6 | Antiparallel | Antiparallel |
| Pu22 | Parallel | Parallel |
| Pu27 | Parallel | Parallel |
Data from Refs. [104] and [105].
T1 = ATTGGG. T3.5 = GGG(ATTGGG)3. Pu22 = GAGGGTGGGGAGGGTGGGGAAG. Pu27 = TGGG[Pu22]G.
Pu22 and Pu27 are from the c-myc oncogene promoter region.
3. Peptides: ESI added to ims-ms
We began our work on peptides using the MALDI source shown in Fig. S2. Our first selection was bradykinin (BK), a nonapeptide with arginine residues in the 1 and 9 positions, that we felt was small enough we could model its folding and large enough to exhibit some complexity [108]. Our primary goal was to use BK to test theoretical models, especially solvent free parameterization of Amber. In the end (BK + H)+, (BK + Na)+ and (BK −H + 2Na)+ all gave only a single peak in the ATD and all the same cross section of 245 Å2, a number that subsequently was used in countless other studies as a cross section calibrant. Extensive MD was done yielding very different detailed structures for the three cases but globular folding of all three yielded the same cross section.
In the BK work the possibility of salt bridge formation was considered as (BK + H)+, for example, might actually have a structure with both arginines protonated and the C-terminal acid deprotonated. Unfortunately we could not conclusively say what the (BK + H)+ structure was. As a consequence we retreated to amino acids and wondered which might be salt bridges when cationized by alkali ions, and how the probability of salt bridge formation varied with side chain, proton affinity and which alkali ion did the cationizing [109]. Cross sections were measured and compared with theory for charge solvation and salt bridge formation. It turns out proton affinity, as might have been guessed, is the primary driving force for salt bridge formation with the (smaller sized) alkali ions next.
Finally we looked at oligoglycines from the monomer to the 5-mer, both protonated and sodiated [110]. While salt bridges might have been expected for larger sizes, in fact only charge solvation structures were observed.
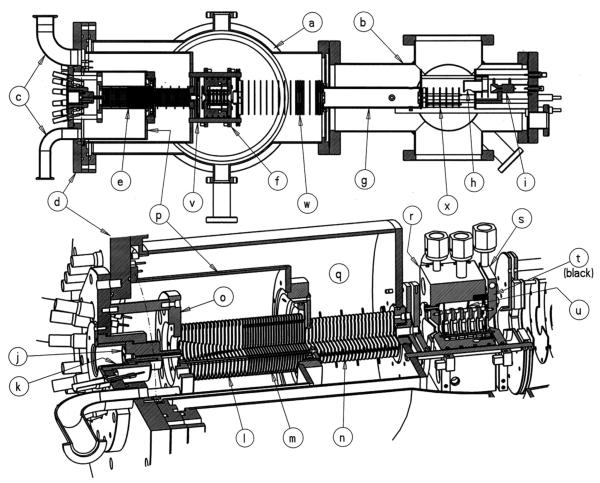
At this point it became clear that electrospray ionization (ESI) was becoming a required tool. Hence, we requested funds and NSF provided them for the instrument shown in Fig. 13 [93]. This instrument designed by Thomas Wyttenbach had several important, and at the time, unique features. Thomas designed a complex, multistage ion funnel to capture the ESI generated ions that passed through the capillaryand direct them to the cell entrance, store them there and then pulse them into the drift cell with an energy that could be varied over a wide range (~ 10–120 eV [lab-frame] for singly charged ions). In the instrument paper [93] we demonstrated this instrument could be used for accurate equilibrium studies and for determining the energetics of dimers dissociating to monomers. For the latter determination we used a unique aspect of ion mobility to show that dimers of the form M22+ have shorter arrival times than M1+ even though they have the same m/z. This occurs because even though M22+ has twice the mass and twice the charge of M1+ it does not have twice the size and hence will arrive at the detector before M1+. By like reasoning M33+ arrives before M22+ and so on for larger oligomers at the same m/z. By taking advantage of this fact, and the T-dependence of the cell, we were able to determine the binding energies for M22+ → 2M1+ for M = BK and angiotensin II (30 and 39 kcal/mol respectively).
Fig. 13.
(Top) Cross-sectional view of entire electrospray ion mobility mass spectrometer as viewed from the top. (Bottom) Perspective cross-sectional view of source, funnel, and cell. (a) and (b) vacuum chambers, (c) pump ports, (d) source flange, (e) ion funnel, (f) drift cell, (g) quadrupole mass analyzer, (h) conversion dynode, (i) detector, (j) capillary heating block, (k) insulator, (l) funnel first section, (m) funnel second section, (n) funnel third section, (o) funnel flange, (p) hat flange, (q) second pump stage, (r) cell body, (s) cell end cap, (t) ceramic ring, (u) guard rings, and (v), (w), (x) ion optics. Figure reproduced from ref. [93].
Once we had this instrument we applied it to many problems in synthetic polymers and especially nucleotides as previously discussed. However, the big breakthrough came when we realized we could apply it to rapidly aggregating amyloid systems. These are worthy of a special section, coming up next.
3.1. Amyloids
Amyloids are extracellular, proteinaceous deposits exhibiting β-sheet structure. They are associated with important diseases, such as Alzheimer's, Parkinson's, type 2 diabetes and many more. Those of you that have read this retrospective this far should be a bit surprised that my group became involved in this field, and in fact we are now deeply involved. Actually for many years I was surprised but the novelty has finally worn off. So how did we get involved in a program at the heart of biology when we were a chemical physics group that at the time had only peripheral experience with simple biologically interesting systems/molecules?
It all began in 2001 when I received an invitation to attend a workshop on mad cow disease (or BSE, the bovine form of transmissible spongiform encephalopathy, TSE) sponsored by the Food Standards Agency in the UK. The invitation was quite a surprise but they had been made aware of our group's development of IMS and were interested in new approaches to developing an antemortem test for the disease. Since I knew nothing about BSE it was extremely fortunate that an entire volume of Advances in Protein Chemistry [111] had just appeared dealing with prion proteins (prion is the name given to the protein(s) responsible for TSE disease). I read it cover to cover on the plane to the UK on the way to the workshop to begin to get some background in the area. One of the important things I learned is that the various TSE diseases were all amyloid diseases and by digging into what was known at the time I realized how widespread amyloid diseases were. While I am not going to give the details I was eventually funded by a different UK agency, DEFRA (Department of Environment, Food and Rural Affairs) to apply IMS methods to BSE. This work was done primarily in cooperation with Jim Scrivens and Teresa Pinheiro at Warwick University in the UK. We made some substantial progress over the three years of the grant [112–114] but I was not allowed to submit a renewal proposal because mad cow disease had ceased to be headline news in the UK and our scientific contact that had initially funded us at DEFRA had retired. Another proof that timing can be everything.
The good news was that I now had an interest in, and modest knowledge of, the amyloid process. Hence, in 2003 while leafing through a recent copy of C&E News, I came upon an article on Alzheimer's disease (AD) and I actually took time to read it. I found out the current paradigm for amyloid formation was aggregation of natively folded protein to form isotropic oligomers, a “phase transition” at some unknown oligomer size to form intermolecular β-sheet bound oligomers and then rapid monomer addition to form fibrils and finally plaques. I also found out that after many years of the research community believing that amyloid plaques caused AD, more recent studies were beginning to point to soluble oligomers formed during the initial stages of aggregation as the proximate toxic agents. This latter result really piqued my interest since we knew how to look at rapidly reacting systems one oligomer at a time from our experience with carbon clusters. Starting with the references given in the C&E News article, I began to educate myself about AD. Eventually I convinced myself we may be able to contribute and I decided to contact David Teplow, then at Harvard Medical School, since his work on AD had seemed the most mechanistically interesting. Dave responded and after looking at a couple of my papers we decided to spend an afternoon together when I traveled to Boston to attend an ACS meeting. At our meeting we hit it off both personally and scientifically and decided to collaborate. He assigned a current postdoc as our contact point (Dr. Gal Bitan) and I returned to UCSB and convinced one of my students, Summer Bernstein, to take on the project. Teplow's initial responsibility was to provide us with high purity samples of what is termed “amyloid β-protein,” which in reality is two peptides Aβ40 and Aβ42, forty and forty-two amino acids in length. Aβ40 and Aβ42 are clipped from the much larger amyloid precursor protein while it is partially imbedded in the neuron cell membrane. It was known that Aβ42 was much more toxic than Aβ40 but not why. It was also known that the two peptides aggregated (i.e., formed fibrils) by different mechanisms [115] but few structural or mechanistic details were known. Finally, essentially nothing was known about either structures or the distribution of the early soluble oligomers which were being implicated in the disease. Answering these questions were our primary initial targets.
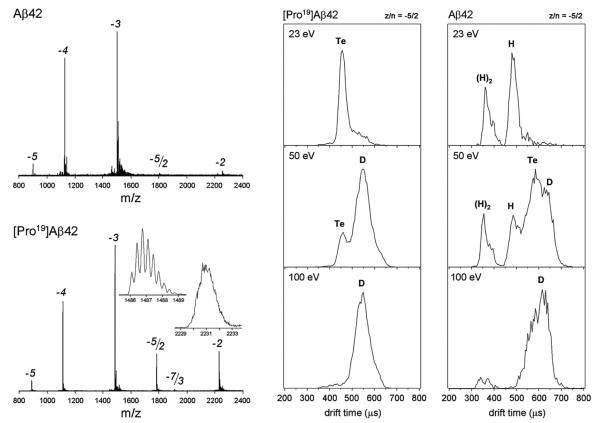
What we were not counting on was it taking us nearly two years to figure out how to handle Aβ42. It aggregated like a shot and clogged our nano-ESI spray tips. It was our first real biological system and we had no experience and no appropriate equipment. We finally learned how to filter our samples to remove any pre-aggregated seeds. We also figured out we had to look at the negatively charged oligomers as Aβ42 monomer was in a −3 charge state at physiological pH. At last we had success as shown in Fig. 14 [116]. In the figure we give the primary sequence of Aβ42 and show both the mass spectra and ATDs for wild type Aβ42 and its P19F mutant. The latter was included in our first study since it was known not to aggregate, a fact that made handling it simple. The ATDs in Fig. 14 are of the z/n = −5/2 peak (z = charge and n = oligomer number). ATDs at several injection energies are shown that allowed us to assign the peaks as shown in the figure. Since no new peaks appeared at highest injection energies the peak at longest arrival time was assigned as the dimer. Since only even numbered oligomers were possible at this charge state the remaining assignments could be made [116]. Of interest is the fact the P19F mutant only formed dimers (D) and tetramers (T) while the wt. Aβ42 also formed hexamers (H) and dodecamers ([H]2).
Fig. 14.
The left panel shows the mass spectra of wild-type Aβ42 and its Pro19 alloform taken from an unfiltered solution at 30 μM concentration near pH 8. The putative monomer charge states of −2, −3, −4, and −5 are indicated along with a −5/2 peak and, in the case of the Pro19alloform, a −7/3 peak. The −5/2 peak would correspond to a putative −5 dimer and the small −7/3 peak to a −7 trimer. The two insets are high-resolution spectra of the −3 and −2 charge states. The right panel shows arrival time distributions for the two peptides for the −5/2 charge states at the injection energies indicated. The letter designations given for the features are D = dimer, Te = tetramer, and H = hexamer. The figure was adapted from Ref. [116].
We subsequently measured z/n = −5/2 ATDs for wt. Aβ40, P19F Aβ40, oxidized Met35 of Aβ40 and Aβ42 and surprisingly all of these systems only exhibited dimers and tetramers under our experimental conditions [117]. By comparing experimental cross sections with those from a simple model [117] we were able to get qualitatively correct structures for the oligomers as shown in Fig. 15 and propose the mechanism shown in Fig. 16.
Fig. 15.
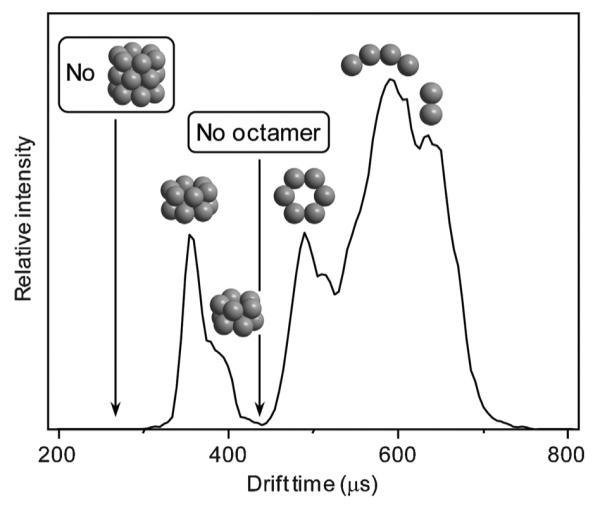
The ATD of z/n = 5/2 Aβ42 with structural designations as indicated. Figure adapted from Ref. [117].
Fig. 16.
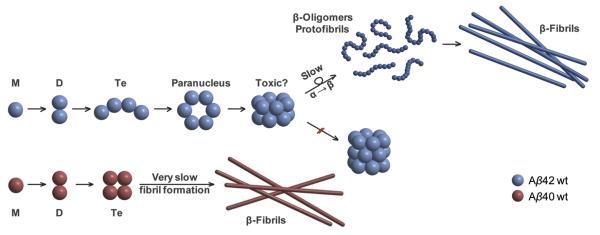
Mechanism of oligomerization and eventual fibril formation for Aβ42 and for Aβ40. For Aβ40 the key structure is the tetramer that resists further monomer or dimer addition. In Aβ42 an `open' tetramer promotes the formation of the planar hexamer (paranucleus) and the stacked dodecamer, which resists further reaction. For Aβ40 the tetramer eventually forms fibrils, but these were not observed in our experiments. For Aβ42 a rate-limiting slow α- to β-sheet transformation may occur for the dodecamer, but this was not explicitly observed in our experiments. Fibril formation was indirectly observed through macroscopic clogging of the spray tips used for Aβ42. Figure adapted from Ref. [117].
At this point we had answered the questions we had initially targeted. The additional two hydrophobic residues in Aβ42 change its folding relative to Aβ40 and subsequently its aggregation mechanism. Aβ40 forms a nearly square planar tetramer that will not accommodate (easily) further addition and hence oligomers terminate at the tetramer. Aβ42 on the other hand forms an open tetramer and goes on to form a planar ring hexamer and a dodecamer of two stacked hexamers. According to transgenic mice studies a species [118,119] at mass 56 kDa (i.e., the mass of dodecamer Aβ42) is responsible for memory loss in the mice. The qualitative structures shown in Figs. 15 and 16 are the first such structures obtained for any of the oligomers of Aβ40 or Aβ42.
Now that the aggregation sequence can be directly observed, therapeutic agents can be tested to see their effect on this sequence. Several systems have been tested by our group with positive results [120–122] but details will not be given here. One interesting observation [123] is that dimers of Aβ40 will form mixed tetramers with dimers of Aβ42 (i.e., only with two molecules of each isoform) and these mixed oligomers do not go on to form fibrils. Hence, Aβ40 is a natural “therapeutic agent” for the toxic Aβ42 peptide. We have also initiated work [124] on familial mutants of Aβ42 that cause disease related to AD and the NIH has recently (Sept. 2013) funded our group to expand this work. Keep your eye out for results in the future!!
3.2. Our latest advances
In this final section we will spotlight three different recent developments we feel moved the goalposts a bit in IMS. One is instrumental, one is theoretical and one is chemical. We will comment on them next.
3.2.1. High-resolution ims
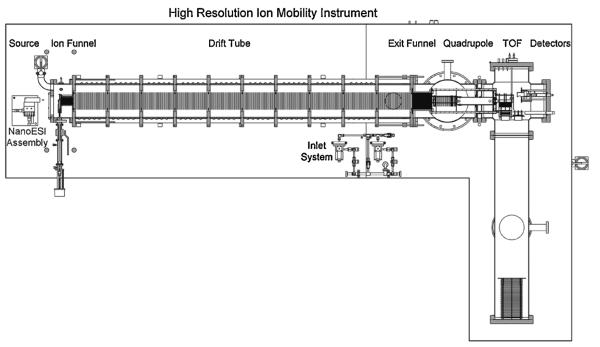
Our inspiration for developing a high-resolution instrument originally came from the work of Dugourd, Jarrold and coworkers [24], and our initial design was similar to theirs. However, from the time the request for funding was submitted to the time of actual funding by AFOSR we changed our minds. Their design operated at a drift-tube pressure of 500 Torr and hence required the ion source to be near this pressure to allow ions to enter the tube. While they cleverly solved this problem using an ion gate arrangement, their ions were formed by laser desorption of carbon and other similar materials. We were interested in using nano-electrospray and we simply did not think we could get it to work in a flexible way at that high pressure. Paul Kemper, who built most of the instruments in the group, decided to compromise on the tube pressure and reduce it to ~15 Torr and extend the tube length to two meters as shown schematically in Fig. 17. We did keep our source at a pressure essentially equal to the tube pressure, but slightly less to keep contaminants arriving via the ESI capillary from entering the tube. Innovations included an hourglass funnel in the source region for capturing the nano-ESI generated ions and transporting them to and trapping them at the drift tube entrance. A second important addition was an exit funnel at the end of the tube that took the radially dispersed ion pulses and gently focused them on a 0.5 mm exit orifice for eventual mass selection and detection. We were able to show that essentially 100% of the ions injected into the tube were delivered to the detector. Many more experimental details are given in the paper describing the instrument [125].
Fig. 17.
Overview of the instrument. The length of the drift tube is 2.00 m. The drawing is to scale. Reproduced from Ref. [125].
The resolution of the instrument is typically 100–115 for singly-charged ions. An example for ions generated by nESI of bradykinin is given in Fig. 18 where typical ATDs are shown from our low-resolution instrument (Fig. 13) in the top panel and the high-resolution instrument in the bottom panel. In all cases multiple features are resolved under high resolution that were either not apparent or only hinted at in the low-resolution spectrum.
Fig. 18.
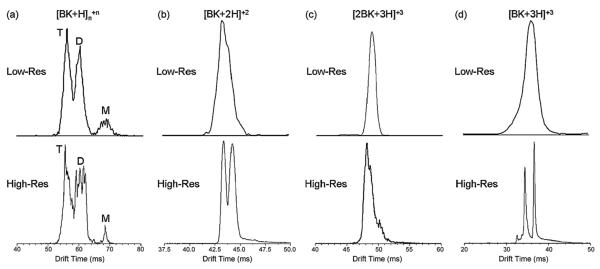
High-resolution IMS spectra of protonated bradykinin ions formed by ESI. Previous, lower resolution spectra are shown above. (a) z/n = +1, (b) z/n = +2, (c) z/n = +3/2, (d) z/n = +3, where z is the charge and n is the aggregate number (n = 1 is monomer, n = 2 is dimer, etc.). Reproduced from Ref. [125].
One feature we had not counted on (there is serendipity showing itself again!) was the extremely gentle nature of the instrument from source to detector. This aspect has opened the door for using this instrument in the study of mechanisms of aggregating systems even for weakly-bound oligomers. We will give an example of this unique and critical feature in the next section. A new high-resolution instrument is finishing construction in our group (Fig. S3). This instrument uses resistive glass in its two meter drift tube and is mated to a maXis Q-TOF provided by Bruker. Preliminary studies indicate a resolution of over 100 in the IMS section and over 60,000 in the Q-TOF. Completion and final vetting will occur summer 2014.
Finally, it should be pointed out David Clemmer's group is currently developing two IMS techniques that promise very high resolution (~1000 or more); the first has ions making multiple trips around a quasi-circular track to extend the ion path length [126] and the second uses clever pulsing sequences to generate “overtones” that increase the resolution [127]. While these methods sacrifice quantitative cross section determination, they provide access to separation technology that is truly impressive.
3.2.2. Peptide oligomerization mechanisms
It was September of 2005 and I was attending a conference on prion biology at the Wellcome Trust Conference Center in Hinxton, UK, just south of Cambridge. It was an excellent chance for me to meet major players in the field as well as learn some much needed “biology” and how prions affected it. After about two days I could understand most of what the speakers were talking about and by day five I was a card-carrying prion biologist, at least in my own mind. But the most important talk at the meeting for me was given by Chris Dobson from Cambridge. Chris talked about the general amyloid assembly problem and what he and others were doing to try to understand it [128–130]. As I mentioned in the Section 3.1 the universally accepted paradigm was that proteins first assemble into globular isotropic oligomers and at some unknown later point they convert to β-sheet driven structures followed rapidly by monomer addition to form fibrils. The problem was that while there was information on monomer structures and the β-sheet structures of the fibrils, no one had any information on the intermediate species. I chatted with Chris after his talk and suggested maybe we could work together to find a system where we could follow it step by step. While the collaboration never came to pass, our group has finally cracked this nut. The key was to back off from the actual disease-causing proteins because in every case they were simply too large to carefully study in this way. The best we have been able to do on real disease systems is our work on Aβ42 described above, where we could follow things to the dodecamer but saw no direct evidence of intermediate β-sheet structures.
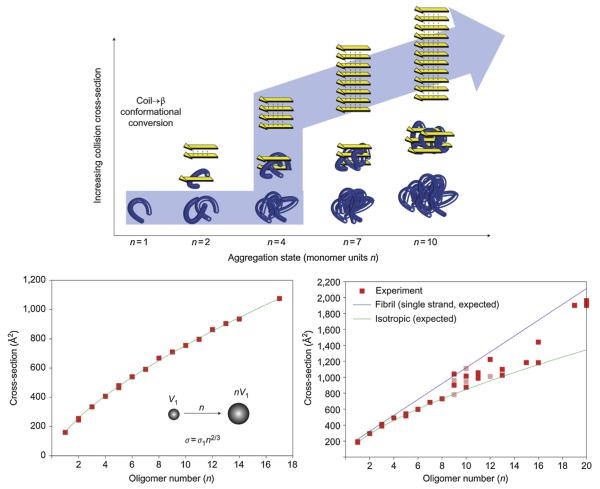
Eisenberg's group at UCLA had published some beautiful X-ray structures of β-sheet fibrils/crystals of six residue fragments from amyloid-forming proteins [131]. Hence we knew that under the right circumstances we should be able to find systems that transitioned from isotropic to β-sheet in an oligomer size range we could access. The process is shown schematically in Fig. 19 (top panel) and data given for two peptide systems YGGFL and NNQQNY in the bottom panels [132]. YGGFL is an important opioid in humans and is known to form three-dimensional isotropic crystals [133] while NNQQNY is a fragment from the yeast prion Sup35 that Eisenberg had shown [131] forms a β-sheet fibril. The data clearly show that YGGFL follows the isotropic assembly curve through n = 18 while NNQQNY starts on this curve but between n = 9 and n = 16 transitions to the β-sheet assembly line. NNQQNY was the first system to clearly show this isotropic → β-sheet transition and since then we have found other peptides that also do so [134,135]. At present we are systematically mutating NNQQNY [136] and other systems to find factors that drive β-sheet assembly in peptides.
Fig. 19.
The top panel shows self-assembly starting at the folded monomer (left) and proceeding to soluble peptide assemblies of increasing mass (right). Soluble peptide oligomers with identical mass (that is, number of monomer units n) can assume different conformations, such as globular (bottom row) or β-strand conformations (top row) with different collision cross-sections. Successively mass-extracting a specific aggregation state from the solution-phase distribution and subsequent determination of its collision cross-section revealed the self-assembly pathway that occurred in solution (see arrow). The bottom panels show plots of measured collision cross sections as a function of the oligomer number n. YGGFL self-assembled isotropically with cross-sections that increased as n 2/3 (line) V = volume. NNQQNY followed an isotropic assembly up to the octamer. Fibril-like β-sheet conformations emerged at the nonamer and became prevalent at the nonadecamer. Figure adapted from Ref. [132].
3.2.3. Model structures to cross sections: the PSA algorithm
It became apparent in our first studies on carbon clusters that we needed a way to accurately calculate cross sections from model structures so we could interpret the complex ATDs that we measured. I have always believed that the simplest model that will do the job is the best way to proceed. A good example is the one used to generate “structures” for Aβ oligomers given in Figs. 15 and 16. In that case we used a sphere to represent the monomer and adjusted the radius to give the measured cross section. The experimental dimer cross section was smaller than two adjacent monomer spheres so we let them overlap until they fit the dimer cross section. We then built tetramers, hexamers and larger species using these dimers with no additional accommodation. Hence we got model cross sections that approximated higher-order species but were a bit too large. Nonetheless this allowed us to both generate approximate structures for oligomers and to obtain insight into the mechanism of assembly Aβ.
For carbon clusters we could do a better job of getting detailed atomistic models as starting points using ab initio semi-empirical calculations [27]. We then used Monte Carlo methods to sample random orientations of the molecule projected into boxes on a two-dimensional surface and stopped when the cross section converged to 1%. The model was improved when we realized the interaction potential of the carbon cluster with the helium gas needed to be considered [28]. In order to keep the model simple we used this potential to “expand” the hard sphere atomic radii to obtain modified 300 K “sizes” for carbon and hydrogen atoms and then assumed nitrogen and oxygen were identical to carbon. At about the same time Jarrold and coworkers [29] developed a trajectory method that allows for multiple collisions with the helium bath gas due to concave portions of a molecular surface. This improvement became necessary because IMS was expanding its size range to include proteins and other large macromolecules. While the interaction potential in this TJM model was approximate it provided the best way to estimate cross sections for larger molecules. Unfortunately the TJM method becomes very time consuming for even small proteins and prohibitive for larger systems. Christian Bleiholder in my group became aware of this problem and decided to develop an algorithm with the goal of retaining at least some of the speed of the projection approximation (PA) we had previously developed and maintaining all of the accuracy of the TJM. He termed this model the projection superposition approximation (PSA).
The basic measurement in IMS is a momentum transfer cross section caused by the scattering of the ion of interest by the buffer gas. In order to theoretically model this you need to calculate “collision integrals” for the scattering process and hence need both the shape of the ion and the interaction potential. The TJM does the best job of approximating this process. In the PSA method the momentum transfer cross section, , is obtained as follows.
and it is postulated
Hence the PSA assumes that the momentum transfer cross section can be accurately obtained from a product of a “size” factor and a “shape” factor. The size factor is a function of temperature (things look “bigger” at low temperature due to the interaction potential) and the superposition of a large number of projections that use a collision probability that is a function of the collision radius [31]. The size factor is a significant effect at 300 K (relative to a hard sphere model) of 8% for 1000 amu ions to 2% for 100,000 amu ions for a helium buffer gas and 4–5 times this effect for nitrogen buffer gas [35].
The shape effect is both larger and more sporadic. As expected, for small systems of 1000 amu or less, it varies by only 1 or 2% but for proteins between 10,000 and 250,000 amu the effect varies sporadically (because of shape differences) from 10% to 50% [35]. Ironically, using nitrogen as a buffer gas actually moderates this affect by a few percent because its relatively large size compared to helium blurs some of the surface roughness.How do the PA, PSA and TJM compare in both speed and accuracy? These data are given in Table 4 for several systems over a large mass range. For small systems with fewer than 200 atoms the PA method is both the fastest and most accurate. However, its accuracy falls off to unacceptable levels for larger systems and will have a very large spread in uncertainty due to the wide variation in molecular shapes. The PSA model takes roughly 100 times as long as the PA model but maintains an acceptable uncertainty that does not exceed 5% for all sizes of molecules. The cross sections for even the largest molecules can be calculated in 11 h, which is certainly acceptable. Finally, the TJM is over 200 times slower than the PSA model over the size range used here leading to unacceptably long times to compute the cross section for a single structure. In addition, an uncertainty could not be obtained for the TJM because it was not possible to converge it for the larger molecules and hence the real time for calculating an accurate cross section may be several times longer than shown the table.
Table 4.
Comparison of computation time and accuracy for three cross section calculation methods.
The PA program developed by our group (termed SIGMA) is available on request. Information on how the program works can be found on the group web site (http://bowers.chem.ucsb.edu/theory_analysis/cross-sections/sigma.shtml).
The PSA program is very complex and cannot be transported to other users. In order to make the program universally available we have set up a dedicated server at UCSB along with a required tutorial program each registered user must successfully complete. At this writing (March 2014) we are testing this protocol with a limited number of external users and anticipate opening it free of charge to the general public by summer 2014. At that time access information will be put on the group web site. Our group has successfully used the PSA for many different applications [31–35] with the initial focus on peptides and proteins. One very important recent addition is the ability to calculate cross sections for both He and N2 bath gases, thus removing the requirement of “calibration” of N2 measurements to get usable cross sections. The parameterization for the N2 version of PSA is still being evaluated but the current version is believed to be reliable.
4. Summary
This retrospective traces the development of the IMS technique in the Bowers group at UCSB. We had not intended to get involved with IMS but serendipity presented a tempting invitation and we accepted. Instrumental evolution was important and to some extent was dependent on important discoveries made elsewhere. The most important of these were the MALDI and ESI ion sources and the ion funnel for ion transport. One of our major contributions was to couple serious theoretical modeling with our IMS measurements, something we did from the very beginning. This took two forms: (1) how to get accurate cross sections from model structures and (2) how to generate accurate model structures. It is not widely appreciated but in the beginning MD programs like Amber were designed for solution calculations and hence all proteins had charged termini and charged basic and acidic residues. Our group had to figure out how to parameterize these groups for the neutral state found in our solvent-free environment and we ended up sharing this information with those generating the Amber suite of programs. The same held true for the phosphate groups on DNA/RNA backbones.
IMS is a living technique both at UCSB and elsewhere. This paper is a snapshot of the past 25 years of what has been going on here. I am very bullish on the future of IMS, especially given the exceptional quality of my colleagues that are heavily invested in it. Biologists have been a bit slow to appreciate what can be done with IMS but even their appreciation is growing that IMS is a unique tool that can probe biologically important systems that cannot be probed any other way. The future is bright. I intend to be part of it as long as God allows me to be!
Supplementary Material
Acknowledgements
The work at UCSB has been funded for the long term by the National Science Foundation (USA) and the US Air Force Office of Scientific Research and more recently by the National Institute on Aging of the National Institutes of Health. Current grants are CHE-1301032 (NSF), FA9550-11-1-0113 and FA2386-12-1-3011 (AFOSR), and AG047116-01 (NIH). We also would like to acknowledge Waters Corp. for the generous donation of their T-wave prototype instrument and Bruker Daltonics for collaboration in constructing a new high-resolution IMS/high-resolution MS instrument. Of course the primary acknowledgement goes to all of the people in my group that did all of the work described here, and much more that is not described here. Nothing would have happened without them.
Footnotes
Appendix A. Supplementary data Supplementary data associated with this article can be found, in the online version, at http://dx.doi.org/10.1016/j.ijms.2014.06.016.
References
- [1].Franklin B. A letter of Benjamin Franklin, Esq; to Mr. Peter Collinson, F. R. S. concerning an electrical kite. Phil. Trans. 1751;47:565–567. [Google Scholar]
- [2].Coulomb CA. Mém. de l'Acad. Vol. 616. Paris: 1795. [Google Scholar]
- [3].Thomson JJ, Rutherford E. On the passage of electricity through gases exposed to Röntgen rays. Philos. Mag. 1896;42:392–407. [Google Scholar]
- [4].Rutherford E. The velocity and rate of recombination of the ions of gases exposed to Röntgen radiation. Philos. Mag. 1897;44:422–440. [Google Scholar]
- [5].Langevin P. Sur la mobilité des ions les gaz. Comptes Rendus. 1902;134:646–649. [Google Scholar]
- [6].Langevin P. Recombination et mobilités des ions dans les gaz. Ann. Chim. Phys. 1903;28:433–530. [Google Scholar]
- [7].Langevin P. Une formule fondamentale de théorie cinétique. Ann. Chim. Phys. 1905;5:245–288. [Google Scholar]
- [8].McDaniel EW. Collision Phenomena in Ionized Gases. Wiley; New York: 1964. [Google Scholar]
- [9].Mason EA, McDaniel EW. Transport Properties of Ions in Gases. Wiley; New York: 1988. [Google Scholar]
- [10].Ferguson EE, Fehsenfeld FC, Schmeltekopf AL. Flowing afterglow measurements of ion–neutral reactions. Adv. Atomic Mol. Phys. 1969;5:1–56. [Google Scholar]
- [11].McFarland M, Albritton DL, Fehsenfeld FC, Ferguson EE, Schmeltekopf AL. Flow drift technique for ion mobility and ion-molecule reaction-rate constant measurement. 1. Apparatus and mobility measurements. J. Chem. Phys. 1973;59:6610–6619. [Google Scholar]
- [12].van Koppen PAM, Kemper PR, Illies AJ, Bowers MT. An improved high-pressure, temperature-variable ion source with coaxial electron beam/ion exit slit. Int. J. Mass Spectrom. Ion Processes. 1983;54:263–282. [Google Scholar]
- [13].Kemper PR, Bowers MT. A hybrid double-focusing mass spectrometer-high-pressure drift reaction cell to study thermal energy reactions of mass-selected ions. J. Am. Soc. Mass Spectrom. 1990;1:197–207. [Google Scholar]
- [14].Kemper PR, Bowers MT. State-selected mobilities of atomic cobalt ions. J. Am. Chem. Soc. 1990;112:3231–3232. [Google Scholar]
- [15].Adams NG, Smith D. The selected ion flow tube (SIFT); a technique for studying ion–neutral reactions. Int. J. Mass Spectrom. Ion Phys. 1976;21:349–359. [Google Scholar]
- [16].van Koppen PAM, Kemper PR, Bowers MT. Reactions of State-Selected Co+ with C3H8. J. Am. Chem. Soc. 1992;114:1083–1084. [Google Scholar]
- [17].van Koppen PAM, Kemper PR, Bowers MT. Electronic state-selected reactivity of transition metal ions: Co+ and Fe+ with propane. J. Am. Chem. Soc. 1992;114:10941–10950. [Google Scholar]
- [18].Hanratty MA, Beauchamp JL, Illies AJ, van Koppen P, Bowers MT. Kinetic energy release distributions as a probe of transition-metal-mediated HH, CH, and CC bond formation processes: reactions of cobalt and nickel ions with alkanes. J. Am. Chem. Soc. 1988;110:1–14. [Google Scholar]
- [19].van Koppen PAM, Jacobson DB, Illies A, Bowers MT, Hanratty M, Beauchamp JL. Product kinetic energy release distributions as a probe of the energetics and mechanisms of organometallic reactions involving the formation of metallacyclobutanes in the gas phase. J. Am. Chem. Soc. 1989;111:1991–2001. [Google Scholar]
- [20].Dearden DV, Hayashibara K, Beauchamp JL, Kirchner NJ, van Koppen PAM, Bowers MT. Fundamental studies of the energetics and dynamics of ligand dissociation and exchange processes at transition-metal centers in the gas phase: Mn(CO)χ+, χ = 1−6. J. Am. Chem. Soc. 1989;111:2401–2409. [Google Scholar]
- [21].Dearden DV, Beauchamp JL, van Koppen PAM, Bowers MT. Kinetic energy release distributions as a probe of ligation effects on potential energy surfaces in organometallic reactions. reversible dehydrogenation of cycloalkenes by Fe+ J. Am. Chem. Soc. 1990;112:9372–9378. [Google Scholar]
- [22].van Koppen PAM, Brodbelt-Lustig J, Bowers MT, Dearden DV, Beauchamp JL, Fisher ER, Armentrout PB. Transition metal ion mediated CH and CC bond activation of alkanes: dynamical coupling between entrance and exit channel transition states. J. Am. Chem. Soc. 1991;113:2359–2369. [Google Scholar]
- [23].Hill HH, Eatherton RL. Ion mobility spectrometry after chromatography – accomplishments, goals, challenges. J. Res. Nat. Bur. Stand. 1988;93:425–426. [Google Scholar]
- [24].Dugourd P, Hudgins RR, Clemmer DE, Jarrold MF. High-resolution ion mobility measurements. Rev. Sci. Instrum. 1997;68:1122–1129. [Google Scholar]
- [25].Shaffer SA, Prior DC, Anderson GA, Udseth HR, Smith RD. An ion funnel interface for improved ion focusing and sensitivity using electrospray ionization mass spectrometry. Anal. Chem. 1998;70:4111–4119. doi: 10.1021/ac9802170. [DOI] [PubMed] [Google Scholar]
- [26].Pringle SD, Giles K, Wildgoose JL, Williams JP, Slade SE, Thalassinos K, Bateman RH, Bowers MT, Scrivens JH. An investigation of the mobility separation of some peptide and protein ions using a new hybrid quadrupole/travelling wave IMS/oa-ToF instrument. Int. J. Mass Spectrom. 2007;261:1–12. [Google Scholar]
- [27].von Helden G, Hsu M-T, Gotts N, Bowers MT. Carbon cluster cations with up to 84 atoms: structures, formation mechanism, and reactivity. J. Phys. Chem. 1993;97:8182–8192. [Google Scholar]
- [28].Wyttenbach T, von Helden G, Batka JJ, Carlat D, Bowers MT. Effect of the long-range potential on ion mobility measurements. J. Am. Soc. Mass Spectrom. 1997;8:275–282. [Google Scholar]
- [29].Mesleh MF, Hunter JM, Shvartsburg AA, Schatz GC, Jarrold MF. Structural information from ion mobility measurements: effects of the long-range potential. J. Phys. Chem. 1996;100:16082–16086. [Google Scholar]
- [30].Shvartsburg AA, Jarrold MF. An exact hard-spheres scattering model for the mobilities of polyatomic ions. Chem. Phys. Lett. 1996;261:86–91. [Google Scholar]
- [31].Bleiholder C, Wyttenbach T, Bowers MT. A novel projection approximation algorithm for the fast and accurate computation of molecular collision cross sections (I) Method, Int. J. Mass Spectrom. 2011;308:1–10. [Google Scholar]
- [32].Bleiholder C, Contreras S, Do TD, Bowers MT. A novel projection approximation algorithm for the fast and accurate computation of molecular collision cross sections (II). Model parameterization and definition of empirical shape factors for proteins. Int. J. Mass Spectrom. 2013;345:89–96. [Google Scholar]
- [33].Anderson SE, Bleiholder C, Brocker ER, Stang PJ, Bowers MT. A novel projection approximation algorithm for the fast and accurate computation of molecular collision cross sections (III). Application to supramolecular coordination-driven assemblies with complex shapes. Int. J. Mass Spectrom. 2012;330:78–84. [Google Scholar]
- [34].Bleiholder C, Contreras S, Bowers MT. A novel projection approximation algorithm for the fast and accurate computation of molecular collision cross sections (IV). Application to polypeptides. Int. J. Mass Spectrom. 2013;354:275–280. [Google Scholar]
- [35].Wyttenbach T, Bleiholder C, Bowers MT. Factors contributing to the collision cross section of polyatomic ions in the kilodalton to gigadalton range: application to ion mobility measurements. Anal. Chem. 2013;85:2191–2199. doi: 10.1021/ac3029008. [DOI] [PubMed] [Google Scholar]
- [36].Kemper PR, Bowers MT. Electronic-state chromatography: application to first-row transition-metal ions. J. Phys. Chem. 1991;95:5134–5146. [Google Scholar]
- [37].Bowers MT, Marshall AG, McLafferty FW. Mass spectrometry: recent advances and future directions. J. Phys. Chem. 1996;100:12897–12910. [Google Scholar]
- [38].Kemper PR, Hsu M-T, Bowers MT. Transition-metal ion – rare gas clusters: bond strengths and molecular parameters for Co+(He/Ne)n, Ni+(He/Ne)n, and Cr+(He/Ne/Ar) J. Phys. Chem. 1991;95:10600–10609. [Google Scholar]
- [39].Kemper PR, Bushnell J, van Koppen P, Bowers MT. Binding energies of Co+(H2/CH4/C2H6)1,2,3 clusters. Journal of Physical Chemistry. 1993;97:1810–1817. [Google Scholar]
- [40].Jarrold MF, Illies AJ, Bowers MT. Energy disposal in photodissociation from magic angle measurements with a crossed high-energy ion beam and laser beam: photodissociation dynamics of the (N2)2+ cluster in the 458–514 nm range. J. Chem. Phys. 1984;81:214–221. [Google Scholar]
- [41].Jarrold MF, Misev L, Bowers MT. Charge transfer half-collisions: photodissociation of the Kr O2+ cluster ion with resolution of the O2 product vibrational states. J. Chem. Phys. 1984;81:4369–4379. [Google Scholar]
- [42].Radi PP, von Helden G, Hsu M-T, Kemper PR, Bowers MT. Observation of small doubly charged niobium clusters. Chem. Phys. Lett. 1991;179:531–538. [Google Scholar]
- [43].Radi PP, von Helden G, Hsu M-T, Kemper PR, Bowers MT. Thermal bimolecular reactions of size selected transition metal cluster ions: Nbn+ + O2, n = 1−6. Int. J. Mass Spectrom. Ion Processes. 1991;109:49–73. [Google Scholar]
- [44].Radi PP, Hsu M-T, Brodbelt-Lustig J, Rincon M, Bowers MT. Evaporation of covalent clusters: unimolecular decay of energized size-selected carbon cluster ions (Cn+, 5≤n≤100) J. Chem. Phys. 1990;92:4817–4822. [Google Scholar]
- [45].Radi PP, Hsu M-T, Rincon ME, Kemper PR, Bowers MT. On the structure, reactivity and relative stability of the large carbon cluster ions C62+, C60+ and C58+ Chem. Phys. Lett. 1990;174:223–229. [Google Scholar]
- [46].Kratschmer W, Fostiropoulos K, Huffman DR. The infrared and ultraviolet absorption spectra of laboratory-produced carbon dust: evidence for the presence of the C60 molecule. Chem. Phys. Lett. 1990;170:167–170. [Google Scholar]
- [47].Meijer G, Bethune DS. Mass spectroscopic confirmation of the presence of C60 in laboratory-produced carbon dust. Chem. Phys. Lett. 1990;175:1–2. [Google Scholar]
- [48].Kroto HW, Heath JR, Obrien SC, Curl RF, Smalley RE. C60: buckminster-fullerene. Nature. 1985;318:162–163. [Google Scholar]
- [49].von Helden G, Gotts NG, Bowers MT. C7+ is cyclic: experimental evidence. Chem. Phys. Lett. 1993;212:241–246. [Google Scholar]
- [50].von Helden G, Hsu M-T, Kemper PR, Bowers MT. Structures of carbon cluster ions from 3 to 60 atoms: linears to rings to fullerenes. J. Chem. Phys. 1991;95:3835–3837. [Google Scholar]
- [51].von Helden G, Gotts NG, Bowers MT. Experimental evidence for the formation of fullerenes by collisional heating of carbon rings in the gas phase. Nature. 1993;363:60–63. [Google Scholar]
- [52].Gotts NG, von Helden G, Bowers MT. Carbon cluster anions: structure and growth from C5− to C62–. Int. J. Mass Spectrom. Ion Processes. 1995;149:217–229. [Google Scholar]
- [53].Lee S, Gotts N, von Helden G, Bowers MT. Structures of Cn Hx+ molecules for n ≤ 22 and x ≤ 5: emergence of PAHs and effects of dangling bonds on conformation. J. Phys. Chem. A. 1997;101:2096–2102. [Google Scholar]
- [54].Guo BC, Kerns KP, Castleman AW. Ti8C12+ -metallo-carbohedrenes: a new class of molecular clusters. Science. 1992;255:1411–1413. doi: 10.1126/science.255.5050.1411. [DOI] [PubMed] [Google Scholar]
- [55].Wei S, Guo BC, Purnell J, Buzza S, Castleman AW. Metallocarbohedrenes as a class of stable neutral clusters: formation mechanism of M8C12 (M = Ti and V) J. Phys. Chem. 1992;96:4166–4168. [Google Scholar]
- [56].Guo BC, Wei S, Purnell J, Buzza S, Castleman AW. Metallo-carbohedrenes [M8C12+ (M = V, Zr, Hf, and Ti)]: a class of stable molecular cluster ions. Science. 1992;256:515–516. doi: 10.1126/science.256.5056.515. [DOI] [PubMed] [Google Scholar]
- [57].Dance I. Geometric and electronic-structures of [Ti8C12]: analogies with C60. Chem. Commun. 1992:1779–1780. [Google Scholar]
- [58].Rohmer MM, Benard M, Henriet C, Bo C, Poblet JM. Ti8C12: a polytopal molecule with 36 TiC bonds. Chem. Commun. 1993:1182–1185. [Google Scholar]
- [59].Lin ZY, Hall MB. Theoretical studies on the stability of M8C12 clusters. J. Am. Chem. Soc. 1993;115:11165–11168. [Google Scholar]
- [60].Pauling L. Molecular structure of Ti8C12 and related complexes. Proc. Nat. Acad. Sci. 1992;89:8175–8176. doi: 10.1073/pnas.89.17.8175. [DOI] [PMC free article] [PubMed] [Google Scholar]
- [61].Khan A. Theoretical studies of the structure of Ti8C12+ cluster: existence of C12 cage structure surrounded by metal atoms. J. Phys. Chem. 1993;97:10937–10941. [Google Scholar]
- [62].Lee S, Gotts NG, von Helden G, Bowers MT. Evidence from ion chromatography experiments that met-cars are hollow cage clusters. Science. 1995;267:999–1001. doi: 10.1126/science.267.5200.999. [DOI] [PubMed] [Google Scholar]
- [63].Bowers MT. Cluster ions: carbon, met-cars, and σ-bond activation. Acc. Chem. Rev. 1994;27:324–332. [Google Scholar]
- [64].von Helden G, Wyttenbach T, Bowers MT. Inclusion of a MALDI ion source in the ion chromatography technique: conformational information on polymer and biomolecular ions. Int. J. Mass Spectrom. Ion Processes. 1995;146:349–364. [Google Scholar]
- [65].von Helden G, Wyttenbach T, Bowers MT. Conformation of macromolecules in the gas phase: use of matrix-assisted laser desorption methods in ion chromatography. Science. 1995;267:1483–1485. doi: 10.1126/science.267.5203.1483. [DOI] [PubMed] [Google Scholar]
- [66].Gidden J, Wyttenbach T, Jackson AT, Scrivens JH, Bowers MT. Gas-phase conformations of synthetic polymers: poly(ethylene glycol), poly(propylene glycol), and poly(tetramethylene glycol) J. Am. Chem. Soc. 2000;122:4692–4699. [Google Scholar]
- [67].Lee S, Wyttenbach T, von Helden G, Bowers MT. Gas phase conformations of Li+, Na+, K+, and Cs+ complexed with 18-crown-6. J. Am. Chem. Soc. 1995;117:10159–10160. [Google Scholar]
- [68].Wyttenbach T, von Helden G, Bowers MT. Conformations of alkali ion cationized polyethers in the gas phase: polyethylene glycol and bis[(benzo-15-crown-5)-15-ylmethyl] pimelate. Int. J. Mass Spectrom. Ion Processes. 1997;165:377–390. [Google Scholar]
- [69].Allinger NL, Zhou XF, Bergsma J. Molecular mechanics parameters. J. Mol. Struct. Theochem. 1994;18:69–83. [Google Scholar]
- [70].Pearlman DA, Case DA, Caldwell JW, Seibel GL, Singh UC, Weiner P, Kollman PA. Amber 4. University of California; San Francisco: 1991. [Google Scholar]
- [71].Grootenhuis PDJ, Kollman PA. Molecular mechanics and dynamics studies of crown ether cation interactions: free-energy calculations on the cation selectivity of dibenzo-18-crown-6 and dibenzo-30-crown-10. J. Am. Chem. Soc. 1989;111:2152–2158. [Google Scholar]
- [72].Gidden J, Wyttenbach T, Batka JJ, Weis P, Jackson AT, Scrivens JH, Bowers MT. Folding energetics and dynamics of macromolecules in the gas phase: alkali ion-cationized poly(ethylene terephthalate) oligomers. J. Am. Chem. Soc. 1999;121:1421–1422. [Google Scholar]
- [73].Gidden J, Wyttenbach T, Batka JJ, Weis P, Jackson AT, Scrivens JH, Bowers MT. Poly(ethylene terephthalate) oligomers cationized by alkali ions: structures, energetics, and their effect on mass spectra and the matrix-assisted laser desorption/ionization process. J. Am. Soc. Mass Spectrom. 1999;10:883–895. [Google Scholar]
- [74].Gidden J, Jackson AT, Scrivens JH, Bowers MT. Gas phase conformations of synthetic polymers: poly(methyl methacrylate) oligomers cationized by sodium ions. Int. J. Mass Spectrom. 1999;188:121–130. [Google Scholar]
- [75].Gidden J, Bowers MT, Jackson AT, Scrivens JH. Gas-phase conformations of cationized poly(styrene) oligomers. J. Am. Soc. Mass Spectrom. 2002;13:499–505. doi: 10.1016/S1044-0305(02)00367-7. [DOI] [PubMed] [Google Scholar]
- [76].Gidden J, Kemper PR, Shammel E, Fee DP, Anderson S, Bowers MT. Application of ion mobility to the gas-phase conformational analysis of polyhedral oligomeric silsesquioxanes (POSS) Int. J. Mass Spectrom. 2003;222:63–73. [Google Scholar]
- [77].Baker ES, Gidden J, Fee DP, Kemper PR, Anderson SE. MT, Bowers, 3-dimensional structural characterization of cationized polyhedral oligomeric silsesquioxanes (POSS) with styryl and phenylethyl capping agents. Int. J. Mass Spectrom. 2003;227:205–216. [Google Scholar]
- [78].Baker ES, Gidden J, Anderson SE, Haddad TS, Bowers MT. Isomeric structural characterization of polyhedral oligomeric silsesquioxanes (POSS) with styryl and epoxy phenyl capping agents. Nano Lett. 2004;4:779–785. [Google Scholar]
- [79].Anderson SE, Baker ES, Mitchell C, Haddad TS, Bowers MT. Structure of hybrid polyhedral oligomeric silsesquioxane propyl methacrylate oligomers using ion mobility mass spectrometry and molecular mechanics. Chem. Mater. 2005;17:2537–2545. [Google Scholar]
- [80].Gross J, Hillenkamp F, Wan KX, Gross ML. Metastable decay of negatively charged oligodeoxynucleotides analyzed with ultraviolet matrix-assisted laser desorption/ionization post-source decay and deuterium exchange. J. Am. Soc. Mass Spectrom. 2001;12:180–192. doi: 10.1016/S1044-0305(00)00209-9. [DOI] [PubMed] [Google Scholar]
- [81].Wan KX, Gross J, Hillenkamp F, Gross ML. Fragmentation mechanisms of oligodeoxynucleotides studied by H/D exchange and electrospray ionization tandem mass spectrometry. J. Am. Soc. Mass Spectrom. 2001;12:193–205. doi: 10.1016/S1044-0305(00)00208-7. [DOI] [PubMed] [Google Scholar]
- [82].Gidden J, Bushnell JE, Bowers MT. Gas-phase conformations and folding energetics of oligonucleotides: dTG− and dGT−. J. Am. Chem. Soc. 2001;123:5610–5611. doi: 10.1021/ja015940d. [DOI] [PubMed] [Google Scholar]
- [83].Gidden J, Bowers MT. Gas-phase conformational and energetic properties of deprotonated dinucleotides. Eur. Phys. J. D. 2002;20:409–419. [Google Scholar]
- [84].Gatland IR. Analysis for ion drift tube experiments. In: McDaniel EW, McDaniel EW, McDowell MRC, McDowell MRC, editors. Case Studies in Atomic Physics. Elsevier; 1975. pp. 369–437. [Google Scholar]
- [85].Gidden J, Bowers MT. Gas-phase conformations of deprotonated trinucleo-tides (dGTT−, dTGT−, and dTTG−): the question of zwitterion formation. J. Am. Soc. Mass Spectrom. 2003;14:161–170. doi: 10.1016/S1044-0305(02)00866-8. [DOI] [PubMed] [Google Scholar]
- [86].Watson JD, Crick FHC. Molecular structure of nucleic acids: a structure for deoxyribose nucleic acid. Nature. 1953;171:737–738. doi: 10.1038/171737a0. [DOI] [PubMed] [Google Scholar]
- [87].Langridge R, Wilson HR, Hooper CW, Wilkins MHF, Hamilton LD. Molecular configuration of deoxyribonucleic acid. 1. X-ray diffraction study of a crystalline form of the lithium salt. J. Mol. Biol. 1960;2:19–37. [Google Scholar]
- [88].Fuller W, Wilkins MHF, Wilson HR, Hamilton LD. Molecular configuration of deoxyribonucleic acid. 4. X-ray diffraction study of A form. J. Mol. Biol. 1965;12:60–76. doi: 10.1016/s0022-2836(65)80282-0. [DOI] [PubMed] [Google Scholar]
- [89].Wang AHJ, Quigley GJ, Kolpak FJ, Crawford JL, Vanboom JH, Vandermarel G, Rich A. Molecular structure of a left-handed double helical DNA fragment at atomic resolution. Nature. 1979;282:680–686. doi: 10.1038/282680a0. [DOI] [PubMed] [Google Scholar]
- [90].Light-Wahl KJ, Springer DL, Winger BE, Edmonds CG, Camp DG, Thrall BD, Smith RD. Observation of a small oligonucleotide duplex by electrospray ionization mass spectrometry. J. American Chem. Soc. 1993;115:803–804. [Google Scholar]
- [91].Ganem B, Li YT, Henion JD. Detection of oligonucleotide duplex forms by ion-spray mass spectrometry. Tetrahedron Lett. 1993;34:1445–1448. [Google Scholar]
- [92].Gidden J, Ferzoco A, Baker ES, Bowers MT. Duplex formation and the onset of helicity in poly d(CG)n oligonucleotides in a solvent-free environment. J. Am. Chem. Soc. 2004;126:15132–15140. doi: 10.1021/ja046433+. [DOI] [PubMed] [Google Scholar]
- [93].Wyttenbach T, Kemper PR, Bowers MT. Design of a new electrospray ion mobility mass spectrometer. Int. J. Mass Spectrom. 2001;212:13–23. [Google Scholar]
- [94].Baker ES, Bowers MT. B-DNA helix stability in a solvent-free environment. J. Am. Soc. Mass Spectrom. 2007;18:1188–1195. doi: 10.1016/j.jasms.2007.03.001. [DOI] [PubMed] [Google Scholar]
- [95].Baker ES, Dupuis NF, Bowers MT. DNA hairpin, pseudoknot, and cruciform stability in a solvent-free environment. J. Phys. Chem. B. 2009;113:1722–1727. doi: 10.1021/jp807529m. [DOI] [PubMed] [Google Scholar]
- [96].Blasco MA. Telomeres and human disease: ageing cancer and beyond. Nat. Rev. Genet. 2005;6:611–622. doi: 10.1038/nrg1656. [DOI] [PubMed] [Google Scholar]
- [97].Dai JX, Dexheimer TS, Chen D, Carver M, Ambrus A, Jones RA, Yang DZ. An intramolecular G-quadruplex structure with mixed parallel/antiparallel G-strands formed in the human BCL-2 promoter region in solution. J. Am. Chem. Soc. 2006;128:1096–1098. doi: 10.1021/ja055636a. [DOI] [PMC free article] [PubMed] [Google Scholar]
- [98].Huppert JL, Balasubramanian S. Prevalence of quadruplexes in the human genome. Nucl. Acids Res. 2005;33:2908–2916. doi: 10.1093/nar/gki609. [DOI] [PMC free article] [PubMed] [Google Scholar]
- [99].Fukushima K, Iwahashi H. 1 :1 Complex of guanine quartet with alkali metal cations detected by electrospray ionization mass spectrometry. Chem. Commun. 2000:895–896. [Google Scholar]
- [100].Koch KJ, Aggerholm T, Nanita SC, Cooks RG. Clustering of nucleobases with alkali metals studied by electrospray ionization tandem mass spectrometry: implications for mechanisms of multistrand DNA stabilization. J. Mass Spectrom. 2002;37:676–686. doi: 10.1002/jms.326. [DOI] [PubMed] [Google Scholar]
- [101].Aggerholm T, Nanita SC, Koch KJ, Cooks RG. Clustering of nucleosides in the presence of alkali metals: biologically relevant quartets of guanosine, deoxyguanosine and uridine observed by ESI-MS/MS. J. Mass Spectrom. 2003;38:87–97. doi: 10.1002/jms.405. [DOI] [PubMed] [Google Scholar]
- [102].Baker ES, Bernstein SL, Bowers MT. Structural characterization of G-quadruplexes in deoxyguanosine clusters using ion mobility mass spectrometry. J. Am. Soc. Mass Spectrom. 2005;16:989–997. doi: 10.1016/j.jasms.2005.03.012. [DOI] [PubMed] [Google Scholar]
- [103].Baker ES, Lee JT, Sessler JL, Bowers MT. Cyclo[n]pyrroles: size and site-specific binding to G-quadruplexes. J. Am. Chem. Soc. 2006;128:2641–2648. doi: 10.1021/ja0564968. [DOI] [PMC free article] [PubMed] [Google Scholar]
- [104].Baker ES, Bernstein SL, Gabelica V, De Pauw E, Bowers MT. G-quadruplexes in telomeric repeats are conserved in a solvent-free environment. Int. J. Mass Spectrom. 2006;253:225–237. [Google Scholar]
- [105].Gabelica V, Baker ES, Teulade-Fichou MP, De Pauw E, Bowers MT. Stabilization and structure of telomeric and c-myc region intramolecular G-quadruplexes: the role of central cations and small planar ligands. J. Am. Chem. Soc. 2007;129:895–904. doi: 10.1021/ja065989p. [DOI] [PubMed] [Google Scholar]
- [106].Smargiasso N, Rosu F, Hsia W, Colson P, Baker ES, Bowers MT, De Pauw E, Gabelica V. G-quadruplex DNA assemblies: loop length, cation identity, and multimer formation. J. Am. Chem. Soc. 2008;130:10208–10216. doi: 10.1021/ja801535e. [DOI] [PubMed] [Google Scholar]
- [107].Wang Y, Patel DJ. Solution structure of the human telomeric repeat d[AG3 (T2AG3)3] G-tetraplex. Structure. 1993;1:263–282. doi: 10.1016/0969-2126(93)90015-9. [DOI] [PubMed] [Google Scholar]
- [108].Wyttenbach T, von Helden G, Bowers MT. Gas-phase conformation of biological molecules: bradykinin. J. Am. Chem. Soc. 1996;118:8355–8364. [Google Scholar]
- [109].Wyttenbach T, Witt M, Bowers MT. On the Stability of Amino Acid Zwitterions in the Gas Phase: The Influence of Derivatization, Proton Affinity, and Alkali Ion Addition. Journal of the, American Chemical Society. 2000;122:3458–3464. [Google Scholar]
- [110].Wyttenbach T, Bushnell JE, Bowers MT. Salt bridge structures in the absence of solvent? The case for the oligoglycines. J. Am. Chem. Soc. 1998;120:5098–5103. [Google Scholar]
- [111].Caughey BW. Advances in Protein Chemistry. Academic Press; San Diego: 2001. Prion Proteins. [Google Scholar]
- [112].Grabenauer M, Wu C, Soto P, Shea J-E, Bowers MT. Oligomers of the prion protein fragment 106–126 are likely assembled from β-hairpins in solution, and methionine oxidation inhibits assembly without altering the peptide's monomeric conformation. J. Am. Chem. Soc. 2010;132:532–539. doi: 10.1021/ja905595k. [DOI] [PubMed] [Google Scholar]
- [113].Hilton GR, Thalassinos K, Grabenauer M, Sanghera N, Slade SE, Wyttenbach T, Robinson PJ, Pinheiro TJT, Bowers MT, Scrivens JH. Structural analysis of prion proteins by means of drift cell and traveling wave ion mobility mass spectrometry. J. Am. Soc. Mass Spectrom. 2010;21:845–854. doi: 10.1016/j.jasms.2010.01.017. [DOI] [PubMed] [Google Scholar]
- [114].Grabenauer M, Wyttenbach T, Sanghera N, Slade SE, Pinheiro TJT, Scrivens JH, Bowers MT. Conformational stability of Syrian hamster prion protein PrP(90–231) J. Am. Chem. Soc. 2010;132:8816–8818. doi: 10.1021/ja100243h. [DOI] [PMC free article] [PubMed] [Google Scholar]
- [115].Bitan G, Kirkitadze MD, Lomakin A, Vollers SS, Benedek GB, Teplow DB. Amyloid β-protein (Aβ) assembly: Aβ40 and Aβ42 oligomerize through distinct pathways. Proc. Natl. Acad. Sci. U.S.A. 2003;100:330–335. doi: 10.1073/pnas.222681699. [DOI] [PMC free article] [PubMed] [Google Scholar]
- [116].Bernstein SL, Wyttenbach T, Baumketner A, Shea J-E, Bitan G, Teplow DB, Bowers MT. Amyloid β-protein: monomer structure and early aggregation states of A β 42 and its Pro19 alloform. J. Am. Chem. Soc. 2005;127 doi: 10.1021/ja044531p. [DOI] [PubMed] [Google Scholar]
- [117].Bernstein SL, Dupuis NF, Lazo ND, Wyttenbach T, Condron MM, Bitan G, Teplow DB, Shea J-E, Ruotolo BT, Robinson CV, Bowers MT. Amyloid-β protein oligomerization and the importance of tetramers and dodecamers in the aetiology of Alzheimer's disease. Nat. Chem. 2009;1:326–331. doi: 10.1038/nchem.247. [DOI] [PMC free article] [PubMed] [Google Scholar]
- [118].Cheng IH, Scearce-Levie K, Legleiter J, Palop JJ, Gerstein H, Bien-Ly N, Puolivali J, Lesne S, Ashe KH, Muchowski PJ, Mucke L. Accelerating amyloid-β fibrillization reduces oligomer levels and functional deficits in Alzheimer disease mouse models. J. Biol. Chem. 2007;282:23818–23828. doi: 10.1074/jbc.M701078200. [DOI] [PubMed] [Google Scholar]
- [119].Lesne S, Koh MT, Kotilinek L, Kayed R, Glabe CG, Yang A, Gallagher M, Ashe KH. A specific amyloid-β protein assembly in the brain impairs memory. Nature. 2006;440:352–357. doi: 10.1038/nature04533. [DOI] [PubMed] [Google Scholar]
- [120].Zheng XY, Gessel MM, Wisniewski ML, Viswanathan K, Wright DL, Bahr BA, Bowers MT. Z-phe-ala-diazomethylketone (PADK) disrupts and remodels early oligomer states of the Alzheimer disease Aβ42 protein. J. Biol. Chem. 2012;287:6084–6088. doi: 10.1074/jbc.C111.328575. [DOI] [PMC free article] [PubMed] [Google Scholar]
- [121].Gessel MM, Wu C, Li H, Bitan G, Shea J-E, Bowers MT. Aβ (39–42) modulates Aβ oligomerization but not fibril formation. Biochemistry. 2012;51:108–117. doi: 10.1021/bi201520b. [DOI] [PMC free article] [PubMed] [Google Scholar]
- [122].Lee S, Zheng X, Krishnamoorthy J, Savelieff MG, Park HM, Brender JR, Kim JH, Derrick JS, Kochi A, Lee HJ, Kim C, Ramamoorthy A, Bowers MT, Lim MH. Rational design of a structural framework with potential use to develop chemical reagents that target and modulate multiple facets of Alzheimer's disease. J. Am. Chem. Soc. 2013;136:299–310. doi: 10.1021/ja409801p. [DOI] [PMC free article] [PubMed] [Google Scholar]
- [123].Murray MM, Bernstein SL, Nyugen V, Condron MM, Teplow DB, Bowers MT. Amyloid β protein: Aβ40 inhibits Ab42 oligomerization. J. Am. Chem. Soc. 2009;131:6316–6317. doi: 10.1021/ja8092604. [DOI] [PMC free article] [PubMed] [Google Scholar]
- [124].Gessel MM, Bernstein S, Kemper M, Teplow DB, Bowers MT. Familial Alzheimer's disease mutations differentially alter amyloid β-protein oligomerization. ACS Chem. Neurosci. 2012;3:909–918. doi: 10.1021/cn300050d. [DOI] [PMC free article] [PubMed] [Google Scholar]
- [125].Kemper PR, Dupuis NF, Bowers MT. A new higher resolution, ion mobility mass spectrometer. Int. J. Mass Spectrom. 2009;287:46–57. [Google Scholar]
- [126].Glaskin RS, Ewing MA, Clemmer DE. Ion trapping for ion mobility spectrometry measurements in a cyclical drift tube. Anal. Chem. 2013;85:7003–7008. doi: 10.1021/ac4015066. [DOI] [PubMed] [Google Scholar]
- [127].Valentine SJ, Stokes ST, Kurulugama RT, Nachtigall FM, Clemmer DE. Overtone mobility spectrometry: part 2. Theoretical considerations of resolving power. J. Am. Soc. Mass Spectrom. 2009;20:738–750. doi: 10.1016/j.jasms.2009.01.001. [DOI] [PMC free article] [PubMed] [Google Scholar]
- [128].Sipe JD, Cohen AS. Review: history of the amyloid fibril. J. Struct. Biol. 2000;130:88–98. doi: 10.1006/jsbi.2000.4221. [DOI] [PubMed] [Google Scholar]
- [129].Eisenberg D, Nelson R, Sawaya MR, Balbirnie M, Sambashivan S, Ivanova MI, Madsen AO, Riekel C. The structural biology of protein aggregation diseases: fundamental questions and some answers. Acc. Chem. Rev. 2006;39:568–575. doi: 10.1021/ar0500618. [DOI] [PMC free article] [PubMed] [Google Scholar]
- [130].Chiti F, Dobson CM. Amyloid formation by globular proteins under native conditions. Nat. Chem. Biol. 2009;5:15–22. doi: 10.1038/nchembio.131. [DOI] [PubMed] [Google Scholar]
- [131].Sawaya MR, Sambashivan S, Nelson R, Ivanova MI, Sievers SA, Apostol MI, Thompson MJ, Balbirnie M, Wiltzius JJW, McFarlane HT, Madsen AO, Riekel C, Eisenberg D. Atomic structures of amyloid cross-β spines reveal varied steric zippers. Nature. 2007;447:453–457. doi: 10.1038/nature05695. [DOI] [PubMed] [Google Scholar]
- [132].Bleiholder C, Dupuis NF, Wyttenbach T, Bowers MT. Ion mobility-mass spectrometry reveals a conformational conversion from random assembly to β-sheet in amyloid fibril formation. Nat. Chem. 2011;3:172–177. doi: 10.1038/nchem.945. [DOI] [PMC free article] [PubMed] [Google Scholar]
- [133].Smith GD, Griffin JF. Conformation of [Leu5]enkephalin from X-ray-diffraction: features important for recognition at opiate receptor. Science. 1978;199:1214–1216. doi: 10.1126/science.204006. [DOI] [PubMed] [Google Scholar]
- [134].Do TD, LaPointe NE, Economou NJ, Buratto SK, Feinstein SC, Shea JE, Bowers MT. Effects of pH and charge state on peptide assembly: the YVIFL model system. J. Phys. Chem. B. 2013;117:10759–10768. doi: 10.1021/jp406066d. [DOI] [PubMed] [Google Scholar]
- [135].Bleiholder C, Do TD, Wu C, Economou NJ, Bernstein SS, Buratto SK, Shea JE, Bowers MT. Ion mobility spectrometry reveals the mechanism of amyloid formation of Aβ(25–35) and its modulation by inhibitors at the molecular level: epigallocatechin gallate and scyllo-inositol. J. Am. Chem. Soc. 2013;135:16926–16937. doi: 10.1021/ja406197f. [DOI] [PubMed] [Google Scholar]
- [136].Do TD, Economou NJ, LaPointe NE, Kincannon WM, Bleiholder C, Feinstein SC, Teplow DB, Buratto SK, Bowers MT. Factors that drive peptide assembly and fibril formation: experimental and theoretical analysis of Sup35 NNQQNY mutants. J. Phys. Chem. B. 2013;117:8436–8446. doi: 10.1021/jp4046287. [DOI] [PubMed] [Google Scholar]
Associated Data
This section collects any data citations, data availability statements, or supplementary materials included in this article.


