

Abstract
Purpose
To identify novel therapeutic drug targets for p53 mutant head and neck squamous cell carcinoma (HNSCC).
Experimental Design
RNAi kinome viability screens were performed on HNSCC cells including autologous pairs from primary tumor and recurrent/metastatic lesions, and in parallel on murine squamous cell carcinoma (MSCC) cells derived from tumors of inbred mice bearing germline mutations in Trp53, and p53 regulatory genes: Atm, Prkdc, and p19Arf. Cross-species analysis of cell lines stratified by p53 mutational status and metastatic phenotype was utilized to select 38 kinase targets. Both primary and secondary RNAi validation assays were performed on additional HNSCC cell lines to credential these kinase targets utilizing multiple phenotypic endpoints. Kinase targets were also examined via chemical inhibition utilizing a panel of kinase inhibitors. A preclinical study was conducted on the WEE1 kinase inhibitor, MK-1775.
Results
Our functional kinomics approach identified novel survival kinases in HNSCC involved in G2/M cell cycle checkpoint, SFK, PI3K and FAK pathways. RNAi mediated knockdown and chemical inhibition of the WEE1 kinase with a specific inhibitor, MK-1775, had a significant effect on both viability and apoptosis. Sensitivity to the MK-1775 kinase inhibitor is in part determined by p53 mutational status, and due to unscheduled mitotic entry. MK-1775 displays single-agent activity and potentiates the efficacy of cisplatin in a p53 mutant HNSCC xenograft model.
Conclusions
WEE1 kinase is a potential therapeutic drug target for HNSCC. This study supports the application of a functional kinomics strategy to identify novel therapeutic targets for cancer.
Keywords: HNSCC; functional genomics; WEE1; p53; MK-1775 (a.k.a, AZD-1775)
Introduction
Patients with head and neck squamous cell carcinoma (HNSCC) are treated aggressively with surgery followed by radiation, often together with cisplatin (1). Although these treatments increase loco-regional control, they are frequently disfiguring and induce high-grade toxicities limiting their effectiveness (2). Furthermore, resistance to cisplatin and radiation contributes to tumor recurrence, and options for those who do not respond are limited to palliative care. Targeted therapies for HNSCC are currently limited to experimental agents targeting the epidermal growth factor receptor (3).
Mutations in the tumor suppressor gene p53 are very common in HNSCC, with an estimated frequency of >50% (4, 5). Disruptive p53 mutations have been associated with metastasis, resistance to radiation, and poor patient survival (6–8). Despite the strong implication of p53 in the biology and clinical outcome of HNSCC, there are no available therapies that specifically target p53 mutant cancer cells. Here, we hypothesized that HNSCC cancer cells, in particular those with p53 mutations, are dependent on particular kinases for survival and that targeting these kinases could have therapeutic potential. To identify these cancer-specific survival kinases, we utilized an unbiased and genome scale high-throughput (HT) siRNA gene silencing strategy. We surveyed the entire human kinome to identify those kinases that are required for survival of HNSCC cells stratified by p53 mutational status and metastatic propensity. We included pairs of HNSCC cells derived from primary tumors and either recurrent or metastatic lesions. The cell lines derived from the recurrent or metastatic tumors have been shown by us and others to have more aggressive features than their primary tumor autologous pairs, as measured by migration, avoidance of anoikis, and metastatic potential in mouse orthotopic xenografts (Methods for details) (9). Recurrent metastatic tumors are generally resistant to standard of care therapies and as such are most in need of novel targeted therapies.
The rationale for targeting kinases in human cancer is significant. These enzymes regulate multiple cellular processes that contribute to tumor development and progression, and many human tumors display aberrant activation of kinases caused by genetic alterations. For tumors that are dependent on kinase activity for survival, targeted drugs could be effective.
Understanding that human cancer cell lines exhibit genetic and phenotypic heterogeneity, which can hamper the identification of robust drug targets, we performed a parallel siRNA kinome screen using a set of low passage murine squamous cell carcinoma (MSCC) cells. These cancer cells were derived from tumors of inbred mice bearing germline mutations in p53 and p53 regulatory genes Atm, Prkdc, and p19Arf (10–13). This set of p53 pathway deficient cancer cells share the same culture history and genetic background and were derived from tumors sharing the same etiology. Comparative analysis of siRNA screen results between mouse and human cells identified kinases relevant to squamous cell carcinoma survival, perhaps these evolutionarily conserved kinases represent more robust therapeutic targets. Through an efficient in vitro and in vivo prioritization and validation scheme, we identified the G2/M cell cycle regulatory kinase WEE1 as one of several clinically promising targets, and show that inhibition of WEE1 with a highly specific small molecule inhibitor impaired growth of p53 mutant HNSCC tumors in vivo.
Materials and Methods
Cell lines
The following human HNSCC cell lines were used: UM-SCC14A, UM-SCC14C, PCI-15A, PCI-15B, JHU-019, UM-SCC22A, UM-SCC22B, UM-SCC38, UM-SCC17A, SCC-61, and three HPV(+) cell lines: UM-SCC47, UPCI:SCC090 and UM-SCC104 (Table S1). Three cell line pairs were derived from primary tumors and subsequent recurrences or metastatic cervical lymph nodes from the same patients: UM-SCC14A, and UM-SCC14C; PCI-15A and PCI-15B; and UM-SCC22A and UM-SCC22B. Cell line JHU-019 was derived from a late-stage OSCC patient (Table S1). For the paired lines, wound-healing assays revealed that the migration rate of cell lines derived from metastatic HNSCC (i.e. UM-SCC-14C and PCI-15B) was higher than those derived from the primary tumor (i.e., UM-SCC-14A and PCI-15A) and that JHU-019 had the fastest migration rate (9). In addition, JHU-019 and PCI-15B cell lines tested in mouse xenografts by orthotopic injection into the tongue produced squamous carcinoma at the sites of injection and cervical lymph node metastasis (9). Given a previous report raising concerns of JHU-019 contamination with prostate adenocarcinoma cells (14), we performed immunohistochemistry staining of 4 paraffin-embedded blocks from JHU-019 tumors orthotopically-injected in the tongue of NOD/SCID IL2 gamma null mice (NSG) mice with antibodies against 3 markers used clinically to identify both squamous cell and prostate carcinoma (EP1601Y for Cytokeratin 5 (CK5); BC4A4 for p63; and PSA for Prostate Specific Antigen). Staining and evaluation of the immunohistochemical stains cited above were determined by the CLIA-certified UW Medicine Pathology Laboratories. There was uniformly positive staining for p63 in all blocks, uniformly positive staining for CK5 in two blocks and variably positive staining in the other two blocks. There was no staining for PSA in any of the blocks (data not shown). To determine p53 mutational status, we designed primers to amplify exons 2–11 using Primer3 software (Whitehead Institute, Cambridge, MA). Primer specificity was confirmed by gel electrophoresis. PCR-amplified fragments were purified and sequenced using an ABI 3730xl DNA Analyzer with ABI’s BigDye Terminator Cycle Sequencing method. Sequencing results are aligned to GenBank TP53 sequence NG_017013.1 using Sequencher 4.10.1 (Gene Codes, Ann Arbor, MI). Cell lines were characterized for metastatic potential as described (9). To determine if a p53 mutation is disruptive, we used criteria established by Poeta et al. (7).
Murine squamous cell carcinoma (MSCC) cells were derived from NIH/Ola strain mice with germline mutations in p53 pathway genes and included: MSCC-CK101 (HrasQ61L Trp53+/+), MSCC-CK102 (HrasQ61L Trp53 +/−), MSCC-CK103 (Hraswt p19Arf −/−), MSCC-CK104 (KrasG13R Atm−/−), MSCC-CK1 (Hras Q61L p53+/+) and MSCC-CK4 (Hras Q61L p53−/− (Cre+ p53 lox/lox)) (10–12). MSCC-CK105 (HrasQ61L Prkdcmu/mu) cells were from SCID mutant mice of a mixed C3H/Balb/c background (13) (Table S2). All mice were subjected to the identical DMBA/TPA two-stage carcinogen protocol to induce squamous cell carcinoma. Tumors induced by this protocol principally harbor an activating mutation in the Hras oncogene, but mutations in Kras have also been noted (15, 16). Carcinomas arising from both p19Arf and p53 deficient mice are highly aggressive and metastatic (11, 12, 17, 18). Mouse SCC lines were derived using a standard outgrowth explant method. Briefly, carcinoma tissue was washed in sterile PBS, sliced into 2mm pieces using a sterile razor blade, and placed into a 60mm tissue culture plate with DMEM media, 10% FCS and Pen/Strep. Media was replaced every 72 hours until cell outgrowths reached 70–90% confluence, and were subsequently passaged and/or frozen at low passage number. Total RNA was isolated from the MSCC-CK1 line with TrIzol and cDNA generated utilizing Superscript 3 reverse transcriptase (Life Technologies). The p53 cDNA transcript spanning exons 2–11 was PCR amplified as previously described (19), and cloned into a TOPO TA vector (Life Technologies), competent cells transformed, and several colonies sequenced using an ABI 3730xl DNA Analyzer with ABI’s BigDye Terminator Cycle Sequencing method for mutations in the p53 gene (Table S2).
High-throughput RNA interference kinome screens
Kinome-wide siRNA screens were performed with viability as the phenotypic endpoint on five HNSCC lines: JHU-019; PCI15A and 15B; UM-SCC14A and 14C; and five MSCC lines: MSCC-CK101, MSCC-CK102, MSCC-CK103, MSCC-CK104, MSCC-CK105. Normal human foreskin fibroblasts were screened to control for nonspecific cell toxicity (UW-Quellos facility proprietary data). Briefly, culturing of normal human foreskin fibroblasts was performed as previously described (20). Kinome-wide RNA interference screens were performed on two cultures of human foreskin fibroblasts (HFF1, HFF3) utilizing the Ambion kinome library (Ambion-Life technologies). An HFF exclusion plot was generated using this kinome screen information to determine whether RNAi mediated knockdown of kinase targets compromised cell viability in both HFF cultures, with < 70% viability (>30% cell death) as a threshold (Fig. S2; partial data shown). siRNA libraries targeting 713 human (MISSION® siRNA Human Gene Family Set, Sigma) and 572 murine kinases (Ambion) were constructed and utilized in pools of 3 independent siRNAs targeting each gene, in a one gene per well approach. RNAi screens were performed in 384-well format utilizing robotics instrumentation (21). Transfection feasibility of each cell line was established using a factorial optimization. Mock condition and a non-targeting universal siRNA control were utilized as negative controls, while a siRNA directed at KIF11 (kinesin-like protein), which arrests cells in mitosis was utilized as a positive control. All reagent conditions were statistically evaluated using a simple Z-factor score to evaluate differentials and variability of replicates (i.e. potent cell killing with KIF11 at the lowest toxicity possible in the mock universal controls) to select an optimized transfection condition for each cell line (22). All kinases were tested in triplicate to establish experimental variability and statistical validity. Scrambled siRNA negative controls were used to monitor dynamic range and off-target effects and the results were standardized to mock-transfected cells. Viability and apoptosis were quantified utilizing an Envision Multilabel detector/ plate reader (Perkin Elmer) with either a CellTiterGlo assay (Promega), or Apotox assay (Promega), the former measures metabolic ATP via a standard curve to mock/universal siRNA at all conditions. Raw luminescence values were mock normalized per plate and then Z transformed per cell line and plotted for distribution and data mining (Miner 3D software, version 7.3). All HT kinome screens and subsequent validation screens on MSCC and HNSCC cells were statistically evaluated using published methods (23).
Comparison of human and mouse kinome screens
The 713 human (Table S3) and 572 murine kinase (Table S4) sets were cross-referenced utilizing mouse genome informatics (MGI) (http://www.informatics.jax.org/) and National Center for Biotechnology Information (NCBI) (http://www.ncbi.nlm.nih.gov/) database nomenclature to generate a common list of 508 kinases referred to as the interspecies kinome (Table S5). Using this common list, prioritization of screen results then followed based on the viability scores from the 5 HNSCC cells and 5 MSCC cell lines. Mean viabilities (μi2) from 5 HNSCC cell lines [μi2 All (human) = μi (O19) + μi (14A) + μi (14C) + μi (15A) + μi (15B)] and from 5 MSCC cell lines were calculated [μi2 All (murine) = μi (WT) + μi (Trp53+/−) + μi (p19Arf−/−) + μi (Atm−/−) + μi (Prkdc mu/mu)] for each of 508 kinases {i=1,2,3,4…508}, where μi is the triplicate of pooled siRNAs (3 distinct siRNAs) average normalized viability for each individual gene per cell line. Mean viabilities (μi2) for each gene were then Z transformed using the equation, Z = μi2 − μ/σ where μ is the mean viability and σ the standard deviation for all siRNAs/wells for all 5 HNSCC cell lines and all 5 MSCC cell lines, respectively (Table S8). Mean viabilities (μi2 All, μi3 p53 mutant, μi4 metastatic) and Z score transformations were calculated for both human and murine lines per genotype and phenotype: 1) all human and murine cell lines; 2) p53 mutant/deficient human and murine cell lines; and 3) metastatic human and murine cell lines (Table S8). Cartesian plots (Z-score murine, Z-score human) of all 508 kinases in common with murine and human kinomes were then generated for each of the three comparisons. Population mean viabilities (Mean All, Mean p53 mutant All, Mean Metastatic) and Z-score transformations (Z-score Mean All, Z-score p53 mutant All, Z-score Mean Met) were calculated for specific genotypic and phenotypic comparisons and utilized in the color-coded overlay on the cartesian plots for selection per comparison (Fig. 1B, Table S8). Kinase targets were selected based on Z-score threshold from each of the cartesian plots: Z-score Mean All < −1.0; Z-score p53 mutant All < −2.0, Z-score Mean Met < −1.5 (Table S8), where kinases were data mined from more then one comparison and duplicates were removed for a final selection of 38 kinase targets from all three comparisons, kinase targets (38 kinases) = kinase targets All + kinase targets p53mutant + kinase targets Met (Fig. 1B, 1C, Table S8). Kinases were further prioritized based on those whose expression or activity was increased in squamous cell carcinoma (SCC) and that play known functions in SCC pathogenesis.
Figure 1. Comparative functional kinomics approach to identify survival kinases in squamous cell carcinoma.

A. Flow chart schematic of functional kinomic approach for discovery of kinase targets. RNAi screen hits from both murine (MSCC) and human (HNSCC) cells were prioritized by cross-species comparison. B. Cartesian plots of Zscores from interspecies kinome (508 kinases) to identify kinase targets which had the highest shared impact on cell viability. Human and mouse cell lines were sorted into each of three comparisons: All cells (left), p53 mutant cells (middle), and metastatic cells (right). Candidate kinase targets with Zscores greater than one standard deviation from the mean cell viability per comparison are shown in red; Table S8 for details. C. Venn diagram of selection of 38 kinase targets from interspecies comparison; inclusion in diagram represents kinases targets that met a certain threshold in each comparison.
Primary validation of kinase targets with siRNA
Twenty-eight kinases were selected for follow-up and validation based on the interspecies kinome comparison and HFF kinase exclusion. Two small-scale time-course primary validation RNAi screens were performed in parallel on four HNSCC cell lines (UM-SCC14A, UM-SCC14C, PCI-15A, PCI-15B) in 384-well formats with an independent set of siRNAs (Qiagen, Table S6), with three separate siRNAs plus pooled siRNAs per gene target in triplicate for an N=12 for each gene target. All phenotypic endpoints of cell viability and caspase 3/7-dependent apoptosis were measured in parallel screens in a time-course format at 1.5, 3, and 4.5 days post-transfection using the CellTiter-Glo assay (Promega) and Apotox-Glo (Caspase-Glo 3/7 reagent) assay (Promega) per manufacturers specifications and an Envision multilabel plate reader (PerkinElmer). Primary screen “hits” were assessed utilizing a single endpoint for cell viability at 4.5 days post-transfection termed, absolute viability, by both a negative-control independent analysis: triplicate siRNAs versus population mean of the screen, Z-score threshold and unpaired t-test, Z-score < −1.0, P<0.1 scored as hit, (Table S13, Column U), as well as a negative-control dependent analysis: triplicate siRNAs versus universal negative control siRNAs, ANOVA with Dunnetts post-test, mean difference > 0 and P<0.05 scored as hit, (Table S13, Column AA) (Summary of ‘hits’; Table S14). Comparing post-transfection effects on absolute viability (day 4.5) for each kinase target with either the universal negative control siRNA or the population mean yielded similar results (Tables S13–S14). Differential viabilities (day 4.5-1.5) based on the mean of both the N=12 data (i.e., all three distinct siRNAs per target plus pooled siRNAs in triplicate) and N=3 data (i.e., pooled siRNAs alone) were calculated for all 28 kinase targets (Tables S10–S12). AUC (area under the curve) estimates of caspase-dependent apoptosis (AUCestimate) utilizing all three data points with both the N=12 data and N=3 pooled siRNAs were calculated for all kinase targets (Tables S15–S17). Statistical significance of RNA interference mediated knockdown of the 28 kinases was assessed via ANOVA with Dunnetts post-test for multiple comparisons (P<0.05 as significant) on differential viability (day 4.5 - day 1.5), and area under the curve (AUC) analysis of caspase 3/7 dependent apoptosis versus universal negative siRNA control (UNI). (Tables S10–S12, S15–S17).
Secondary validation of kinase targets with siRNA
Ten kinase targets were further validated in a 96 well format in five additional HNSCC cell lines (UM-SCC22A, UM-SCC22B, UM-SCC38, UM-SCC47A, JHU-019). In addition, the ten HFF exclusion kinase targets were included in the low-throughput assay (i.e., 20 kinase targets). This assay consisted of three independent siRNAs per well (pooled siRNAs) assayed in triplicate (Qiagen, Table S7) for cell viability and apoptosis measured at 1.5, 3, and 4.5 days post-transfection utilizing the Apotox-Glo assay (Promega, Madison, WI) as per manufacturers specifications utilizing a Synergy H4 Hybrid Multi-Mode microplate reader (Biotek). Statistical significance of RNA interference mediated knockdown of the 20 kinases was assessed via ANOVA with Dunnetts post-test for multiple comparisons on absolute viability (day 4.5), differential viability (day 4.5 - day 1.5), and area under the curve (AUC) analysis of caspase-dependent apoptosis versus the negative siRNA control (SINC) (Tables S18–S20).
Dose-response curves with kinase inhibitors
Kinase inhibition dose response curves were performed with six kinase inhibitors (MK-1775 (a.k.a., AZD-1775), TAE684, PI828, PIK93, PP2, PF-562271) against kinase targets (WEE1, ALK, PI3K, PIK4CB, FYN, FAK (ILK surrogate)), respectively. Kinase inhibitors: MK-1775 (S1525), PIK93 (S1489), TAE684 (S1108) were obtained from Selleck Chemicals (Houston, TX); PI828 (2814), PP2 (1407) from Tocris Bioscience (Mpls, MN), and PF-562271 from Synkinase (San Diego, CA). All HNSCC (UMSCC-17A, UM-SCC47A, PCI-15A, PCI-15B, UM-SCC14A, UM-SCC14C) and MSCC (CK1: p53+/+ and CK4: p53−/−) cells were plated at ~5–10 × 103 cells/100 μl per well, and incubated at 37°C for ~24 hours on 96-well assay plates (Corning Inc.). Serial dilutions of the kinase inhibitors and vehicle control (DMSO) were prepared in 1 mL assay blocks at 3x working concentration to generate dose-response curves ranging from 100 μM to 0.03 μM. All serial dilutions were prepared using cell culture media. Approximately 72 hours post-treatment, cells were assessed for metabolic activity via ATP using CellTiterGlo (Promega), following the protocol outlined by the manufacturer utilizing an FLx800, and/or a Synergy H4 Hybrid multi-mode reader (Biotek). All assays were performed in triplicate and normalized to wells with no treatment. Dose-response curves and IC50 values were generated using GraphPad Prism Version 5 (Parameters: nonlinear regression fit; equation= log (inhibitor) vs. response – variable slope (four parameters); single constraint).
COSMIC public database of drug sensitivity data
Utilizing the catalogue of somatic mutations in cancer (COSMIC) website, TP53 gene mutational status was extracted from the Sanger Cancer Cell Line Project which contains information on 820 cancer cell lines. In addition, the Genomics of Drug Sensitivity Project (Release 2 July 2012) contains 541 cancer cell lines that were treated with a WEE1/CHK1 inhibitor, 681640 (EMD Millpore), a pyrrolocarbazole compound that acts as a potent, ATP-binding site inhibitor of WEE1 (IC50 = 11 nM). Drug sensitivity was measured with 9 different concentrations of 681640 and half maximal inhibitory (50%) values presented as natural log (μM) (Table S21). The sign test was applied to test the median difference in sensitivity by TP53 status. We performed a similar analysis on only the squamous cell carcinoma (SCC) cell lines. Forty-two squamous cell lines were identified from COSMIC annotation, eight were p53 wild type and the remaining 34 had a p53 mutation.
Mitotic entry, cell cycle analysis, apoptotic assays
Mitotic entry was assessed as previously described (24). Briefly, HNSCC cells (PCI-15B, UMSCC-17A) were treated with 1 μM MK-1775 for 8 and 24 hours, and all cells were harvested, washed, and incubated with rabbit monoclonal antibody to phospho-histone H3 (Serine10) (Cell Signaling Technology, Cat. No. 3465, Danvers, MA) for 2 hours at RT, washed, and DNA stained with 20 μg/ml propidium iodide, RNaseA in PBS (Sigma-Aldrich; Cat. Nos. P4170, R6513). Flow cytometric analysis was performed utilizing a BD FACS Canto II, and profiles analyzed with BD Cell Quest software (Becton Dickinson, CA). Caspase-3/7 dependent apoptosis was assessed as per protocol (Promega, Cat. No. G8091) utilizing a SynergyH4 Hybrid Reader (Biotek, VT). AUCs were calculated for all treatments and vehicle (DMSO) for all cell lines utilizing two measurements over a 48-hour period with three concentrations (30 nm, 100 nm, 1 μM) of MK-1775.
Xenograft tumor model
PCI-15B cells were inoculated subcutaneously into the right flanks of 28 eight-week old NOD/SCID IL2 gamma null mice (NSG) provided by the Olson laboratory at the Fred Hutchinson Cancer Research Center. When tumors reached a palpable mass of >50 mm3, mice were randomly assigned into four treatment groups of seven mice each and all measurements and treatment regimens were carried out using a double-blind protocol. The WEE1 inhibitor MK-1775 (S1525-Selleck Chemicals, Houston, TX) was delivered by oral gavage (30 mg/kg) twice per week for 4 weeks in dimethylsulfoxide in 0.5% methylcellulose (M0512, Sigma Aldrich) in a 1:14 suspension. Cisplatin (P4394, cis-diammineplatinum (II) dichloride, Sigma Aldrich) was delivered via intra-peritoneal injection (4.0 mg/kg) once a week for 4 weeks. The volume of the implanted tumor was measured weekly with calipers and tumor volumes calculated using the formula: V=LxW2/2; in which V, volume (mm3); L, largest diameter (mm); W, smallest diameter (mm). All animal protocols were approved by the Fred Hutchinson Cancer Research Center Laboratory Animal Care and Use Committee.
Immunoblotting
Tumor tissues were minced and homogenized on ice in M-PER Mammalian Protein Extraction Reagent supplemented with Halt Protease and Phosphatase Inhibitor Cocktail (Thermo Fisher Scientific). Extracted proteins were quantified by a BCA protein assay (Thermo Fisher Scientific). Fifty μg of each protein specimen was revealed on a NuPAGE® 4–12% Bis-Tris mini gel (Life Technologies) and transferred onto an Immobilon-P PVDF membrane (Millipore, Billerica, MA). Anti-WEE1 (Cat. No. 4936), anti-phospho-WEE1 (Ser642) (Cat. No. 4910), anti-CDC2 (Cat. No. 9112), and anti-phospho-CDC2 (Tyr15) (Cat. No. 4539) antibodies were purchased from Cell Signaling Technology (Danvers, MA). The secondary antibodies used were ZyMax™ horseradish peroxidase (HRP) conjugated goat-anti-rabbit IgG (Life Technologies). HRP was detected with SuperSignal West Pico Chemiluminescent Substrate kit (Thermo Fisher Scientific). Densitometry on immunoblot was performed with ImageJ software (Wayne Rasband, NIH, Bethesda, MD) and raw data normalized to β-actin loading control per lane.
Statistical Analysis
All column and curve data points presented as mean +/− standard error of the mean (sem), unless otherwise noted. All statistical analyses were performed using unpaired two-tailed t-tests unless otherwise indicated. All statistical analysis of RNAi interference primary and secondary screening data is described above and all calculations used for significance testing are presented in supplemental tables. Statistical tests were all performed utilizing Graphpad Prism versions 5 & 6 (GraphPad Software Inc., CA) (Tables S9–S20).
Results
RNA interference kinome screens of squamous cell carcinoma
We performed kinome wide siRNA viability screens on a set of five HNSCC cell lines (UM-SCC14A; UM-SCC14C; PCI-15A; PCI-15B and JHU-019). Two pairs of these cells (UM-SCC14A UM-SCC14C and PCI-15A, PCI-15B) were derived from primary and subsequent post-treatment recurrences or metastatic cervical lymph nodes from the same patients and all carried disruptive mutations in p53 (Table S1). A total of 713 kinases were interrogated using an arrayed siRNA platform that quantified cell viability following knockdown with a pool of 3 siRNAs/gene/well. All assays were performed in triplicate. Cell viability was monitored 4 days after siRNA transfection using the ATP-based, CellTiterGlo assay (see Methods for details). In parallel, we performed kinome-focused screens on a set of five low passage cancer cells derived from murine squamous cell carcinomas (MSCC) (Table S2). These cells were isolated from carcinoma bearing inbred mice harboring germline mutations in the p53 pathway genes Atm, Prkdc, p19Arf, and Trp53 (10–13).
Next, we derived an interspecies kinome (508 kinases shared between both species) to identify kinases in which RNA interference mediated knockdown negatively impacted cell viability in both human and mouse cells (see schematic in Fig. 1A). Cell screens were further stratified by p53 mutant status and metastatic propensity. Cartesian plots with cross-species comparison of viability Z scores for all 508 kinases, for all cell lines (left), p53 mutant cell lines (middle), and metastatic cell lines (right) are shown in figure 1B. Thirty-eight kinases were selected for follow up based on several criteria, including shared negative Z scores in both species and specificity to cells with mutant p53 and metastatic phenotype (Fig. 1C, Table S8). Many of these putative HNSCC survival kinases are implicated in signaling pathways such as focal adhesion and integrin signaling (CAMK2B, FYN, ILK, EPHA3, EIF2AK4, TRIB2), PI3K signaling (PIK4CB, PIK3CB, PIP5K1B, TRIB2, FGFR3, ALK), SRC signaling (FYN, TXK, CAM2KB), and G2/M cell cycle regulation (WEE1, NEK4, TTK, AURKA, CHK1).
In order to prioritize targets for preclinical validation, we used primary cultures of human foreskin fibroblasts (HFF) to assess whether inhibition of these kinases caused toxicity to normal cells. Ten kinases caused >30% loss in cell viability in both HFF cultures (Fig. S2) and were not included in the primary validation screen. The remaining 28 kinase targets were retested with independent siRNAs on the same two pairs of autologous HNSCC cell lines (UM-SCC14A and 14C; PCI-15A and 15B) using a format of three separate siRNAs per gene plus a pool of all three siRNAs, each in triplicate (i.e., N=12 per gene) (Fig. S1). Both cell viability and caspase 3/7-dependent apoptosis were measured in parallel at 1.5, 3, and 4.5 days post-transfection. Differential viability (day 4.5 -1.5), absolute viability (day 4.5), and apoptosis was calculated for each kinase (Tables S9–S17, Methods for details). Differential viabilities were calculated in order to measure post-transfection effects over time (day 4.5-1.5) and statistically evaluated versus the universal negative control siRNA (Fig. 2A, Tables S10–S12). Differential viabilities calculated utilizing three separate siRNAs per gene plus the pool of all three siRNAs yielded comparable results to using the pool of all three siRNAs alone (Tables S10–S12). We focused on the pooled analysis to reduce off-target effects (25). Likewise, results obtained utilizing either differential or absolute viability metrics yielded similar prioritized kinase targets (Tables S10–14, see Methods for details). To measure the cumulative effects of RNAi mediated knock-down on apoptosis, area under the curve estimates of caspase-dependent apoptosis was determined versus the universal negative control siRNA (Fig. S1, Fig. 2B, Tables S15–17). Results from this primary validation screen revealed that many of the kinase targets that significantly reduced viability also increased apoptosis (Fig. 2A). RNAi mediated knockdown of NEK4 and WEE1 kinases led to a significant reduction in cell viability in all four cell lines tested, while targeting TRIB2 did so for three of the four lines.
Figure 2. RNA interference validation screens on kinase targets.

A. RNAi primary validation screen; left bar graphs show differential cell viability (day 4.5 – day 1.5) of RNAi-mediated knockdown of 28 kinase targets in autologous pairs of HNSCC cell lines derived from primary tumor and recurrent/metastatic site (14A,14C,15A,15B); kinase target vs. UNI, P<0.05 (green); right bar graphs show caspase-dependent apoptosis integrated over 4.5 day time-course of RNAi-mediated knockdown of 28 kinase targets, kinase target vs. UNI, P<0.05 (blue); results ranked by differential viability for each kinase target per HNSCC cell line. B. RNAi secondary validation assays in five additional HNSCC cell lines (22A, 22B, 38, 47, 019); left bar graphs show differential cell viability (day 4.5 - day 1.5) of RNAi-mediated knockdown of 20 kinase targets in HNSCC cell lines, kinase target vs. SINC, P<0.05 (green); right bar graphs show caspase-dependent apoptosis integrated over 4.5 day time-course of RNAi-mediated knockdown of 20 kinase targets in HNSCC cell lines, kinase target vs. SINC, P<0.05 (blue), results ranked by differential viability for each kinase target per HNSCC cell line. C. Kinase target significance in HNSCC. RNAi-mediated knockdown of kinase targets ranked by percentage of HNSCC cell lines in which kinase target reached statistical significance versus universal negative siRNA control. Differential viability (top); caspase 3/7 dependent apoptosis (bottom).
Ten kinase targets (NEK4, WEE1, ILK, CAM2KB, FGFR3, FYN, PI4KB (PIK4CB), TRIB2, TTK, TXK) that caused a significant reduction in viability and/or increase in apoptosis following siRNA transfection in at least one cell line were selected for secondary validation on five additional HNSCC lines (UM-SCC22A, UM-SCC22B, UM-SCC17, UM-SCC47 and UM-SCC38), and kinase target metrics were measured and calculated using the same format as above (Fig. S1, Tables S18–20). UM-SCC22A and UM-SCC22B are an autologous pair of cells derived from a primary tumor and cervical lymph node metastasis from the same patient. We also retested ten kinases from the discovery screen whose siRNAs reduced viability in HFFs (Fig. 2B, Fig. S1, Table S1, Tables S18–20).
RNAi mediated knockdown of kinases that regulate the G2/M transition, NEK4, WEE1, AURKA, and CHK1, as well as FYN and CAM2KB significantly impaired viability in three or more of the five cell lines tested (Fig. 2B) while knockdown of the WEE1, NEK4, and AURKA kinases induced the highest levels of apoptosis in all five HNSCC cell lines. Altogether, compiled primary and secondary validation data showed that RNA interference mediated knockdown of WEE1, NEK4, and AURKA kinases significantly reduced viability and increased apoptosis in over 75% of HNSCC cell lines (Fig. 2C).
A comparison of functional kinomic profiles between cell line pairs isolated from the same patients showed a high degree of concordance, but with a tendency for the metastatic/recurrent cells to be more resistant to kinase knockdown relative to their primary tumor cell pair (Fig. 2, Fig. S3). For example, RNAi mediated knockdown of TK2 and TRIB2 was more effective in cells isolated from the primary vs. the recurrent/metastatic lesions (Fig. 2A, Fig. S3). Several kinases, such as WEE1 and NEK4, remained equally effective in both primary and recurrent/metastatic tumors.
Small molecule inhibition of kinases confirms role in HNSCC cell survival
We further prioritized kinase targets using commercially available small molecule inhibitors. This step not only provides independent chemical confirmation of siRNA results but also provides lead compounds to test in in vivo models. Dose-response curves utilizing kinase inhibitors were performed for WEE1 (MK-1775), ALK (TAE684), PIK4CB (PIK93), FAK (PF-562271), PIK3CB (PI828), and FYN (PP2) (Fig. 3). In agreement with our siRNA knockdown experiments, p53 mutant HNSCC cell lines were sensitive to small molecule inhibitors targeting WEE1, ALK, PIK4CB, and FAK. The WEE1 kinase inhibitor, MK-1775 had the broadest and most significant effect on cell survival in both primary and recurrent/metastasis derived HNSCC cells, with an IC50 ranging from 220 nM-3.1 μM (Fig. 3).
Figure 3. Chemical inhibition of SRC family kinase (FYN), phosphatidylinositiol kinases (PIK3CB, PIK4CB), focal adhesion kinase (FAK), tyrosine kinase receptor (ALK), and G2/M mitotic kinase (WEE1) impair viability of autologous pairs of p53 mutant HNSCC cells.

Dose-response curves performed with six kinase inhibitors (MK-1775, TAE684, PF- 562271, PI828, PIK93, PP2) against kinase targets (WEE1, ALK, PIK3CB, PIK4CB, FYN, FAK; 8-point, mean (N=3), range 100 μM-30 nM, R2 > 0.85 for all curves. Autologous HNSCC cell pairs (UMSCC-14A, UMSCC-14C, PCI-15A, PCI-15B) derived from primary and recurrent/metastatic site from the same patient (15, 16).
Preclinical validation of WEE1 as a drug target for HNSCC in vitro and in vivo
Results from our cross-species comparative analysis of kinome screens, validation assays, and small molecule inhibitor studies nominated WEE1, a G2/M regulator, as a promising target against p53 mutant HNSCC. To further explore the sensitivity of p53 deficient cells to WEE1 inhibition, we performed dose-response curves with MK-1775 in pairs of p53 wild type and p53 mutant/deficient SCC cells. The IC50 for MK-1775 was 20-fold lower in p53−/− MSCC cells compared to p53 wild type cells (0.22 μM vs. 4.5 μM) (Fig. 4A). The IC50 for MK-1775 in p53 mutant PCI-15A and PCI-15B HNSCC cells (0.14 – 0.17 μM) and p53 wild type SCC-61 and UMSCC-17A cells (2.8 – 4.5 μM) showed a similar differential sensitivity to MK-1775 as the mouse SCC cells. Interestingly, the HPV+, p53 wild type UMSCC-47, UPCI:SCC090 and UMSCC104 cells showed IC50 values (0.29 – 0.84μM) closer to p53 mutant cell lines (Fig. 4B, 4C).
Figure 4. Drug sensitivity of MSCC and HNSCC cells to chemical inhibition of G2/M mitotic kinases determined by loss-of-function mutational status of p53.

A. Differential sensitivity of MSCC p53 +/+ and p53 −/− cells to WEE1 inhibitor MK-1775 and CHK1/CHK2 inhibitor AZD7762. 12-point dose response curves, mean +/− sem (N=3), range: 100μM - 0.3 nM, R2 > 0.95 for all curves. B. Differential sensitivity of HNSCC cell lines to MK-1775. Eight and eleven-point dose response curves, mean +/− sem (N=3–4), range 100mM – 1nM, R2 > 0.86 for all curves. C. Bar graph of MK-1775 IC50 values for each of the nine cell lines. * denotes statistically significant differences in IC50 values between p53 wildtype vs. either p53 wildtype, HPV(+) or p53 mutant HNSCC cell lines, ANOVA with Holm-Sidak post-test,* P <0.05. D. Box plots of TP53 mutation status vs. IC50 values following treatment with the dual WEE1/CHK1 inhibitor 681640 based on data from the Genomics of Drug Sensitivity project. Left panel: comparison of TP53 wild type (n=8) and TP53 mutant (n=34) SCC cells. Right panel: comparison of TP53 wild type (n=177) and TP53 mutant (n=322) status across all cell lines excluding SCC lines, representing a diversity of tumor types.
As WEE1 regulates mitotic entry, this suggests p53 deficient cells are sensitive to deregulation of the G2/M transition. CHK1, a kinase required for the DNA damage induced G2/M checkpoint, and AURKA, a kinase involved in spindle assembly during mitosis, were also identified as putative survival kinases (Fig. 2). Consistent with the WEE1 inhibitor results, p53 deficient MSCC cells were also more sensitive to the CHK1 inhibitor, AZD7762 than p53 wild type cells (IC50 0.13 μM vs. 2.2 μM) (Fig. 4A).
Data from the Genomics of Drug Sensitivity project contains dose-response measurements on 820 genomically characterized cancer cell lines treated with 138 different compounds (26). One compound in this collection, labeled 681640, is a dual WEE1/CHK1 inhibitor (27). We used mutational profiling data from the Sanger Cancer Cell Line Project to classify cell lines based on p53 mutational status and tested for correlation with sensitivity to 681640 (28) (Table S21). Examination of the 42 cells that were derived from squamous cell carcinomas of the head and neck (20), oesophagus (11), lung (5), cervix (3), vulva (3), and skin (1), showed that, despite a broad range of sensitivities in both wild-type and mutant groups, on average p53 mutant SCC cells had increased sensitivity to 681640 compared to p53 wild type cells (median IC50: 5.34 μM vs. 29.23 μM, P=0.005) (Fig. 4D). However, the correlation between p53 status and sensitivity to 681640 was not observed in the overall collection of 499 cell lines, which excluded the 42 SCC cell lines and represents a broader variety of tumor types. In fact, the trend between p53 mutant status and 681640 sensitivity was reversed (median IC50: 12.83 μM vs. 7.75 μM P=1.348×10⁻⁵) (Fig. 4D). This analysis emphasizes the importance of validating candidate synthetic lethal interactions or drug sensitivities in specific tumor contexts and it indicates that other factors besides p53 mutational status affect sensitivity to 681640.
We next used flow cytometric cell cycle analysis to determine the basis for the enhanced sensitivity of p53 mutant SCC cells to WEE1 inhibition. Treatment of cells with MK-1775 led to unscheduled mitotic entry in p53 mutant but not wild type cells as measured by phospho-histone H3 (serine 10) (Fig. 5A). This was accompanied by an increase in subG1 DNA content, a loss of 4N DNA content, and activation of the apoptotic marker, caspase 3/7 (Fig. 5B, 5C). This indicates that WEE1 inhibition by MK-1775 in p53 mutant SCC cells caused unscheduled mitotic entry leading to mitotic catastrophe and apoptotic cell death.
Figure 5. MK-1775 induces mitotic entry, polyploidy, and apoptosis in HNSCC p53 mutant cells.
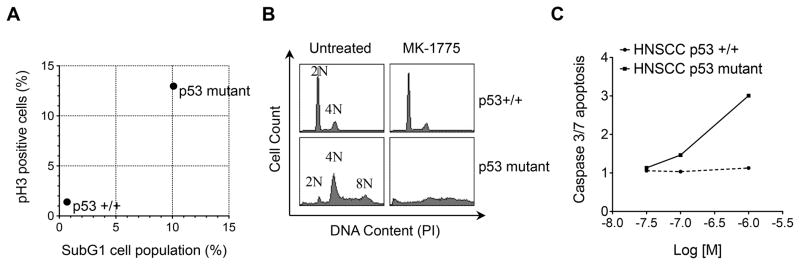
A. Flow cytometric analysis of HNSCC p53+/+ (UM-SCC17A) and p53 mutant (PCI-15B) cells showing % mitotic cells at 8 hours post MK-1775 treatment (y-axis) vs. % cell death at 24 hours (x-axis) normalized to untreated cells. B. Cell cycle profiles at 24 hours post MK-1775 treatment demonstrates abrogation of G2 (4N) cell population and generation of polyploidy in p53 mutant cells. C. Caspase 3/7-dependent apoptosis in HNSCC p53 +/+ and HNSCC p53 mutant cells over 48 hours at three different concentrations (30 nm, 100 nm, 1 μM) of MK-1775 (x-axis); fold change AUC ratio = AUC [MK-1775]/AUC [Vehicle] (y-axis).
To determine if WEE1 inhibition was effective against p53 mutant HNSCC in a preclinical tumor model, we performed a four arm double-blind study on PCI-15B xenograft bearing mice. Based upon our previous research PCI-15B demonstrates high metastatic potential as determined by cell migration and anchorage-independent growth assays, as well as the ability to metastasize to lymph node in an orthotopic mouse model of HNSCC (9). In addition, the PCI-15B line is also relatively resistant to cisplatin and radiation (data not shown). When tumors reached a palpable mass of >50 mm3, mice were randomized into four treatment arms and treated with vehicle, MK-1775, cisplatin, or cisplatin plus MK-1775. Cisplatin is the standard chemotherapeutic agent for HNSCC and cisplatin plus MK-1775 was used to determine if inhibition of WEE1 would synergize with DNA damaging therapy, as p53 mutant tumor cells would be expected to depend on G2/M arrest after DNA damaging treatment to repair DNA. Twice weekly oral gavage of MK-1775 inhibited growth of HNSCC tumors by 66% over the 4-week protocol as compared to vehicle (Fig. 6A, 6B, P=0.06). Cisplatin alone led to partial tumor regression, but also caused significant weight loss (Fig. S4). However, MK-1775 given 24 hours after cisplatin therapy further augmented tumor regression (60% reduction with cisplatin alone vs. 80% reduction with cisplatin plus MK-1775, P=0.003). Tumor lysates from MK-1775 treated mice probed with WEE1 and CDC2 antibodies showed reduced phosphorylation of WEE1 and its substrate CDC2 indicating that oral administration of MK-1775 effectively blocked WEE1 kinase activity in tumors (Fig. 6C, 6D).
Figure 6. WEE1 inhibitor MK-1775 potentiates the efficacy of cisplatin in established p53 mutant HNSCC xenografts.

A. Percentage growth of PCI-15B xenografts in mice treated with MK-1775 and/or cisplatin. Y-axis represents percentage change (mean +/− sem) in tumor volume over the course of a 4 week protocol for each group; n=7 per group; unpaired t-tests; control vs. MK1775, P=0.06; cisplatin vs. cisplatin plus MK1775, ** P=0.003. B. Bioluminescence images of a representative tumor-bearing mouse from each group at start (Day 1) and end of protocol (Day 28). C. Immunoblot of xenograft tumor lysates from two vehicle and two MK-1775 treated mice with specific antibodies to WEE1 kinase substrates: p-CDC2, CDC2, p-WEE1, WEE1, and β-actin loading control. D. Bar graph of relative protein levels of immunoblot for WEE1, p-WEE1, CDC2, p-CDC2, mean ± SD; normalized values for vehicle vs. MK1775 were compared via unpaired t-test, P<0.05 as significant; n=2; WEE1, ns; p-WEE1, *P=0.02 (one-tail); CDC2, ns; p-CDC2, *P =0.04 (one-tail).
Discussion
One of the most significant clinical challenges in the management of HNSCC patients is recurrent disease. In addition to being resistant to radio or chemotherapy, these tumors can present with distant metastases, leaving palliative care as the only option. Here we applied a functional kinomic approach to identify new candidate therapeutic targets for aggressive p53 mutant tumors. To prioritize targets we also screened isogenic murine SCC cells with germline mutations (Atm, DNA-PKcs, p19Arf, and Trp53) in the p53 pathway. The rationale for this cross-species analysis was to select for evolutionary conserved survival pathways/kinases, the inhibition of which was associated with cellular viability loss in both species and in p53 mutant cells. Retesting of these prioritized targets with independent siRNAs using both viability and apoptosis endpoints identified those that were effective in most or all cells tested, as well as those that were cell line or condition specific.
Comparing siRNA kinome screening results from cells derived from primary and recurrent/metastatic lesions revealed a high degree of concordance, implying that tumor cells isolated at different times or locations from the same patient share common vulnerabilities. In addition, recurrent/metastatic cell lines tended to be less responsive to kinase knockdown relative to cells from the primary lesion, suggesting development of resistance to target knockdown induced cell death. Altogether, these findings indicate this functional kinomic platform can reliably identify profiles of essential survival kinases specific to individual patients.
To further validate candidate therapeutic targets we tested several small molecule kinase inhibitors as a confirmatory step to support the RNAi results as well as to identify those inhibitors that might be effective for testing in vivo. Overall, this strategy identified the WEE1 kinase for further validation in vivo as RNAi mediated knockdown of WEE1 led to a significant reduction in cell viability and a concomitant increase in apoptosis in all nine HNSCC cell lines tested. Moreover, p53 deficient MSCC and HNSCC cells were highly sensitive to the specific WEE1 inhibitor MK-1775 relative to p53 WT cells, a finding that has been observed in other settings (29–31). Furthermore, the HPV+ p53 wildtype cell lines were more sensitive to MK-1775 than the p53 wildtype cell lines, consistent with the idea that functional loss of p53, either by the E6 viral component of HPV or by somatic mutation is associated with greater sensitivity to the WEE1 inhibitor, MK1775 (Fig. 4C). Mechanistically, WEE1 inhibition in p53 mutant cells, but not WT cells, led to unscheduled mitotic entry, mitotic catastrophe, and apoptosis, consistent with previous reports (24, 32). The G2 checkpoint kinase CHK1 was also a top candidate from our screen and p53 deficient SCC cells showed an increased sensitivity to both a CHK1 and a dual WEE1/CHK1 inhibitor. Collectively this suggests p53 deficient SCC cells may be particularly vulnerable to deregulation of the G2/M transition.
As preclinical validation, we demonstrated that oral administration of MK-1775 inhibited the growth of p53 mutant HNSCC xenografts and also cooperated with cisplatin to induce tumor regression. This xenograft protocol was designed and implemented after careful examination of previous preclinical studies utilizing genotoxic agents and/or MK-1775, and it was determined that the greatest responses to the WEE1 inhibitor MK-1775 would likely be obtained in p53 mutant HNSCC when given after genotoxic treatment (i.e., cisplatin) (29–31). Our comparably conservative MK-1775 dosing regimen of two times per week, 24 hours pre- and post-cisplatin treatment was performed in the context of limiting potential toxicities from cisplatin treatment. Given that this current regimen was well-tolerated as evidenced in Figure S4 (body weight of MK-1775-treated mice), it is quite possible that higher doses of the MK-1775 inhibitor would also be well-tolerated and high efficacy could be attained either as a single-agent or in combination with genotoxic treatment.
Currently, cisplatin chemotherapy for the treatment of HNSCC is given either in the neoadjuvantly or concurrently with radiation therapy. Unfortunately, the associated toxicities of combining cisplatin with other chemotherapeutic agents given neoadjuvantly, or the three potentially toxic cisplatin doses of 100mg/m2 administered during radiation treatment can limit the clinical applicability of these regimens. Thus, the degree by which MK-1775 enhances response to cisplatin would not only increase the effectiveness of existing therapy, but would open the possibility of reducing cisplatin dosing to minimize side-effects and broaden patient candidacy to these regimens.
MK-1775 has been shown to sensitize other p53 mutant tumors to DNA damaging agents (30, 31, 33). Molecular analysis of HNSCC tumor lysates showed reduced phosphorylation of the WEE1 substrate CDC2, indicating that MK-1775 inhibited its intended target. We previously found amplification of 11q13.1 in metastatic HNSCC tumor cells with corresponding over-expression of cyclin B, the activating subunit of CDC2 (34), which could exacerbate the sensitivity of HNSCC cells to WEE1 inhibition.
In addition to WEE1 and CHK1, siRNAs to other mitotic kinases including AURKA and NEK4 reduced viability and increased apoptosis in the majority of HNSCC cells including those derived from recurrent/metastatic lesions suggesting potential as therapeutic targets. AURKA and CHK1 are being pursued as drug targets (35–37), while NEK4 a member of the NIMA family of kinases modulates sensitivity to microtubule poisons and DNA damage (38–40).
siRNAs to several Src family kinases (SFKs) or related signaling proteins (FYN, TXK, CAM2KB) also reduced viability in one or more HNSCC cell lines and were prioritized as candidates in the cross species comparisons. FYN is a SFK that is involved in many pro-oncogenic process such as cell proliferation, integrin-mediated and PI3K signaling, while TXK is a tyrosine kinase that is activated by the SRC family kinase LYN (41–43). SFKs are activated by mitogenic signals to induce HNSCC cell proliferation and LYN mediates cell motility and tumor growth in head and neck cancer (44, 45). Furthermore, SRC/FAK signaling correlates strongly with phenotypes associated with tumor progression such as invasion and metastasis (46, 47) and FAK itself is amplified in HNSCC (48), providing further support for targeting the SFK pathway in more aggressive subtypes of HNSCC (49, 50).
In summary, our cross-species functional kinomic approach using autologous pairs of primary and recurrent/metastatic p53 mutant HNSCC lines, coupled with isogenic mouse SCC cells with defined mutations along the p53 pathway has identified several survival kinases as candidate therapeutic targets for aggressive HNSCC. These kinases regulate a range of cellular processes such as phosphatidylinositol, focal adhesion, and Src signaling pathways, and the G2/M cell cycle transition, suggesting functional targets for therapeutic intervention. Discovery and development of multiple targets may prove to be a useful strategy, as tumors frequently develop resistance to single agents and targeting multiple vulnerabilities simultaneously may be a required to achieve long term remission.
Our preclinical data on WEE1 illustrates not only the vulnerabilities of p53 mutant HNSCC cells to deregulation of G2/M transition, but also supports the initiation of clinical trials with MK-1775 or other G2/M checkpoint inhibitors for HNSCC, particularly in combination with cisplatin. More generally, this study illustrates the utility of integrating functional genomic approaches with more traditional descriptive genomic and molecular profiles to identify therapeutic targets in cancer.
Supplementary Material
Clinical Cancer Research Statement of Translational Relevance.
In this study, we address the unmet need to find novel therapies for p53 mutant head and neck squamous cell carcinoma (HNSCC). We employed a functional kinomics approach and human-murine interspecies comparison of high-throughput siRNA viability screens to identify conserved survival pathways in squamous cell carcinoma. The rationale for targeting kinases in cancer is significant, and as such we focused on the kinome to identify druggable and clinically relevant survival kinases in HNSCC. Our findings reveal vulnerabilities of p53 mutant HNSCC cells to inhibition of G2/M, SFK, PI3K and FAK pathways. For proof of concept and mechanism, we performed preclinical validation studies on one of our top kinase targets, WEE1. Our preclinical data demonstrate the vulnerability of p53 mutant HNSCC cells to deregulation of G2/M transition, and support initiation of clinical trials with MK-1775 or other G2/M checkpoint inhibitors for HNSCC, particularly in combination with cisplatin.
Acknowledgments
We would like to acknowledge Natalia Isaeva for her technical support with MK-1775 dose response experiments.
Grant Support: This work was supported by two FHCRC/UW Cancer Consortium Pilot Grants from the National Institutes of Health (P30CA015704); the National Center for Research Resources (5KL2RR025015); the Howard Hughes Medical Institute Early Physician-Scientist Career Development Award; Grant RSG TBG-123653 from the American Cancer Society; the Mouse Models of Human Cancer Consortium (U01 CA141550); the National Institute of Environmental Health Science (ES020116); the Integrated Cancer Biology Program (54CA149237); National Cancer Institute Grant (U01 CA176303); and center funds from the Department of Otolaryngology: Head and Neck Surgery at the University of Washington and VA Puget Sound Health Care System
Footnotes
Disclosure of potential conflicts of interest: The authors declare no potential conflicts of interest.
Author contributions: RM, CX conceived, designed, and performed experiments and data analysis, and wrote the manuscript, MK, JA, LA, CMS, KEG, AB designed and performed experiments, ISJ and AM, performed public database analysis, WGY, CG, CJK, and EM conceived and designed experiments, performed data analysis and wrote manuscript.
Data and materials availability: Cell lines used in this study may be obtained with appropriate Material Transfer Agreement.
References
- 1.Bernier J, Domenge C, Ozsahin M, Matuszewska K, Lefebvre JL, Greiner RH, et al. Postoperative irradiation with or without concomitant chemotherapy for locally advanced head and neck cancer. N Engl J Med. 2004;350:1945–52. doi: 10.1056/NEJMoa032641. [DOI] [PubMed] [Google Scholar]
- 2.Machtay M, Moughan J, Trotti A, Garden AS, Weber RS, Cooper JS, et al. Factors associated with severe late toxicity after concurrent chemoradiation for locally advanced head and neck cancer: an RTOG analysis. J Clin Oncol. 2008;26:3582–9. doi: 10.1200/JCO.2007.14.8841. [DOI] [PMC free article] [PubMed] [Google Scholar]
- 3.Bonner JA, Harari PM, Giralt J, Azarnia N, Shin DM, Cohen RB, et al. Radiotherapy plus cetuximab for squamous-cell carcinoma of the head and neck. N Engl J Med. 2006;354:567–78. doi: 10.1056/NEJMoa053422. [DOI] [PubMed] [Google Scholar]
- 4.Gasco M, Crook T. The p53 network in head and neck cancer. Oral Oncol. 2003;39:222–31. doi: 10.1016/s1368-8375(02)00163-x. [DOI] [PubMed] [Google Scholar]
- 5.Hauser U, Balz V, Carey TE, Grenman R, Van Lierop A, Scheckenbach K, et al. Reliable detection of p53 aberrations in squamous cell carcinomas of the head and neck requires transcript analysis of the entire coding region. Head & neck. 2002;24:868–73. doi: 10.1002/hed.10128. [DOI] [PubMed] [Google Scholar]
- 6.Muller PA, Vousden KH, Norman JC. p53 and its mutants in tumor cell migration and invasion. J Cell Biol. 2011;192:209–18. doi: 10.1083/jcb.201009059. [DOI] [PMC free article] [PubMed] [Google Scholar]
- 7.Poeta ML, Manola J, Goldwasser MA, Forastiere A, Benoit N, Califano JA, et al. TP53 mutations and survival in squamous-cell carcinoma of the head and neck. N Engl J Med. 2007;357:2552–61. doi: 10.1056/NEJMoa073770. [DOI] [PMC free article] [PubMed] [Google Scholar]
- 8.Skinner HD, Sandulache VC, Ow TJ, Meyn RE, Yordy JS, Beadle BM, et al. TP53 disruptive mutations lead to head and neck cancer treatment failure through inhibition of radiation-induced senescence. Clinical cancer research : an official journal of the American Association for Cancer Research. 2012;18:290–300. doi: 10.1158/1078-0432.CCR-11-2260. [DOI] [PMC free article] [PubMed] [Google Scholar]
- 9.Xu C, Wang P, Liu Y, Zhang Y, Fan W, Upton MP, et al. Integrative genomics in combination with RNA interference identifies prognostic and functionally relevant gene targets for oral squamous cell carcinoma. PLoS genetics. 2013;9:e1003169. doi: 10.1371/journal.pgen.1003169. [DOI] [PMC free article] [PubMed] [Google Scholar]
- 10.Bailey SL, Gurley KE, Hoon-Kim K, Kelly-Spratt KS, Kemp CJ. Tumor suppression by p53 in the absence of Atm. Mol Cancer Res. 2008;6:1185–92. doi: 10.1158/1541-7786.MCR-07-2009. [DOI] [PMC free article] [PubMed] [Google Scholar]
- 11.Kelly-Spratt KS, Gurley KE, Yasui Y, Kemp CJ. p19Arf suppresses growth, progression, and metastasis of Hras-driven carcinomas through p53-dependent and -independent pathways. PLoS Biol. 2004;2:E242. doi: 10.1371/journal.pbio.0020242. [DOI] [PMC free article] [PubMed] [Google Scholar]
- 12.Kemp CJ, Donehower LA, Bradley A, Balmain A. Reduction of p53 gene dosage does not increase initiation or promotion but enhances malignant progression of chemically induced skin tumors. Cell. 1993;74:813–22. doi: 10.1016/0092-8674(93)90461-x. [DOI] [PubMed] [Google Scholar]
- 13.Kemp CJ, Vo K, Gurley KE. Resistance to skin tumorigenesis in DNAPK-deficient SCID mice is not due to immunodeficiency but results from hypersensitivity to TPA-induced apoptosis. Carcinogenesis. 1999;20:2051–6. doi: 10.1093/carcin/20.11.2051. [DOI] [PubMed] [Google Scholar]
- 14.Zhao M, Sano D, Pickering CR, Jasser SA, Henderson YC, Clayman GL, et al. Assembly and initial characterization of a panel of 85 genomically validated cell lines from diverse head and neck tumor sites. Clinical cancer research : an official journal of the American Association for Cancer Research. 2011;17:7248–64. doi: 10.1158/1078-0432.CCR-11-0690. [DOI] [PMC free article] [PubMed] [Google Scholar]
- 15.Ise K, Nakamura K, Nakao K, Shimizu S, Harada H, Ichise T, et al. Targeted deletion of the H-ras gene decreases tumor formation in mouse skin carcinogenesis. Oncogene. 2000;19:2951–6. doi: 10.1038/sj.onc.1203600. [DOI] [PubMed] [Google Scholar]
- 16.Kemp CJ. Multistep skin cancer in mice as a model to study the evolution of cancer cells. Semin Cancer Biol. 2005;15:460–73. doi: 10.1016/j.semcancer.2005.06.003. [DOI] [PubMed] [Google Scholar]
- 17.Ku TK, Nguyen DC, Karaman M, Gill P, Hacia JG, Crowe DL. Loss of p53 expression correlates with metastatic phenotype and transcriptional profile in a new mouse model of head and neck cancer. Mol Cancer Res. 2007;5:351–62. doi: 10.1158/1541-7786.MCR-06-0238. [DOI] [PubMed] [Google Scholar]
- 18.Ruddell A, Kelly-Spratt KS, Furuya M, Parghi SS, Kemp CJ. p19/Arf and p53 suppress sentinel lymph node lymphangiogenesis and carcinoma metastasis. Oncogene. 2008;27:3145–55. doi: 10.1038/sj.onc.1210973. [DOI] [PubMed] [Google Scholar]
- 19.Wang YV, Leblanc M, Wade M, Jochemsen AG, Wahl GM. Increased radioresistance and accelerated B cell lymphomas in mice with Mdmx mutations that prevent modifications by DNA-damage-activated kinases. Cancer Cell. 2009;16:33–43. doi: 10.1016/j.ccr.2009.05.008. [DOI] [PMC free article] [PubMed] [Google Scholar]
- 20.Kiyono T, Foster SA, Koop JI, McDougall JK, Galloway DA, Klingelhutz AJ. Both Rb/p16INK4a inactivation and telomerase activity are required to immortalize human epithelial cells. Nature. 1998;396:84–8. doi: 10.1038/23962. [DOI] [PubMed] [Google Scholar]
- 21.Toyoshima M, Howie HL, Imakura M, Walsh RM, Annis JE, Chang AN, et al. Functional genomics identifies therapeutic targets for MYC-driven cancer. Proceedings of the National Academy of Sciences of the United States of America. 2012;109:9545–50. doi: 10.1073/pnas.1121119109. [DOI] [PMC free article] [PubMed] [Google Scholar]
- 22.Zhang JH, Chung TD, Oldenburg KR. A Simple Statistical Parameter for Use in Evaluation and Validation of High Throughput Screening Assays. J Biomol Screen. 1999;4:67–73. doi: 10.1177/108705719900400206. [DOI] [PubMed] [Google Scholar]
- 23.Birmingham A, Selfors LM, Forster T, Wrobel D, Kennedy CJ, Shanks E, et al. Statistical methods for analysis of high-throughput RNA interference screens. Nat Methods. 2009;6:569–75. doi: 10.1038/nmeth.1351. [DOI] [PMC free article] [PubMed] [Google Scholar]
- 24.Aarts M, Sharpe R, Garcia-Murillas I, Gevensleben H, Hurd MS, Shumway SD, et al. Forced mitotic entry of S-phase cells as a therapeutic strategy induced by inhibition of WEE1. Cancer Discov. 2012;2:524–39. doi: 10.1158/2159-8290.CD-11-0320. [DOI] [PubMed] [Google Scholar]
- 25.Jackson AL, Bartz SR, Schelter J, Kobayashi SV, Burchard J, Mao M, et al. Expression profiling reveals off-target gene regulation by RNAi. Nature biotechnology. 2003;21:635–7. doi: 10.1038/nbt831. [DOI] [PubMed] [Google Scholar]
- 26.Garnett MJ, Edelman EJ, Heidorn SJ, Greenman CD, Dastur A, Lau KW, et al. Systematic identification of genomic markers of drug sensitivity in cancer cells. Nature. 2012;483:570–5. doi: 10.1038/nature11005. [DOI] [PMC free article] [PubMed] [Google Scholar]
- 27.Palmer BD, Thompson AM, Booth RJ, Dobrusin EM, Kraker AJ, Lee HH, et al. 4-Phenylpyrrolo[3,4-c]carbazole-1,3(2H,6H)-dione inhibitors of the checkpoint kinase Wee1. Structure-activity relationships for chromophore modification and phenyl ring substitution. Journal of medicinal chemistry. 2006;49:4896–911. doi: 10.1021/jm0512591. [DOI] [PubMed] [Google Scholar]
- 28.Forbes SA, Bindal N, Bamford S, Cole C, Kok CY, Beare D, et al. COSMIC: mining complete cancer genomes in the Catalogue of Somatic Mutations in Cancer. Nucleic acids research. 2011;39:D945–50. doi: 10.1093/nar/gkq929. [DOI] [PMC free article] [PubMed] [Google Scholar]
- 29.Hirai H, Iwasawa Y, Okada M, Arai T, Nishibata T, Kobayashi M, et al. Small-molecule inhibition of Wee1 kinase by MK-1775 selectively sensitizes p53-deficient tumor cells to DNA-damaging agents. Molecular cancer therapeutics. 2009;8:2992–3000. doi: 10.1158/1535-7163.MCT-09-0463. [DOI] [PubMed] [Google Scholar]
- 30.Bridges KA, Hirai H, Buser CA, Brooks C, Liu H, Buchholz TA, et al. MK-1775, a novel Wee1 kinase inhibitor, radiosensitizes p53-defective human tumor cells. Clinical cancer research : an official journal of the American Association for Cancer Research. 2011;17:5638–48. doi: 10.1158/1078-0432.CCR-11-0650. [DOI] [PMC free article] [PubMed] [Google Scholar]
- 31.Rajeshkumar NV, De Oliveira E, Ottenhof N, Watters J, Brooks D, Demuth T, et al. MK-1775, a potent Wee1 inhibitor, synergizes with gemcitabine to achieve tumor regressions, selectively in p53-deficient pancreatic cancer xenografts. Clinical cancer research : an official journal of the American Association for Cancer Research. 2011;17:2799–806. doi: 10.1158/1078-0432.CCR-10-2580. [DOI] [PMC free article] [PubMed] [Google Scholar]
- 32.De Witt Hamer PC, Mir SE, Noske D, Van Noorden CJ, Wurdinger T. WEE1 kinase targeting combined with DNA-damaging cancer therapy catalyzes mitotic catastrophe. Clinical cancer research : an official journal of the American Association for Cancer Research. 2011;17:4200–7. doi: 10.1158/1078-0432.CCR-10-2537. [DOI] [PubMed] [Google Scholar]
- 33.Hirai H, Arai T, Okada M, Nishibata T, Kobayashi M, Sakai N, et al. MK-1775, a small molecule Wee1 inhibitor, enhances anti-tumor efficacy of various DNA-damaging agents, including 5-fluorouracil. Cancer biology & therapy. 2010;9:514–22. doi: 10.4161/cbt.9.7.11115. [DOI] [PubMed] [Google Scholar]
- 34.Xu C, Liu Y, Wang P, Fan W, Rue TC, Upton MP, et al. Integrative analysis of DNA copy number and gene expression in metastatic oral squamous cell carcinoma identifies genes associated with poor survival. Mol Cancer. 2010;9:143. doi: 10.1186/1476-4598-9-143. [DOI] [PMC free article] [PubMed] [Google Scholar]
- 35.Dar AA, Goff LW, Majid S, Berlin J, El-Rifai W. Aurora kinase inhibitors--rising stars in cancer therapeutics? Molecular cancer therapeutics. 2010;9:268–78. doi: 10.1158/1535-7163.MCT-09-0765. [DOI] [PMC free article] [PubMed] [Google Scholar]
- 36.Katayama H, Sen S. Aurora kinase inhibitors as anticancer molecules. Biochimica et biophysica acta. 2010;1799:829–39. doi: 10.1016/j.bbagrm.2010.09.004. [DOI] [PMC free article] [PubMed] [Google Scholar]
- 37.Ma CX, Janetka JW, Piwnica-Worms H. Death by releasing the breaks: CHK1 inhibitors as cancer therapeutics. Trends in molecular medicine. 2011;17:88–96. doi: 10.1016/j.molmed.2010.10.009. [DOI] [PMC free article] [PubMed] [Google Scholar]
- 38.Doles J, Hemann MT. Nek4 status differentially alters sensitivity to distinct microtubule poisons. Cancer research. 2010;70:1033–41. doi: 10.1158/0008-5472.CAN-09-2113. [DOI] [PMC free article] [PubMed] [Google Scholar]
- 39.Moniz L, Dutt P, Haider N, Stambolic V. Nek family of kinases in cell cycle, checkpoint control and cancer. Cell Div. 2011;6:18. doi: 10.1186/1747-1028-6-18. [DOI] [PMC free article] [PubMed] [Google Scholar]
- 40.Nguyen CL, Possemato R, Bauerlein EL, Xie A, Scully R, Hahn WC. Nek4 regulates entry into replicative senescence and the response to DNA damage in human fibroblasts. Molecular and cellular biology. 2012;32:3963–77. doi: 10.1128/MCB.00436-12. [DOI] [PMC free article] [PubMed] [Google Scholar]
- 41.Xi S, Zhang Q, Dyer KF, Lerner EC, Smithgall TE, Gooding WE, et al. Src kinases mediate STAT growth pathways in squamous cell carcinoma of the head and neck. The Journal of biological chemistry. 2003;278:31574–83. doi: 10.1074/jbc.M303499200. [DOI] [PubMed] [Google Scholar]
- 42.Debnath J, Chamorro M, Czar MJ, Schaeffer EM, Lenardo MJ, Varmus HE, et al. rlk/TXK encodes two forms of a novel cysteine string tyrosine kinase activated by Src family kinases. Molecular and cellular biology. 1999;19:1498–507. doi: 10.1128/mcb.19.2.1498. [DOI] [PMC free article] [PubMed] [Google Scholar]
- 43.Mano H, Yamashita Y, Miyazato A, Miura Y, Ozawa K. Tec protein-tyrosine kinase is an effector molecule of Lyn protein-tyrosine kinase. FASEB J. 1996;10:637–42. doi: 10.1096/fasebj.10.5.8621063. [DOI] [PubMed] [Google Scholar]
- 44.Wheeler SE, Morariu EM, Bednash JS, Otte CG, Seethala RR, Chiosea SI, et al. Lyn kinase mediates cell motility and tumor growth in EGFRvIII-expressing head and neck cancer. Clinical cancer research : an official journal of the American Association for Cancer Research. 2012;18:2850–60. doi: 10.1158/1078-0432.CCR-11-2486. [DOI] [PMC free article] [PubMed] [Google Scholar]
- 45.Zhang Q, Thomas SM, Xi S, Smithgall TE, Siegfried JM, Kamens J, et al. SRC family kinases mediate epidermal growth factor receptor ligand cleavage, proliferation, and invasion of head and neck cancer cells. Cancer research. 2004;64:6166–73. doi: 10.1158/0008-5472.CAN-04-0504. [DOI] [PubMed] [Google Scholar]
- 46.Matsumoto T, Jiang J, Kiguchi K, Ruffino L, Carbajal S, Beltran L, et al. Targeted expression of c-Src in epidermal basal cells leads to enhanced skin tumor promotion, malignant progression, and metastasis. Cancer research. 2003;63:4819–28. [PubMed] [Google Scholar]
- 47.McLean GW, Carragher NO, Avizienyte E, Evans J, Brunton VG, Frame MC. The role of focal-adhesion kinase in cancer - a new therapeutic opportunity. Nature reviews Cancer. 2005;5:505–15. doi: 10.1038/nrc1647. [DOI] [PubMed] [Google Scholar]
- 48.Agochiya M, Brunton VG, Owens DW, Parkinson EK, Paraskeva C, Keith WN, et al. Increased dosage and amplification of the focal adhesion kinase gene in human cancer cells. Oncogene. 1999;18:5646–53. doi: 10.1038/sj.onc.1202957. [DOI] [PubMed] [Google Scholar]
- 49.Egloff AM, Grandis JR. Targeting epidermal growth factor receptor and SRC pathways in head and neck cancer. Semin Oncol. 2008;35:286–97. doi: 10.1053/j.seminoncol.2008.03.008. [DOI] [PMC free article] [PubMed] [Google Scholar]
- 50.Stabile LP, He G, Lui VW, Henry C, Gubish CT, Joyce S, et al. c-Src Activation Mediates Erlotinib Resistance in Head and Neck Cancer by Stimulating c-Met. Clinical cancer research : an official journal of the American Association for Cancer Research. 2013;19:380–92. doi: 10.1158/1078-0432.CCR-12-1555. [DOI] [PMC free article] [PubMed] [Google Scholar]
Associated Data
This section collects any data citations, data availability statements, or supplementary materials included in this article.