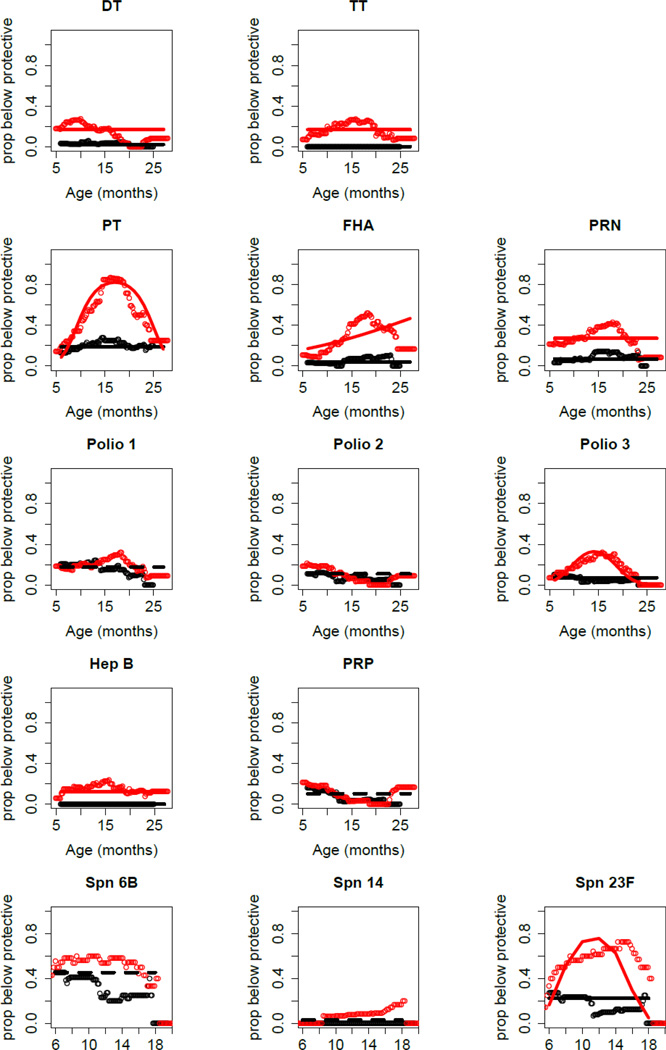
Figure 1. Proportion of age-matched sOP children (n=34; red color) and non-sOP children (n=34; black color) with antibody protective levels plotted against age of the child.
sOP children more frequently had nonprotective levels of antibody but no time gradient for DT, TT, PRN and HepB. The sOP children more frequently had nonprotective levels of antibody for PT, FHA, Polio 3 and Spn 23F, but the group effect varied with age. sOP and non-sOP children responded similarly to Polio 1, Polio 2, PRP, Spn 6B and Spn 14. Solid lines: Generalized estimating equations (GEEs) were used to fit the statistical models as previously described[21].

