

Abstract
The family of agn alleles in Escherichia coli pathovars encodes autotransporters that have been implicated in biofilm formation, autoaggregation, and attachment to cells. The alleles all have long leader RNAs preceding the Ag43 translation initiation codon. Here we present an analysis of the agn43 leader RNA from E. coli K-12. We demonstrate the presence of a rho-independent transcription terminator just 28 bp upstream of the main translation start codon and show that it is functional in vitro. Our data indicate that an as-yet-unknown mechanism of antitermination of transcription must be operative in earlier phases of growth. However, as bacterial cell cultures mature, progressively fewer transcripts are able to bypass this terminator. In the K-12 leader sequence, two in-frame translation initiation codons have been identified, one upstream and the other downstream of the transcription terminator. For optimal agn43 expression, both codons need to be present. Translation from the upstream start codon leads to increased downstream agn43 expression. Our findings have revealed two novel modes of regulation of agn43 expression in the leader RNA in addition to the previously well-characterized regulation of phase variation at the agn43 promoter.
INTRODUCTION
Escherichia coli and other bacteria can attach themselves to surfaces and develop dense communities called biofilms. They constitute a major clinical problem, as they can form in the bladder (1) as well as in indwelling Foley catheters, which may then become clogged (2). The E. coli autotransporter Ag43 (3) is an abundant antigenic (4) outer membrane protein. Ag43 is encoded by the agn43 gene, originally identified as the flu locus. Ag43 promotes E. coli aggregation, biofilm formation, and microcolony formation on epithelial cells, but it is not involved in the invasion of mammalian epithelial cells or mammalian cell colonization (5). High-level expression of Ag43 was seen in young biofilms (6) but not in mature biofilms (7). Consistent with the observed lack of Ag43 in mature biofilms, Ag43 was found to not be required for biofilm maturation (8).
The distribution of Ag43 expression among the cells of a clonal population is known to be controlled by phase variation; i.e., Ag43 expression is stochastically either ON or OFF. Phase variation of Ag43 is regulated at the level of transcription initiation by the maintenance methylase deoxyadenosine DNA methyltransferase (Dam) and the oxidative stress regulator OxyR (3, 9–12). OxyR is a repressor of agn43 expression, and its binding to the agn43 regulatory (promoter) region results in repression of transcription (the OFF phase). A key aspect of this phase variation system is that OxyR binding is abrogated when three Dam target sequences in its binding sites are methylated (resulting in the ON phase). Once OxyR is bound, Dam cannot access these target sequences, leading to preferred inheritance of the OFF phase. Phase variation therefore is the outcome of competition between OxyR and Dam for the agn43 regulatory region. The switching frequency between the ON and OFF phases can in some cases be influenced by environmental signals (13). However, to date, no environmental factors or trans-acting regulatory factors that affect Ag43 phase variation nor any that significantly affect the level of expression in ON cells have been identified (3). Surprisingly, even the oxidation state of OxyR does not affect its role as a repressor of agn43 (11, 14).
Alignment of the promoters of the agn43 regulatory regions shows minor sequence variation among various E. coli strains, but the essential elements for phase variation are highly conserved (3). Previously reported analyses of the coding regions indicated that there are two distinct families of the protein (3). Furthermore, all agn43 coding sequences of E. coli strains have been found to be preceded by long leader regions (about 222 to 250 nucleotides [nt], depending on the allele [3]), whose predicted secondary structures reveal the presence of stem-loop structures similar to those of rho-independent transcription terminators (15). However, despite the presence of such putative transcription terminators, the Ag43 protein is abundantly expressed in E. coli (16). Here we examine the role of the leader sequence in the regulation of E. coli K-12 agn43 gene (abbreviated agnK12) expression and show that this region contributes to the regulation of expression in addition to the control of transcription initiation by phase variation. Thus, our results also serve to enhance an understanding of the parameters guiding biofilm formation by E. coli.
MATERIALS AND METHODS
Growth conditions and strains.
Luria-Bertani (LB) broth, LB agar, and M9 medium and agar were prepared as described previously (17, 18). Glycerol was added as a carbon source to M9 medium at 0.2% (vol/vol), unless mentioned otherwise. 5-Bromo-4-chloro-3-indolyl-β-d-galactoside (X-gal) was added as required. Antibiotics were added to media at the following concentrations: kanamycin at 30 μg/ml and ampicillin at 100 μg/ml. The strains and plasmids used in this study are listed in Tables 1 and 2. Here, reference to specific nucleotides is made relative to the transcription start site (+1) of agnK12 (11) (b2000 in the MG1655 sequence) (19).
TABLE 1.
E. coli strain MC4100 derivates used to determine gene expression with β-galactosidase as a reportera
| Strain | Region (nt) of agnK12 in agnK12′-lacZ λRS lysogen | Reference |
|---|---|---|
| Transcriptional fusions | ||
| MV203 | −466–+275 | 9 |
| MV312 | −40–+275 | 11 |
| MV505 | −466–+62 | 11 |
| MV557 | −40–+62 | 11 |
| MV631 | −40–+275, Δ+63–+160 | This study |
| MV654 | −466–+88 | This study |
| MV747 | −466–+275, +67A→+67C resulting in CTG | This study |
| MV781 | −466–+275, Δ+161–+195 | This study |
| MV812 | −466–+275, Δ+161–+195, +67A→+67C | This study |
| MV846 | −466–+275, +223A→+223C, resulting in CTG | This study |
| MV897 | −466–+88, +67A→+67C, resulting in CTG | This study |
| MV915 | −466–+275, +78C→+78A resulting in TAA | This study |
| MV928 | −466–+275, +67A→+67C, +223A→+223C | This study |
| MV977 | −466–+275, +162 GCCGGT +167→+162 CGGCCA +167, +185 ACCGGC +190→+185 TGGCCG +190 | This study |
| Translational fusions | ||
| MV689 | −466–+125 | This study |
| MV690 | −466–+275 | This study |
| MV721 | −466–+275, +67A→+67C resulting in CTG-1 | This study |
| MV749 | −466–+275, Δ+79–+117, in-frame deletion of 13 amino acids | This study |
| MV751 | −466–+275, Δ+79–+116, out-of-frame deletion of 13 amino acids | This study |
| MV766 | −466–+275, Δ+79–+147, in-frame deletion of 23 amino acids | This study |
All strains contain the Dam-encoding plasmid pTP166, and therefore, expression of agnK12 is locked in the ON phase (11).
TABLE 2.
E. coli strains used for qRT-PCR experiments
| Strain | Region of agn43 cloned into pBR322 | Source or reference |
|---|---|---|
| W3110 | None | K-12 strain |
| HO1 | −48–+214 | This study |
| HO2 | −48–+175 (deletion of the 3′ half of the terminator stem) | This study |
Genetic techniques and methodology.
Standard genetic manipulations and techniques were performed as described previously (17, 20). Sequencing was carried out by the Genetics Core Facility at the University of Pennsylvania or by Geospiza, a division of PerkinElmer. The agnK12′-lacZ transcriptional and translational fusions were constructed by cloning relevant PCR-derived BamHI-EcoRI fragments into pRS550 and pRS552 (21). Lysogens of recombinant λ containing the agnK12′-lacZ fusions were isolated as described previously (21). To facilitate assessment of regulation in an ON cell, all the agnK12′-lacZ single-copy lysogens were transformed with the Dam-overproducing plasmid pTP166 to abrogate OxyR binding to the agnK12 regulatory region and thus suppress conversion to the OFF phase (9, 22).
Point mutations and deletions were introduced into the agnK12 leader region by using crossover PCR (23) or by using a Thermo Scientific Phusion site-directed mutagenesis kit, according to the manufacturer's instructions. The presence of desired mutations in the agnK12 sequence was confirmed by sequencing. Single-copy transcriptional and translational fusions of the mutagenized BamHI-EcoRI fragments to lacZ were made as described above. Strains HO1 and HO2 (Table 2) were derived from a stretch of agn43 (positions −48 to +214) that was amplified from pMV103 and cloned into pBR322.
Assay of β-galactosidase activity.
The β-galactosidase activity of the cultures grown in M9 medium with glycerol to an optical density at 600 nm (OD600) of between 0.3 and 0.6 was determined as described previously (20). The assay was performed on at least two independent cultures of each isolate, and each sample was measured in triplicate.
In vitro transcription assay.
A 664-bp fragment of agnK12 DNA from positions −466 to +198 was PCR amplified with primers containing EcoRI and HindIII restriction sites at the 5′ end of the forward and reverse primers, respectively. The product was cloned into pRLG770 (24), resulting in plasmid pMV201. Multiple rounds of in vitro transcription reactions were performed with methylated pMV201 as a template (11). Transcription products were purified and analyzed on a 5% polyacrylamide sequencing gel. A DNA sequencing ladder was used as a size standard for estimating the lengths of the transcribed products. DNA oligomers used to investigate possible in vitro antitermination in trans were “oligonucleotide 1” (see Table SA1 in the supplemental material for oligonucleotide sequences), which hybridizes the agnK12 stem from positions +161 to +173, and “oligonucleotide 2,” which hybridizes at positions +44 to +56 of the agnK12 leader region.
RNA isolation and stability assay by real-time quantitative PCR.
For RNA stability experiments, strains MV203 and MV747 were grown in M9 medium to an OD600 of 0.5. After the addition of rifampin to 30 μg/ml, samples were taken between 1 and 10 min. Total RNA was recovered from the strains containing different agnK12′-lacZ fusions by using an RNA isolation kit from Epicentre. RNA was quantified by measuring the absorbance at 260 nm, and 1 μg was used as a template for making cDNA by using Superscript II reverse transcriptase (Invitrogen) and the forward and reverse “stab” primers shown in Table SA1 in the supplemental material. The relative levels of the 500-bp 5′ lacZ cDNA in each sample were determined by real-time PCR using SYBR green as a fluorescent probe and the same two primers described above with an Applied Biosystems Prism 7700 cycler (25). A standard curve was made by using PCR-derived lacZ DNA.
Transcription termination assay by qRT-PCR.
E. coli W3110 cultures were grown in LB broth at 28°C (a combination of strain and temperature known to favor biofilm formation [Franziska Mika, personal communication]) to various OD600 values, as indicated. The cultures were chilled on ice and then centrifuged at 6,000 × g for 10 min at 4°C. The cell pellets were frozen at −80°C until RNA extraction. After lysozyme treatment, total RNA was extracted by using the RNeasy kit (Qiagen) and treated with RNase-free DNase I. cDNA synthesis and real-time quantitative PCR (qRT-PCR) were carried out as indicated above but with the primers described below. An Applied Biosystems StepOne real-time PCR instrument was used for both cDNA synthesis and qRT-PCR. For the qRT-PCRs, SYBR green PCR master mix was used.
qRT-PCR with W3110.
Two cDNAs were generated from the purified total RNA: “Upstream” was generated by reverse transcription with primer RP1-8311, and “Downstream1” was generated by reverse transcription with primer RP2-10412 (see Table SA1 in the supplemental material). The qRT-PCR analysis was carried out by using primers FP1-92512 and RP1-8311 (see Table SA1 in the supplemental material) with Upstream cDNA for amplification of a 64-bp region (positions +70 to +133) upstream of the agnK12 putative terminator. Primers FP2-10412 and RP2-10412 (see Table SA1 in the supplemental material) were used with Downstream cDNA to amplify 60 bp of the agnK12 gene of W3110 downstream of the putative terminator (at positions +416 to +475).
qRT-PCR with constructs cloned into pBR322.
Two cDNAs were synthesized from the purified RNA: Upstream, again by reverse transcription with primer RP1-8311, and “Downstream2,” now using primer RP2-42213 (see Table SA1 in the supplemental material). Upstream qRT-PCR across agn43 sequences was again performed with primers FP1-92512 and RP1-8311 (see Table SA1 in the supplemental material) with Upstream cDNA to amplify 64 bp, as described above. However, downstream qRT-PCR across pBR322 sequences was performed by using primers FP2-42213 and RP2-42213 (see Table SA1 in the supplemental material) with Downstream2 cDNA, to amplify 85 bp.
The first “cycle” of each qRT-PCR was 96°C for 1 min, followed by 30 cycles of 96°C for 30 s (step 1), 58°C for 30 s (step 2), and 72°C for 35 s (step 3). Finally, a melt curve was obtained for the amplified DNA, showing one species for each qRT-PCR using the templates and primers described above. The amplified DNAs were also analyzed on a nondenaturing agarose gel. The relative amounts shown on the gel were in qualitative agreement with the results from qRT-PCR (data not shown). In working up the data for the growth phase dependence of terminator bypass, the differences between the determined threshold cycle (CT) values for RNAs upstream and those downstream of the putative terminator were calculated for each reaction and converted into a ratio of amounts of RNA upstream to amounts of RNA downstream. The results were normalized to a ratio of 1 for the data obtained for the culture with an OD600 of 0.3, and the data for cultures with higher OD600 values, with ratios of <1, are plotted as “relative antitermination” (see Fig. 4). A similar procedure was performed when the leader RNA was cloned into pBR322, except that the data were normalized to the data obtained at a culture OD600 of 0.6 for the leader of HO2, which has a deletion in the terminator stem-loop.
FIG 4.
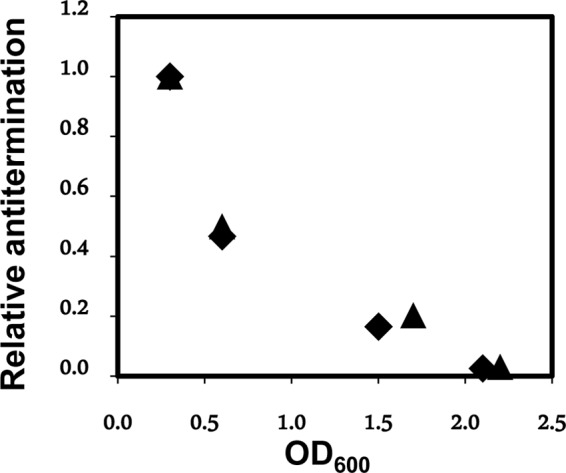
Antitermination is regulated. The relative antitermination in the leader RNA (normalized to 1 for the value obtained at an OD600 of 0.3) of strain W3110 chromosomal agnK12 is plotted as a function of the OD600 for a culture growing at 28°C. Results of two independent experiments (▲ and ■) are shown.
RESULTS
The leader region of the agnK12 mRNA contains a putative transcription terminator and an ORF.
The putative translation initiation site of the Ag43 protein is preceded by a long leader region from position +1 (the transcription start site) to position +222, abutting the start codon of Ag43 translation. A schematic representation of the agnK12 regulatory region is shown in Fig. 1A, and the sequence from positions +1 to +275 is shown in Fig. 1B. Available secondary structure programs predict that the sequence from positions +161 to +195 forms a structure consisting of a stem-loop immediately followed by a string of U's (Fig. 1C, obtained with RNAfold WebServer). Similar structures have been found to function as intrinsic (i.e., rho factor-independent) transcription terminators (e.g., see references 15, 26, and 27). The ATG at position +223, referred to here as ATG-2, corresponds to the predicted start site of the Ag43 protein (28). The sequence from positions +67 to +222 in the leader RNA constitutes a 52-codon open reading frame (ORF) including a start codon (ATG-1). This ORF is in frame with ATG-2 at position 223. If translation proceeded from ATG-1 in vivo, the Ag43 protein would contain an unusually long signal sequence of 104 amino acids (52 amino acids between ATG-1 and ATG-2 as well as 52 additional ones downstream of ATG-2). The goal of this study was to assess the functions of various regions of this leader RNA in agnK12 expression.
FIG 1.

The regulatory elements of the agnK12 5′ region. (A) Schematic representation of the agnK12 regulatory region from positions −35 to +223 showing the OxyR binding region, methylation sites, ORF, and terminator, as indicated. Two potential translation initiation codons (ATG-1 and ATG-2) are also shown. (B) DNA sequence of the agnK12 5′ region from positions +1 to +275. Dam target sequences (GATC) are in boldface type. The agnK12 terminator sequence and the two translational start sites ATG-1 and ATG-2 at positions +67 and +223 are underlined. (C) Predicted secondary structure of the region from positions 162 to 194 of the agnK12 leader RNA (see Fig. SA1 in the supplemental material).
Regions both up- and downstream of the agnK12 promoter enhance the level of transcription.
Previously, it was shown that a 101-nt region of agnK12 from positions −40 to +60 was necessary and sufficient for Dam- and OxyR-dependent phase variation to occur (11). However, the level of expression of the lacZ reporter was found to be 30-fold lower than that in a strain that contained an agn43 region from positions −466 to +275 (11). This is due to the combined effects of the upstream and downstream regions. The presence of the upstream region from positions −466 to −40 results in 3-fold more reporter gene activity; therefore, the upstream region to position −466 is included in most of the constructs used in this paper. Interestingly, the deletion of the sequence spanning positions +62 to +275 downstream of the promoter decreases expression levels by as much as 10-fold (see Fig. SA2 in the supplemental material). This may be due to the deletion causing a decrease in translation (e.g., see “Translation initiation in the agnK12 leader enhances gene expression,” below). Smaller deletions just upstream of ATG-1 have diminished effects, as shown in Fig. SA3 in the supplemental material.
A rho-independent terminator precedes the coding sequence.
The secondary structure of the leader RNA features a pronounced stem-loop from positions +162 to +195 followed by the sequence UUUUUUAUU (Fig. 1C; see also Fig. SA1 in the supplemental material for a predicted secondary structure of the entire leader RNA). Such structures have been found to effect termination of transcription by bacterial RNA polymerase (15, 26, 27). We first determined whether this structure (T1) (Fig. 2A) indeed can effect termination of transcription in vitro. The template used for these experiments was plasmid pMV203 (Table 1), containing the agnK12 sequence from positions −466 to +198 as well as a plasmid terminator (T2) further downstream. By carrying out transcription in vitro, we showed that T1 was indeed a functional terminator: the main RNA product was approximately 195 nt, as expected for transcription termination at T1 (Fig. 2B, lane 1).
FIG 2.
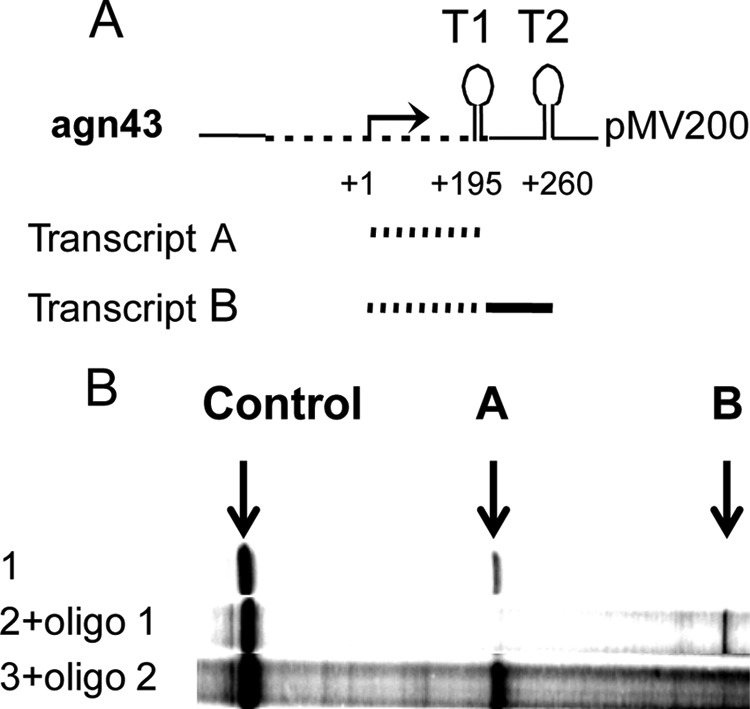
The agnK12 leader RNA features a transcription terminator functional in vitro. (A) Schematic representation of part of plasmid pMV201, containing agnK12 from positions −466 to +198. The dashed lines represent the agnK12 sequence, and the solid lines represent the vector sequence. The agnK12 transcription start is indicated (+1), and in the top cartoon, T1 and T2 refer to the terminator in agnK12 and the vector sequence, respectively. (B) Results from an in vitro transcription assay using pMV201 as a template in the absence (lane 1) and presence (lane 2) of a 100× molar excess of an oligomer hybridizing to the agnK12 sequence spanning positions +162 to +173 (see Materials and Methods), which competes with stem formation in T1. Lane 3 shows the lack of an effect of a control oligomer hybridizing to the agnK12 sequence spanning positions +44 to +56. The bands representing the 195-nt RNA terminating at T1 (A) and the approximately 260-nt RNA terminating at T2 (B) are indicated. An RNA transcribed from the vector (“Control”) is shown, as it serves as a loading control. Migration on the gel is from right to left.
Additional evidence for the function of T1 as a terminator was obtained by adding a high concentration of oligonucleotide 1 (100× molar excess over the template), complementary to the left arm of the stem (positions +161 to +173) of the agnK12 stem-loop, to the reaction mix. This resulted in a main RNA product that was 260 nt (Fig. 2B, lane 2), consistent with termination at T2 (Fig. 2A) but not at T1, suggesting that the oligonucleotide was an effective competitor for formation of the T1 but not the T2 stem-loop. Specificity was additionally demonstrated by using oligonucleotide 2, complementary to another region (positions +44 to +56) of the leader RNA. It did not interfere with transcription termination (Fig. 2B, lane 3). These results confirm that the agnK12 sequence spanning positions +162 to +195 functions as an intrinsic transcription terminator in vitro. For this reason, we refer to the T1 stem-loop as the agnK12 terminator.
Interestingly, the in vivo expression levels of transcriptional lacZ reporter fusions were not affected by deletion of the terminator stem-loop (Fig. 3A). This is evident in comparisons of strains MV203 (with the agnK12 terminator) and MV781 (deletion of positions +161 to +195 [deletion of the terminator]): no significant difference was seen in reporter expression levels for these two strains grown in M9-glycerol medium at an OD600 between 0.3 and 0.6. Thus, there appears to be an antitermination mechanism in place that functions in vivo but not in transcription reactions carried out in vitro. Reporter expression levels were also very similar for MV747 and MV812, which differ from strains MV203 and MV781 in that they have no functional translation initiation codon due to a C-for-A substitution, rendering the codon (now CTG) unable to initiate translation. We conclude that translation from ATG-1 does not play a role in antitermination of transcription, although it is also evident that 4-fold more lacZ expression is obtained when the ATG-1 codon is intact.
FIG 3.
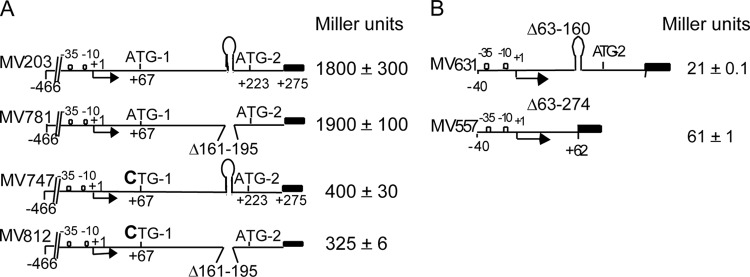
Terminator readthrough in vivo is not affected by translation of the leader RNA, but it does require a leader RNA region upstream of the terminator. All data were obtained with agnK12′-lacZ transcriptional fusions. (A) Four cartoons representing the constructs that were tested. The black rectangles represent the lacZ reporter gene, containing its own SD and ATG start site. The promoter +1 transcription start site (arrow) as well as the two agnK12 translational start sites ATG-1 and ATG-2 are indicated. The approximate position of the stem-loop in the leader RNA is also shown. MV781 and MV812 contain a deletion of the terminator stem-loop, from nt +161 to +195. MV747 and MV812 contain a +67A-to-C point mutation, resulting in CTG-1, which is not a translation initiation codon. (B) Deletion of 98 nt immediately upstream of the stem-loop structure leads to termination of transcription. The levels of LacZ expression obtained with agnK12′-lacZ fusions in the presence (MV631) or absence (MV557) of the T1 terminator sequence are indicated.
To probe whether other regions of the leader RNA (e.g., positions +62 to +160) played a role in the apparently very efficient antitermination of transcription, we tested two additional constructs (Fig. 3B). For both constructs, the upstream agnK12 sequences reached only as far as position −40. Deletion of leader sequence resulted in low reporter expression levels (see “Regions both up- and downstream of the agnK12 promoter enhance the level of transcription,” above). One construct (MV631) had a deletion from positions +63 to +160, which left the terminator stem-loop intact. The other construct (MV557) had a deletion from positions +63 to +274, which also removed the terminator (Fig. 3B). A 3-fold-higher expression level of the reporter gene was obtained with strain MV557, indicating that significant termination was taking place in strain MV631. Other experiments (see Fig. SA2 in the supplemental material) showed a 2-fold reduction in LacZ activity with a deletion of the region spanning positions +79 to +117 and a 4-fold effect with a deletion of the region spanning positions +79 to +147. Thus, a segment of the leader sequence between nt +62 and +160 may be involved in the antitermination of transcription that was observed with the intact leader sequence.
Antitermination at the agnK12 terminator is regulated.
In order to accurately compare transcripts of the regions upstream and downstream of the agn43 terminator stem-loop in vivo, we used qRT-PCR. One pair of primers (FP1-92512 and RP1-8311) (see Table SA1 in the supplemental material) amplifies the leader region upstream of the agnK12 terminator hairpin (same pair for all experiments shown), and another pair (as indicated) amplifies the region downstream of the terminator (see Materials and Methods; see also Table SA1 in the supplemental material). Significantly, qRT-PCR was used here to determine the ratio of RNAs transcribed across regions upstream to those transcribed downstream of the terminator, which is independent of phase variation. The data shown in Fig. 4 concern agn43 RNA synthesized from W3110 genomic DNA and are expressed as the ratio of the amount of RNA downstream to the amount of RNA upstream (see Materials and Methods), normalized to a value of 1 for the culture with an OD600 of 0.3. The values for relative antitermination of the duplicates are in good agreement. Antitermination decreases as a function of the OD600 for W3110 cells growing in LB medium, down to values of about 3% for cultures with an OD600 of >2. This suggests that the growth phase may affect the molecular mechanism of antitermination and/or termination, thereby providing growth phase control for expression levels of Ag43. The results shown in Fig. 3 and 4 are consistent, as the results obtained by monitoring LacZ activity (Fig. 3A) were obtained at a low culture density, for which a high level of antitermination was observed by qRT-PCR (Fig. 4). An alternative interpretation of the experiments described above (Fig. 4) is that the 3′ end of the antiterminated RNA may be particularly sensitive to an RNase that is expressed primarily in the stationary phase (e.g., the exonuclease RNase R [29]). This would represent another mode of regulation. To address this issue, we used qRT-PCR to compare culture density-dependent expression for the leader sequence (wild-type [WT] sequence) with that for a leader RNA with a deletion of the terminator stem-loop (Δterm). For this experiment, both leader RNAs were cloned into pBR322. Here a different set of primers was required for amplification of the region downstream of the terminator, now a pBR322 sequence (see Materials and Methods). From a culture OD600 of 0.6 to a culture OD600 of 2.1, the ratio of Δterm downstream RNA to Δterm upstream RNA decreased somewhat, from 1 (normalized) to 0.6 ± 0.1, while the ratio of WT downstream RNA to WT upstream RNA decreased much more, as expected (Fig. 4), from 1 (normalized) to 0.04 ± 0.01, even though both templates have similar 3′ ends. This experiment does not support preferential digestion of antiterminated RNA; thus, we conclude that the data shown in Fig. 4 indeed reflect a decrease in antitermination of transcription as the culture goes from the exponential to the stationary phase.
Both ATG-1 and ATG-2 are functional translation initiation codons in vivo.
As the agnK12 regulatory region contains two potential in-frame translation initiation codons, ATG-1 and ATG-2 (Fig. 1), we were curious whether both codons might be competent for translation initiation. We have already shown that ATG-1 was not involved in the regulation of termination at the agn43 terminator (Fig. 3A). ATG-2 corresponds to the predicted translation start site of the Ag43 protein-coding sequence (3, 28). It is preceded by a putative Shine-Dalgarno (SD) sequence, whereas the sequence preceding ATG-1 has little homology to an SD sequence. To determine if ATG-1 and ATG-2 are functional translation start sites in vivo, we constructed agnK12′-lacZ translational (protein) fusions, where the lacZ reporter does not bear a translation initiation codon; thus, β-galactosidase synthesis is dependent upon translation initiation at ATG-1 or ATG-2 (Fig. 5).
FIG 5.
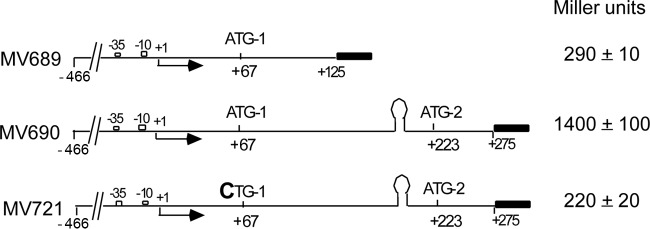
Both ATG-1 and ATG-2 are translation start sites in vivo. The agnK12′-lacZ reporter constructs are translational fusions, where the start codons and Shine-Dalgarno region (for ATG-2) are those of the agnK12 gene. β-Galactosidase levels are indicated on the right. See the legend of Fig. 1 for additional details.
A control strain with just pRS552 vector sequences resulted in lacZ expression at barely detectable levels (data not shown), whereas a translational fusion with the agnK12 sequence from positions −466 to +275 (MV690) driving expression yielded 1,400 Miller units (MU) (21). The fusion is at position +275, retaining only 18 amino acids of the 52-amino-acid Ag43 secretion signal sequence (3, 30). However, a translational fusion containing the agnK12 sequence from positions −466 to +125 (MV689) and, thus, with only ATG-1 being responsible for translation initiation of the lacZ reporter gene yielded 290 MU. Another translational fusion spanning sequences from positions −466 to +275, for which now only ATG-2 was active (MV721), as ATG-1 was mutated (ATG-1 to CTG-1), yielded 220 MU (Fig. 5). The two protein fusions differ in their N-terminal sequences, which may impact the relative level of enzyme activity. Importantly, however, these results indicate that the ATG sequences at both positions +67 and +223 are functional translation initiation sites.
Translation initiation in the agnK12 leader enhances gene expression.
A series of agnK12′-lacZ transcriptional fusions was constructed to determine if translation initiation at either ATG would affect expression of the lacZ reporter gene. All of the constructs described below contained the agn43 sequence from positions −446 through +275. We inactivated ATG-1 with the +67A→C substitution (MV747) and separately introduced the stop codon TAA three codons downstream of ATG-1 with the substitution +78C→A (MV915) (Fig. 6A). For both MV747 and MV915, the β-galactosidase activity was < 25% of that for MV203 (wild-type regulatory region) (Fig. 6A). The fact that the two mutations reduced expression levels to a similar extent reinforces the notion that actual translation of the leader RNA is involved in enhancing gene expression. Similar reductions in reporter expression were seen with the substitution of CTG for ATG-2 (MV846). A construct for which both initiation codons are inactivated (MV928) showed very little LacZ reporter activity. Finally, similar effects of inactivation of ATG-1 were seen with a truncated leader sequence (compare MV654 and MV897).
FIG 6.

Translation from both from ATG-1 and ATG-2 is needed for optimal expression of the agnK12 gene transcriptional fusions. (A) Effects of inactivation of ATG-1 and ATG-2, or of termination of translation soon after its initiation, on agnK12 gene expression. (B) Analysis of the stability of the lacZ mRNA in MV203 (agnK12′-lacZ) (●) and MV747 (agnK12′-lacZ, CTG-1) (■) by using qRT-PCR. See Materials and Methods for additional details.
The mutants described above reflect an increased level of the WT transcript downstream of the terminator sequence as a result of translation initiation, a posttranscriptional event. We determined the stability of the 3′ region of the lacZ mRNA in strains MV203 (WT ATG-1 translation initiation codon) and MV747 (nonfunctional translation initiation codon CTG-1) by qRT-PCR (25). The half-life of the lacZ mRNA in MV747 (0.1 min) was one-sixth of that in MV203 (0.6 min) (Fig. 6B), indicating that translation initiating at ATG-1 enhances downstream mRNA stability. It is likely that translation from ATG-2 has a similar effect, but this was not directly tested.
DISCUSSION
In addition to the known regulation by phase variation, we have shown here that the level of agn43 expression is controlled by antitermination of transcription and by translation initiation in the agn43 leader RNA preceding the initiation codon of the Ag43 protein. All agn leader sequences have been found to include a sequence similar or identical to the E. coli agnK12 sequence from positions +162 to +195, which, as shown here, is a functional terminator in vitro and a regulated intrinsic terminator in vivo. Transcription elongation through the leader is dependent on antitermination, and we have demonstrated that later in the growth phase, termination at this sequence was increased (Fig. 4). This is the first evidence that the level of Ag43 can be controlled by a mechanism other than phase variation. In view of the sequence conservation noted above, this mechanism of controlling the level of expression of agn43, and, thus, the Ag43 protein, may be conserved between alleles. It is as yet unclear what the underlying antitermination mechanism is. We have not been able to identify trans-acting antitermination factors using transposon mutagenesis. The work of others has shown that deletion of the antiterminator protein RfaH (31) actually increased agnK12 expression and biofilm formation in K-12 strain MG1655 (32). Thus, it is unlikely that RfaH plays a direct role in agn43 terminator bypass.
The leader RNA has a putative cis antiterminator sequence (+141 5′-CCGGC-3′ +145), which could potentially bind to the bottom left strand of the stem of the agn43 hairpin shown in Fig. 1C. This would then disrupt the stem-loop structure and bring about antitermination of transcription. Indeed, in 2005, Merino and Yanofsky (33) hypothesized that the agn43 (then referred to as “flu”) leader RNA terminator would be able to be regulated due to the presence of cis antiterminator regions in the leader RNA. We have so far been unable to observe any significant effects of constructs designed to render the sequence spanning positions +141 to +145 inoperative in vivo (data not shown). However, oligonucleotide 1, complementary to the region spanning positions 162 to 173 of the leader RNA, when added in large excess, was able to cause trans antitermination in vitro (Fig. 2B) at the agnK12 terminator. A search for E. coli RNA sequences that might act similarly to oligonucleotide 1 by pairing to the left leg of the terminator stem was carried out by using the program RNAPredator. Stretches of several mRNAs were found to potentially do so, among which the CsrD mRNA was most interesting, as it was predicted to form a highly stable duplex and also due to its connection to biofilms.
CsrA, -B, -C, and -D constitute a regulon; CsrA is an RNA binding protein that regulates stress responses and biofilm formation in Escherichia coli (34, 35). The CsrB and CsrC RNAs antagonize these functions by binding to CsrA. CsrD facilitates degradation of CsrB and CsrC RNAs, thus downregulating the expression of flagella in the stationary phase (36). Flagella are important for biofilm formation (37) in the early phases. CsrD, in an as-yet-unknown way (36), also stimulates the expression of curli fimbriae, which are important for adhesion of E. coli to surfaces in the process of biofilm formation (38, 39).
We determined that nt 1074 to 1092 of the CsrD mRNA, except for one bulged-out A, were entirely complementary to nt 156 to 171 (5′-UUACCUCGCGGUAUCC-3′) of the leader RNA sequence (Babitzke and Romeo made a similar observation [P. Babitzke and T. Romeo, personal communication]), including 10 nt starting at the “bottom” of the left strand of the terminator stem (Fig. 1C). Thus, the CsrD mRNA could potentially act in trans to cause antitermination at the agn43 terminator. Of course, it is also possible that the terminated leader RNA functions as a small RNA (sRNA), affecting CsrD expression. Indeed, RNAs with a length and sequence consistent with the terminated agn43 leader RNA (named IsrC) were detected at low levels in the cell (40, 41). The terminated leader RNA might have defined roles under conditions of nutrient limitation, where termination would take place most frequently.
Transcription of the agnK12 gene is under the control of both phase variation, exercised by the proteins Dam and OxyR (3, 9–12), and antitermination of transcription at the agnK12 leader terminator, as shown here. We have now demonstrated that the level of agn43 expression in an ON cell is also modulated posttranscriptionally by translation initiation in the agnK12 leader RNA. Two in-frame ATG sequences, at position +67 (ATG-1) and at position +223, are functional translation initiation sites (Fig. 5). Our results indicate that translation of the region upstream of ATG-2 significantly increases agnK12 expression, whether expression is assessed with transcriptional or translational agnK12′-lacZ fusions (Fig. 6). Our data indicate that translation initiating at ATG-1 enhances gene expression (Fig. 5) by increasing mRNA stability (Fig. 6). A similar mechanism of RNA stabilization was described previously (42, 43). Interestingly, it has been observed that in the long (170-nt) leader RNA of the LEE1 operon of enterohemorrhagic E. coli, translation plays an important regulatory role as well. Expression of the ler gene of this operon is dependent on the translation of a very short (two-codon) reading frame (44).
As high-level expression of Ag43 was seen in young (6) but not in mature (7) biofilms, while another study found that Ag43 was not required for biofilm maturation (8), we conclude that Ag43 must play an early role in the process of biofilm formation. This is consistent with our results shown here, that the expression level of the agnK12 gene is maximal early in the growth phase of the bacterium. In the many E. coli strains that have been sequenced, the agnK12-like genes form a family of related alleles, with some genomes carrying up to four alleles (3). The roles of the different proteins may be diverse: specific variants have been implicated in calcium binding, enhanced colonization, and biofilm formation (3). Such diverse roles of the Ag43 protein may be attributed to various allelic families. In addition to the diversity in protein sequence, the DNA sequences of the regulatory regions may also be different, even if specific elements, such as the terminator, are highly conserved.
The results presented here highlight the important role of the agnK12 leader RNA. Future experiments will focus on the mechanism of antitermination at the agnK12 terminator, the possibly different roles of agnK12 alleles, and the possibility of a regulatory role of the leader RNA as an sRNA, with special emphasis on the CsrD gene. We anticipate that such studies will further enhance our understanding of the role of agnK12 in biofilm formation.
Supplementary Material
ACKNOWLEDGMENTS
This work was supported in part by National Science Foundation grants MCB03-22345 (M.W.V.D.W.) and MCB-1050142 (P.L.D.).
We thank Ann Hochschild for discussion, Jonatha Gott for advice, Jeff Coller and Najwa Al-Husaini for instructions and the use of their qRT-PCR instrument, Ebenezer Minaya and Manasa Sagaram for initial experiments, and David Samols for critical reading of the manuscript.
Footnotes
Published ahead of print 16 May 2014
Supplemental material for this article may be found at http://dx.doi.org/10.1128/JB.01680-14.
REFERENCES
- 1.Ulett GC, Valle J, Beloin C, Sherlock O, Ghigo JM, Schembri MA. 2007. Functional analysis of antigen 43 in uropathogenic Escherichia coli reveals a role in long-term persistence in the urinary tract. Infect. Immun. 75:3233–3244. 10.1128/IAI.01952-06 [DOI] [PMC free article] [PubMed] [Google Scholar]
- 2.Watts RE, Hancock V, Ong CL, Vejborg RM, Mabbett AN, Totsika M, Looke DF, Nimmo GR, Klemm P, Schembri MA. 2010. Escherichia coli isolates causing asymptomatic bacteriuria in catheterized and noncatheterized individuals possess similar virulence properties. J. Clin. Microbiol. 48:2449–2458. 10.1128/JCM.01611-09 [DOI] [PMC free article] [PubMed] [Google Scholar]
- 3.van der Woude MW, Henderson IR. 2008. Regulation and function of Ag43 (flu). Annu. Rev. Microbiol. 62:153–169. 10.1146/annurev.micro.62.081307.162938 [DOI] [PubMed] [Google Scholar]
- 4.Harris JA, Roy K, Woo-Rasberry V, Hamilton DJ, Kansal R, Qadri F, Fleckenstein JM. 2011. Directed evaluation of enterotoxigenic Escherichia coli autotransporter proteins as putative vaccine candidates. PLoS Negl. Trop. Dis. 5:e1428. 10.1371/journal.pntd.0001428 [DOI] [PMC free article] [PubMed] [Google Scholar]
- 5.de Luna M, Scott-Tucker A, Desvaux M, Ferguson P, Morin NP, Dudley EG, Turner S, Nataro JP, Owen P, Henderson IR. 2008. The Escherichia coli biofilm-promoting protein antigen 43 does not contribute to intestinal colonization. FEMS Microbiol. Lett. 284:237–246. 10.1111/j.1574-6968.2008.01207.x [DOI] [PubMed] [Google Scholar]
- 6.Schembri MA, Kjaergaard K, Klemm P. 2003. Global gene expression in Escherichia coli biofilms. Mol. Microbiol. 48:253–267. 10.1046/j.1365-2958.2003.03432.x [DOI] [PubMed] [Google Scholar]
- 7.Beloin C, Valle J, Latour-Lambert P, Faure P, Kzreminski M, Balestrino D, Haagensen JA, Molin S, Prensier G, Arbeille B, Ghigo JM. 2004. Global impact of mature biofilm lifestyle on Escherichia coli K-12 gene expression. Mol. Microbiol. 51:659–674. 10.1046/j.1365-2958.2003.03865.x [DOI] [PubMed] [Google Scholar]
- 8.Reisner A, Haagensen JA, Schembri MA, Zechner EL, Molin S. 2003. Development and maturation of Escherichia coli K-12 biofilms. Mol. Microbiol. 48:933–946. 10.1046/j.1365-2958.2003.03490.x [DOI] [PubMed] [Google Scholar]
- 9.Haagmans W, van der Woude M. 2000. Phase variation of Ag43 in Escherichia coli: Dam-dependent methylation abrogates OxyR binding and OxyR-mediated repression of transcription. Mol. Microbiol. 35:877–887. 10.1046/j.1365-2958.2000.01762.x [DOI] [PubMed] [Google Scholar]
- 10.Henderson I, Owen P. 1997. The autoregulatory protein Mor and OxyR are identical. Microbiology 143:1482. 10.1099/00221287-143-5-1482 [DOI] [PubMed] [Google Scholar]
- 11.Wallecha A, Munster V, Correnti J, Chan T, van der Woude M. 2002. Dam- and OxyR-dependent phase variation of agn43: essential elements and evidence for a new role of DNA methylation. J. Bacteriol. 184:3338–3347. 10.1128/JB.184.12.3338-3347.2002 [DOI] [PMC free article] [PubMed] [Google Scholar]
- 12.van der Woude MW. 2011. Phase variation: how to create and coordinate population diversity. Curr. Opin. Microbiol. 14:205–211. 10.1016/j.mib.2011.01.002 [DOI] [PubMed] [Google Scholar]
- 13.van der Woude MW, Baumler AJ. 2004. Phase and antigenic variation in bacteria. Clin. Microbiol. Rev. 17:581–611. 10.1128/CMR.17.3.581-611.2004 [DOI] [PMC free article] [PubMed] [Google Scholar]
- 14.Wallecha A, Correnti J, Munster V, van der Woude M. 2003. Phase variation of Ag43 is independent of the oxidation state of OxyR. J. Bacteriol. 185:2203–2209. 10.1128/JB.185.7.2203-2209.2003 [DOI] [PMC free article] [PubMed] [Google Scholar]
- 15.Peters JM, Vangeloff AD, Landick R. 2011. Bacterial transcription terminators: the RNA 3′-end chronicles. J. Mol. Biol. 412:793–813. 10.1016/j.jmb.2011.03.036 [DOI] [PMC free article] [PubMed] [Google Scholar]
- 16.Kourennaia OV, deHaseth PL. 2007. Substitution of a highly conserved histidine in the Escherichia coli heat shock transcription factor, sigma32, affects promoter utilization in vitro and leads to overexpression of the biofilm-associated flu protein in vivo. J. Bacteriol. 189:8430–8436. 10.1128/JB.01197-07 [DOI] [PMC free article] [PubMed] [Google Scholar]
- 17.Maniatis T, Sambrook J, Fritsch EF. 1982. Molecular cloning: a laboratory manual. Cold Spring Harbor Laboratory, Cold Spring Harbor, NY [Google Scholar]
- 18.Silhavy TJ, Berman ML, Enquist LW. 1984. Experiments with gene fusions. Cold Spring Harbor Laboratory, Cold Spring Harbor, NY [Google Scholar]
- 19.Blattner FR, Plunkett G, III, Bloch CA, Perna NT, Burland V, Riley M, Collado-Vides J, Glasner JD, Rode CK, Mayhew GF, Gregor J, Davis NW, Kirkpatrick HA, Goeden MA, Rose DJ, Mau B, Shao Y. 1997. The complete genome sequence of Escherichia coli K-12. Science 277:1453–1462. 10.1126/science.277.5331.1453 [DOI] [PubMed] [Google Scholar]
- 20.Miller JH. 1972. Experiments in molecular genetics. Cold Spring Harbor Laboratory, Cold Spring Harbor, NY [Google Scholar]
- 21.Simons RW, Houman F, Kleckner N. 1987. Improved single and multicopy lac-based cloning vectors for protein and operon fusions. Gene 53:85–96. 10.1016/0378-1119(87)90095-3 [DOI] [PubMed] [Google Scholar]
- 22.Chauhan A, Sakamoto C, Ghigo JM, Beloin C. 2013. Did I pick the right colony? Pitfalls in the study of regulation of the phase variable antigen 43 adhesin. PLoS One 8:e73568. 10.1371/journal.pone.0073568 [DOI] [PMC free article] [PubMed] [Google Scholar]
- 23.Bloch CA, Thorne GM, Ausubel FM. 1989. General method for site-directed mutagenesis in Escherichia coli O18ac:K1:H7: deletion of the inducible superoxide dismutase gene, sodA, does not diminish bacteremia in neonatal rats. Infect. Immun. 57:2141–2148 [DOI] [PMC free article] [PubMed] [Google Scholar]
- 24.Ross W, Gosink KK, Salomon J, Igarashi K, Zou C, Ishihama A, Severinov K, Gourse RL. 1993. A third recognition element in bacterial promoters: DNA binding by the alpha subunit of RNA polymerase. Science 262:1407–1413. 10.1126/science.8248780 [DOI] [PubMed] [Google Scholar]
- 25.Bustin SA. 2000. Absolute quantification of mRNA using real-time reverse transcription polymerase chain reaction assays. J. Mol. Endocrinol. 25:169–193. 10.1677/jme.0.0250169 [DOI] [PubMed] [Google Scholar]
- 26.Cambray G, Guimaraes JC, Mutalik VK, Lam C, Mai QA, Thimmaiah T, Carothers JM, Arkin AP, Endy D. 2013. Measurement and modeling of intrinsic transcription terminators. Nucleic Acids Res. 41:5139–5148. 10.1093/nar/gkt163 [DOI] [PMC free article] [PubMed] [Google Scholar]
- 27.Chen YJ, Liu P, Nielsen AA, Brophy JA, Clancy K, Peterson T, Voigt CA. 2013. Characterization of 582 natural and synthetic terminators and quantification of their design constraints. Nat. Methods 10:659–664. 10.1038/nmeth.2515 [DOI] [PubMed] [Google Scholar]
- 28.Henderson IR, Owen P. 1999. The major phase-variable outer membrane protein of Escherichia coli structurally resembles the immunoglobulin A1 protease class of exported protein and is regulated by a novel mechanism involving Dam and OxyR. J. Bacteriol. 181:2132–2141 [DOI] [PMC free article] [PubMed] [Google Scholar]
- 29.Vincent HA, Deutscher MP. 2009. Insights into how RNase R degrades structured RNA: analysis of the nuclease domain. J. Mol. Biol. 387:570–583. 10.1016/j.jmb.2009.01.068 [DOI] [PMC free article] [PubMed] [Google Scholar]
- 30.Szabady RL, Peterson JH, Skillman KM, Bernstein HD. 2005. An unusual signal peptide facilitates late steps in the biogenesis of a bacterial autotransporter. Proc. Natl. Acad. Sci. U. S. A. 102:221–226. 10.1073/pnas.0406055102 [DOI] [PMC free article] [PubMed] [Google Scholar]
- 31.Artsimovitch I, Landick R. 2002. The transcriptional regulator RfaH stimulates RNA chain synthesis after recruitment to elongation complexes by the exposed nontemplate DNA strand. Cell 109:193–203. 10.1016/S0092-8674(02)00724-9 [DOI] [PubMed] [Google Scholar]
- 32.Beloin C, Michaelis K, Lindner K, Landini P, Hacker J, Ghigo JM, Dobrindt U. 2006. The transcriptional antiterminator RfaH represses biofilm formation in Escherichia coli. J. Bacteriol. 188:1316–1331. 10.1128/JB.188.4.1316-1331.2006 [DOI] [PMC free article] [PubMed] [Google Scholar]
- 33.Merino E, Yanofsky C. 2005. Transcription attenuation: a highly conserved regulatory strategy used by bacteria. Trends Genet. 21:260–264. 10.1016/j.tig.2005.03.002 [DOI] [PubMed] [Google Scholar]
- 34.Adamson DN, Lim HN. 2013. Rapid and robust signaling in the CsrA cascade via RNA-protein interactions and feedback regulation. Proc. Natl. Acad. Sci. U. S. A. 110:13120–13125. 10.1073/pnas.1308476110 [DOI] [PMC free article] [PubMed] [Google Scholar]
- 35.Baker CS, Eory LA, Yakhnin H, Mercante J, Romeo T, Babitzke P. 2007. CsrA inhibits translation initiation of Escherichia coli hfq by binding to a single site overlapping the Shine-Dalgarno sequence. J. Bacteriol. 189:5472–5481. 10.1128/JB.00529-07 [DOI] [PMC free article] [PubMed] [Google Scholar]
- 36.Sommerfeldt N, Possling A, Becker G, Pesavento C, Tschowri N, Hengge R. 2009. Gene expression patterns and differential input into curli fimbriae regulation of all GGDEF/EAL domain proteins in Escherichia coli. Microbiology 155:1318–1331. 10.1099/mic.0.024257-0 [DOI] [PubMed] [Google Scholar]
- 37.Pratt LA, Kolter R. 1998. Genetic analysis of Escherichia coli biofilm formation: roles of flagella, motility, chemotaxis and type I pili. Mol. Microbiol. 30:285–293. 10.1046/j.1365-2958.1998.01061.x [DOI] [PubMed] [Google Scholar]
- 38.Pawar DM, Rossman ML, Chen J. 2005. Role of curli fimbriae in mediating the cells of enterohaemorrhagic Escherichia coli to attach to abiotic surfaces. J. Appl. Microbiol. 99:418–425. 10.1111/j.1365-2672.2005.02499.x [DOI] [PubMed] [Google Scholar]
- 39.Cookson AL, Cooley WA, Woodward MJ. 2002. The role of type 1 and curli fimbriae of Shiga toxin-producing Escherichia coli in adherence to abiotic surfaces. Int. J. Med. Microbiol. 292:195–205. 10.1078/1438-4221-00203 [DOI] [PubMed] [Google Scholar]
- 40.Raghavan R, Groisman EA, Ochman H. 2011. Genome-wide detection of novel regulatory RNAs in E. coli. Genome Res. 21:1487–1497. 10.1101/gr.119370.110 [DOI] [PMC free article] [PubMed] [Google Scholar]
- 41.Shinhara A, Matsui M, Hiraoka K, Nomura W, Hirano R, Nakahigashi K, Tomita M, Mori H, Kanai A. 2011. Deep sequencing reveals as-yet-undiscovered small RNAs in Escherichia coli. BMC Genomics 12:428. 10.1186/1471-2164-12-428 [DOI] [PMC free article] [PubMed] [Google Scholar]
- 42.Baker KE, Mackie GA. 2003. Ectopic RNase E sites promote bypass of 5′-end-dependent mRNA decay in Escherichia coli. Mol. Microbiol. 47:75–88. 10.1046/j.1365-2958.2003.03292.x [DOI] [PubMed] [Google Scholar]
- 43.Deana A, Belasco JG. 2005. Lost in translation: the influence of ribosomes on bacterial mRNA decay. Genes Dev. 19:2526–2533. 10.1101/gad.1348805 [DOI] [PubMed] [Google Scholar]
- 44.Islam MS, Shaw RK, Frankel G, Pallen MJ, Busby SJ. 2012. Translation of a minigene in the 5′ leader sequence of the enterohaemorrhagic Escherichia coli LEE1 transcription unit affects expression of the neighbouring downstream gene. Biochem. J. 441:247–253. 10.1042/BJ20110912 [DOI] [PMC free article] [PubMed] [Google Scholar]
Associated Data
This section collects any data citations, data availability statements, or supplementary materials included in this article.