

Abstract
Proper organization of the microtubule cytoskeleton is essential for many cellular processes including maintenance of Golgi organization and cell polarity. Traditionally, the centrosome is considered to be the major microtubule organizing center (MTOC) of the cell; however, microtubule nucleation can also occur through centrosome-independent mechanisms. Recently, the Golgi has been described as an additional, centrosome-independent, MTOC with distinct cellular functions. Golgi-derived microtubules contribute to the formation of an asymmetric microtubule network, control Golgi organization, and support polarized trafficking and directed migration in motile cells. In this chapter, we present an assay using recovery from ice treatment to evaluate the potential of the Golgi, or other MTOCs, to nucleate microtubules. This technique allows for clear separation of distinct MTOCs and observation of newly nucleated microtubules at these locations, which are normally obscured by the dense microtubule network present at steady-state conditions. This type of analysis is important for discovery and characterization of noncentrosomal MTOCs and, ultimately, understanding of their unique cellular functions.
INTRODUCTION AND RATIONALE
Microtubules (MTs) function as tracks within the cell to organize the intracellular space by distributing organelles and proteins. The inherent polarity of MTs allows for directionality in intracellular transport. In addition to the innate polarity provided by MTs, it is important for the cell to establish a structurally and functionally asymmetric MT network for many important processes, such as cell migration and cell division. Conventionally, centrosomes serve as the principal microtubule organizing center (MTOC) from which the majority of MTs in the cell are nucleated; however, MTs nucleated at the centrosome have been shown to be symmetric in nature, both in vitro (Bergen, Kuriyama, & Borisy, 1980) and in polarized cells (Salaycik, Fagerstrom, Murthy, Tulu, & Wadsworth, 2005). Therefore, the cell must have other mechanisms in place to allow for the establishment of asymmetric MT networks.
Multiple mechanisms exist that allow for the cell to establish an asymmetric MT network. For example, repositioning of the centrosome away from the cell center, local stabilization of MTs at a specific region in the cell, or severing and releasing of MTs from the centrosome (reviewed in Vinogradova, Miller, & Kaverina, 2009). In addition, an alternative, noncentrosomal MTOC can serve as a site for nucleation of an asymmetric MT array. Several recent studies have demonstrated the role of the Golgi complex as a major MTOC in mammalian cells (Chabin-Brion et al., 2001; Efimov et al., 2007; Rivero, Cardenas, Bornens, & Rios, 2009). Interestingly, the Golgi complex itself is intrinsically asymmetric: the Golgi is comprised of membrane cisternae stacks with distinct cis-to-trans polarity (Ladinsky, Wu, McIntosh, McIntosh, & Howell, 2002). In addition, Golgi-derived MTs are oriented predominately toward the leading edge of a motile cell, allowing for directional post-Golgi trafficking and cell migration (Efimov et al., 2007; Miller et al., 2009). Noncentrosomal, Golgi-derived MTs have also been shown to be essential in maintaining the cellular architecture of complex MT-dependent cells, such as neurons (Ori-McKenney, Jan, & Jan, 2012).
MTs are required for proper Golgi organization. Our recent analyses of Golgi-derived MTs have shown that this specific MT subpopulation is essential for proper Golgi assembly, morphology, and integrity (Miller et al., 2009). MT depolymerization causes disruption of the Golgi complex into individual mini-stacks; while, in the presence of a normal MT network, the Golgi complex accumulates near the centrosome, due to the function of the minus-end-directed motor Dynein (Vaughan, 2005). Initially it was unclear to what degree the centrosomal and Golgi-derived MTOCs were involved in the reassembly of Golgi mini-stacks after MT depolymerization. Further studies in our lab revealed that both centrosomal and Golgi-derived MT populations are required for proper Golgi complex assembly; however, Golgi-derived MTs are necessary and sufficient for Golgi maintenance once formed (Vinogradova et al., 2012).
In addition to MTs, the actin cytoskeleton also plays a role in Golgi organization. Actin and many actin-binding proteins have been localized to the Golgi complex and have been shown to be important in the function of this organelle (reviewed in Egea, Lazaro-Dieguez, & Viella, 2006). In plants and fungi, actin and the actin-based motor, myosin, are required for the movement and organization of Golgi stacks; however, it has recently been shown that myosin also plays a role in Golgi organization in mammalian cells (reviewed in Lowe, 2011).
Frequently within the cell, the Golgi complex is located near the centrosome resulting in the maintenance of two independent MTOCs, one symmetric and one asymmetric, in close proximity to each other. This close proximity can make it technically difficult to distinguish between MTs nucleated at either structure and it can be nearly impossible to observe newly nucleated Golgi-derived MTs at steady state due to the dense MT network existing around the MTOCs. There are multiple tricks and techniques, which have been developed to circumvent these dilemmas. Here we present a protocol for clear detection of Golgi-derived MTs using an ice recovery assay, first applied for this purpose by Rivero et al. (2009). This technique can be easily adapted to characterize and study MT nucleation at other centrosomal and noncentrosomal MTOCs as well.
24.1 MATERIALS
24.1.1 Cell culture and transfection
Cells: Immortalized human pigment epithelial cells hTert-RPE1 (Clontech).
Complete media: Dulbecco’s Modification of Eagle’s Medium/Ham’s F-12 50/50 Mix (DMEM F-12K, Mediatech) supplemented with 10% fetal bovine serum (Atlanta Biologicals), and 1 mM L-glutamine (Mediatech).
Trypsin solution: 0.25% trypsin with EDTA, without sodium bicarbonate, calcium, and magnesium (Mediatech).
Transfection reagent: FuGENE 6 (Roche).
Plasmid: Centrosome marker (e.g., Centrin2-EGFP, Supplied by Jeffrey Salisbury on Addgene).
Plastic tissue culture flasks and dishes (Santa Cruz).
24.1.2 Ice treatment and ice recovery
24.1.2.1 Required Materials for Ice Treatment
Ice bucket and Ice
24.1.2.2 Optional Materials for Recovery at 37 °C and Free Tubulin Extraction Step
37 °C water bath.
Nocodazole (Sigma) stock: 16.6 mM in DMSO. Store at −20 °C.
Paclitaxel (Sigma) stock: 5 μM in DMSO. Store at −20 °C.
Extraction buffer: 60 mM PIPES, 25 mM HEPES, 10 mM EGTA, 2 mM MgCl2, 0.1% Saponin; Adjust pH to 6.9 and store at 4 °C. Immediately before use, supplement with 0.25 nM nocodazole and 0.25 nM paclitaxel (Zhai & Borisy, 1994).
24.1.3 Immunofluorescence
No. 1.5 glass microscope coverslips (circular, 12 mm width) and microscope slides for immunofluorescence (Fisher Scientific).
Human fibronectin (BD Biosciences) stock: Prepare a 2.27 μM (1 mg/mL) stock in 1 Murea. For long-term storage keep at −80 °C, working solution can be kept at 4 °C.
Phosphate-buffered saline (PBS): Prepare a 10× stock solution by mixing 1.37 M NaCl, 27 mM KCl, 80 mM Na2HPO4, 20 mM KH2PO4 then autoclave. Alternatively, use pre-made 10× PBS (Corning). Dilute to 1× working solution before use, store at room temperature.
Fixation: Methanol (EMD Chemicals Inc.) and −20 °C freezer for incubation.
Blocking and antibody dilution buffer: Prepare a 1% bovine serum albumin (Fisher) in PBS supplemented with 5% donor horse serum (Atlanta Biologicals). For long-term storage, keep at −20 °C; working solution can be kept at 4 °C.
Primary antibodies: Mouse monoclonal anti-GM130 antibody (used at 1:300 dilution, BD Biosciences), rabbit polyclonal anti-alpha tubulin (used at 1:1000 dilution, Abcam).
Secondary antibodies: Highly cross-absorbed Alexa Fluor 568 anti-mouse (Invitrogen), highly cross-absorbed Alexa Fluor 647 anti-rabbit (Invitrogen).
Mounting medium: ProLong Gold antifade reagent (Invitrogen). Store at −20 °C.
Clear nail polish.
24.1.4 Confocal microscope and analysis
Microscope: Leica TCS SP5 laser-scanning confocal system with 488, 543, and 633 excitation laser lines for triple-color imaging.
Optics: 100×, 1.47 numerical aperture (NA) Plan Apo lens.
Software packages, such as NIH ImageJ (http://rsbweb.nih.gov/ij/), can be used for image analysis.
24.2 METHODS
We suggest the following method for identification and analysis of noncentrosomal MT nucleation sites, using the Golgi as an example. Because the centrosome and Golgi are often located in close proximity to each other within the cell, it can be difficult to study MT nucleation at these independent sites during steady state. In some cells, this dilemma can be overcome if a significant distance spatially separates the centrosome and the Golgi; however, this is not always possible. Alternatively, MT nucleation can be monitored after ice treatment recovery to clearly visualize multiple MTOCs. When cells are subjected to ice treatment, the entire MT network is disassembled; subsequent warming up allows for MT regrowth. Without obstruction from the entire MT network, individual MTOCs and MT subpopulations can now be resolved and examined (Fig. 24.1).
FIGURE 24.1.

Steps of the ice recovery assay. The sequence of the main steps during the ice recovery assay. Small gray circles represent coverslips and white arrows indicate the transition from one step in the procedure to the next. For details of the ice recovery procedure, see main text.
24.2.1 Cell maintenance and preparation for transfection
RPE1 cells are maintained in 5-mL tissue culture flasks and passaged when approximately 80% confluent. To passage, cells are treated with trypsin solution for 1–2 min at room temperature or until cells begin to round up and detach from the bottom of the flask; cells are then split into a new 5-mL flask for maintenance at a 1:3 or 1:6 dilution. For transfection and ice recovery followed by immunofluorescence, cells are plated at a 1:6 dilution in 35-mm tissue culture dishes containing prepared glass microscope coverslips.
To prepare coverslips for immunofluorescence, empty a pack of coverslips into a glass petri dish and autoclave to sterilize. Sterilized coverslips are kept in the tissue culture hood, under UV, until ready to use. Using forceps, transfer coverslips from the petri dish to a 35-mm tissue culture dish. Before plating cells onto the coverslips, we first coat the glass surface with fibronectin to promote cell attachment and cell spreading. Fibronectin stock (see Step 2 in Section 24.1.3) is diluted 1:100 with 1× PBS, then a 50–100 μL drop of diluted fibronectin is added onto the center of each coverslip. Finally, the coverslips are incubated with fibronectin for a minimum of 1 h at room temperature, or 30 min at 37 °C, to allow coating of the glass surface. Prior to plating your cells, remove excess fibronectin solution from the coverslip surface by aspiration; be careful to only aspirate at the top of the droplet to prevent disruption on the fibronectin that has settled onto the coverslip.
To plate your cells onto the coverslips, trypsinize and split them into the 35 mm dish with fibronectin-coated coverslips at the desired dilution. Cells are then incubated at 37 °C to allow for attachment to the fibronectin-coated surface and cell spreading.
For transfection, the cells are transfected with 0.5 μg of Centrin-GFP using the FuGENE transfection reagent according to the manufacture’s protocol: In a 1.5-mL Eppendorf tube containing 100 μL of plain DMEM/F12K medium, add 3 μL of FuGENE and mix by gently flicking the tube several times. Then, add 0.5 μg of Centrin-GFP to the transfection mixture and gently flick the tube to mix once again. Incubate the mixture at room temperature for a minimum of 30 min then add drop-wise to the cells you have already plated onto the fibronectin-coated coverslips. Gently swirl the dish to mix the transfection mixture with the medium already in the dish. Incubate the cells with the transfection mixture for 1–2 days to allow expression of the protein of interest prior to the ice recovery experiment. We recommend that you try various transfection conditions (such as amount of DNA, amount of FuGENE, and expression time) to find the optimal Centrin-GFP expression conditions for your cell type.
24.2.2 Ice treatment and ice recovery
For the ice treatment, fill a bucket with ice and keep on your bench at room temperature. To allow for disassembly of the MT cytoskeleton, the 35-mm dish containing cells adhered to coverslips is placed directly onto ice and incubated for 40 min. Shorter incubation times will result in partial disassembly of the MT network with stable populations, such as acetylated-tubulin, still remaining within the cell.
During the ice incubation, prepare the fixative by adding 1–2 mL of 100% methanol to a 12-well plate. Chill the 12-well plate at −20 °C for at least 15 min to ensure the fixative reaches the required temperature. Be careful not to contaminate the methanol with any ice or water, as this will interfere with optimal fixation.
Once all MTs are disassembled, ice recovery can be achieved through two methods: the first is recovery at 37 °C and the second is recovery at room temperature. Recovery from ice treatment at room temperature is ideal because MT nucleation and regrowth occurs more slowly than at 37 °C, which allows for longer recovery periods and the ability to capture the fine details of the process.
To prepare for ice recovery at 37 °C, first float two 60 mm tissue culture dishes on a Styrofoam raft in a 37 °C water bath. Fill one dish with 5 mL of fresh complete media and one dish with 5 mL of freshly prepared extraction buffer; allow the solutions to warm to 37 °C for several minutes. To recover MT nucleation after ice treatment, quickly lift the coverslip from the 35-mm dish on ice and place it directly into the pre-warmed complete media. Gently swirl the dish for 45 s to allow MT regrowth. Next, immediately remove the coverslip from the media and immerse in the pre-warmed extraction buffer. Gently swirl the dish for another 40 s to allow extraction of free tubulin from the cytoplasm. After recovery at 37 °C, coverslips are immediately subjected to fixation. For recovery at room temperature, simply remove the 35-mm dish containing your coverslips from the ice bucket and place on your bench at room temperature. Incubate the coverslips at room temperature for 3–5 min to allow MT regrowth. If desired, the coverslips can then be incubated in extraction buffer to remove excess free tubulin from the cytoplasm as described above.
Please note that the extraction buffer containing low amounts of nocodazole and paclitaxel can be used as an optional step after ice recovery and prior to fixation to decrease free tubulin in the cytoplasm. Because the majority of the MT network remains depolymerized after short ice recovery times, a large amount of free tubulin exists in the cytoplasm, which upon immunofluorescence can decrease the quality of your images. If desired, brief incubation of your coverslips in extraction buffer can help to eliminate background fluorescence created by free tubulin, and can enhance the contrast in your images.
It is important to use short recovery times because MT nucleation and regrowth are quite rapid; various recovery times should be tested to optimize visualization of desired dynamic processes. Ideally, for the best detection of MT regrowth at MTOCs, we recommend allowing the MTs to grow between 1 and 5 μm in length prior to fixation (e.g., images, see Fig. 24.3).
FIGURE 24.3.

Detection of Golgi-derived MTs using the ice recovery assay. (A–F) Immunofluorescence images of RPE cells expressing Centrin-GFP (green) stained for alpha-tubulin (red) and the Golgi marker GM130 (blue). Maximum intensity projection of a confocal stack. White arrow indicates the location of the centrosome. (A) Untreated control cell at steady state with intact MT network. (B) Cell after 40 min ice treatment to depolymerize the entire MT network. (C–F) Examples of MT nucleation at MTOCs after 5 min ice recovery at 21 °C (room temperature). Short, newly nucleated MTs can be seen colocalizing with both Centrin-GFP (centrosomal MTOC) and GM130 (noncentrosomal MTOC, Golgi complex). (C) Example of ice recovery in a cell in which the centrosome and Golgi are in close proximity to each other. (D) Example of ice recovery in a cell in which the centrosome and Golgi are physically separated allowing for clearer distinction between MT subpopulations. (E) Zoomed region from C. (F) Zoomed region from D. (E–F) White arrow indicates MTs nucleated at the centrosome, alpha-tubulin colocalization with Centrin-GFP. Yellow arrowhead indicates MTs nucleated at the Golgi, alpha-tubulin colocalization with GM130.
The ice incubation time necessary to fully disassemble the entire MT network may vary between cell types. Note that it is important to find the minimal time on ice required to disassemble all MTs without exposing the cells to unnecessarily long periods on ice. Therefore, before conducting the full ice recovery experiment, it is recommended that you test various ice incubation times and stain for alpha-tubulin to confirm that the MT network is completely disassembled. For RPE1 cells, we and others have determined that 40 min is sufficient to disassemble the entire MT network (Rivero et al., 2009; Vinogradova et al., 2012).
24.2.3 Immunofluorescence
Using the pre-chilled methanol (see Section 24.2.2), immerse the coverslip into the fixative immediately after completion of ice recovery. The coverslip should be carefully lifted from the dish (at either room temperature or 37 °C), with forceps, and placed cell-side facing up into the fixation solution. Ensure that the coverslip is completely covered in methanol (i.e., not floating) by gently pressing on the edge of the coverslip with forceps. Incubate the coverslip in methanol at −20 °C for 5 min, then immediately wash three times with 1× PBS. During the wash steps, be sure not to expose the cells to air by keeping a small amount of PBS in the 12-well plate at all times. Following methanol fixation, it is important to keep the coverslip in PBS for a minimum of 1 h to allow for rehydration of the cells after fixation.
To prepare for immunofluorescence, adhere a piece of parafilm to the bottom of a plastic box. Then, place a slightly damp Kimwipe in the lid of the box to create a humid chamber. Be sure to check that the Kimwipe is moist throughout the immunofluorescence procedure and remoisten if necessary.
For the blocking step, place 18 μL drops of blocking solution (see Step 5 in Section 24.1.3) onto the parafilm. Using forceps, carefully transfer the coverslip from the PBS wash (in the 12-well plate) onto the blocking solution with the cell-side facing down; this will allow for the cells to be in contact with the blocking solution. Incubate 40 min to 1 h at room temperature.
For all steps of immunofluorescence carried out within the parafilm-lined plastic box, it is important that the coverslip be floating on top of the droplet of solution (e.g., block or antibody) so the glass surface with cells is completely exposed to the solution. The cell-side of the coverslip should not touch the parafilm or be exposed to air and should never be pressed down, which may damage the cells.
Next, place 18 μL drops of primary antibody solution onto clean parafilm and transfer the coverslip onto the primary antibody solution using the same procedure described above. Incubate for 1 h at room temperature. For longer incubation times, place the plastic box at 4 °C. To wash, immerse the coverslip in a 12-well plate containing approximately 3 mL of 1× PBS with the cell-side facing up; wash three times for 5 min each, using fresh PBS each time.
For the secondary antibody incubation, repeat the same procedure and wash steps described for the primary antibody and protect the coverslip from light by covering the plastic box with aluminum foil or placing it in a closed desk drawer.
To mount the coverslip, place a drop of mounting medium (see Step 8 in Section 24.1.3) onto a clean glass microscope slide. Then, using forceps, invert the coverslip onto the mounting medium with the cell-side face down. Use a Kim-wipe to wick away any excess mounting media from the sides of the coverslip. Keep the newly prepared slide at room temperature over night or 37 °C for 1 h, protected from light, to allow for the mounting medium to set. Lastly, seal the edge of the coverslip with clear nail polish to prevent it from moving during image acquisition. It is important to use clear nail polish as some colored nail polishes can fluoresce under imaging conditions, which will result in poor image quality.
After the nail polish has dried, to prepare the sample for image acquisition it is important to carefully clean the surface of the coverslip with ethanol to remove residual dried PBS. The samples are now ready for examination on the microscope. For long-term storage, keep samples at −20 °C protected from light.
Please note that the volumes outlines in this immunofluorescence procedure (18 μL drops of the appropriate solution) have been optimized in our lab for use with 12 mm coverslips (see Step 1 in Section 24.1.3). This procedure can also be used with coverslips of varying sizes; however, the volumes listed above must be adjusted accordingly. Importantly, this “drop” procedure for immunofluorescence should be considered as an alternative to traditional methods because it requires only small volumes of each reagent and is, therefore, an extremely cost-effective method that provides excellent sample quality.
24.2.4 Image acquisition
Because you will be looking at structures that are below optical resolution, it is important to use the highest resolution possible when acquiring data for analysis of MT nucleation after ice recovery. We recommend the use of a high-resolution 100× objective lens with an NA of at least 1.4 (see Step 2 in Section 24.1.4). In addition, we recommend that you acquire confocal slices from individual channels sequentially to allow for the best separation of fluorescence in neighboring channels and to enhance image quality.
In order to monitor all MTs nucleated in 3D, it is important to acquire Z-stack confocal images of the entire cell. As a starting point, we recommend using 0.2 μm slices for optimal resolution in Z; however, the Z interval may need to be adjusted based on cell type and microscope system.
24.2.5 Analysis of MT nucleation and MT subpopulations
ImageJ, or any other appropriate software, can be used for image processing. To analyze MT nucleation at MTOCs following ice recovery experiments, colocalization between MT minus ends and the MTOC of interest must be examined in 3D. This can be achieved by examining a stack of confocal slices or by creating a 3D reconstruction from the stack. Quantification of colocalization is done manually by counting the instances where one end of an MT can be seen touching either a centrosome or a Golgi stack (for examples of colocalization, see Fig. 24.3). If desired, colocalization can be detected by software, although algorithms that combine detection of colocalization and automated detection of single MTs are not readily available.
Z-stack images are projected, individually for each channel acquired, using a maximum intensity projection algorithm. Individual channels can then be contrasted and overlaid to analyze colocalization between MTs and your subcellular structure of interest.
For the example of centrosomal and Golgi-derived MTs: The position of the centrosome can be identified as a single spot with high fluorescence intensity (visualized with Centrin-GFP) and a diameter of less than 1 μm (Zhu & Kaverina, 2011). After ice recovery, MTs clearly emanating from this location can be considered nucleated from the centrosome and are hence centrosomal MTs. Similarly, a Golgi marker can be used to determine MTs nucleating from the Golgi (visualized with an anti-GM130 antibody), which are then considered to be Golgi-derived MTs. Other subcellular structures can also be examined using specific markers, respectively (Figs. 24.2 and 24.3).
FIGURE 24.2.
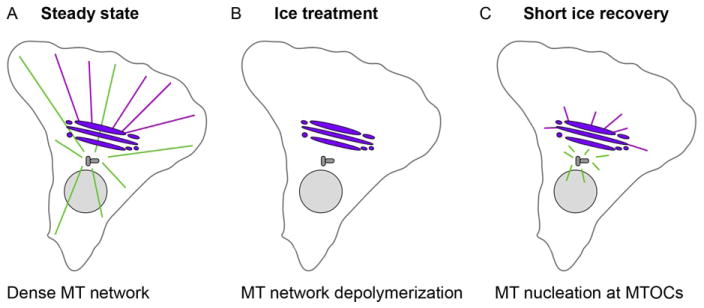
Microtubule network organization during the steps of the ice recovery assay. (A–C) Schematic showing organization of the microtubule network during main steps of the ice recovery assay. (A) At steady state, the dense MT network obscures MT nucleation events at MTOCs (centrosome and Golgi). (B) Upon ice treatment, the entire MT network undergoes depolymerization. (C) Short ice recovery times permit MT nucleation and repolymerization allowing for the clear detection of MT nucleation events at multiple MTOCs. (A–C) MTs nucleated at the centrosome (gray) are shown in green, while Golgi-derived MTs are shown in magenta emanating from the Golgi (purple).
24.3 DISCUSSION
The above outlined procedure, for detection of Golgi-derived MTs using an ice recovery assay, is a simple and invaluable tool for discovery and characterization of non-centrosomal MTOCs. Ice recovery, along with other techniques, has been monumental in the establishment of the Golgi complex as a major noncentrosomal MTOC and has allowed the scientific community to begin to elucidate the unique roles that such nontraditional MTOCs play within the cell. Our assay allows for the clear detection of individual MT nucleation events, which can be difficult to detect by other means because they occur both transiently and on a scale below optical resolution.
An additional advantage of this ice recovery protocol is that it does not require the use of MT drugs, such as nocodazole. Nocodazole can have unknown off-target effects within the cell and, in comparison, ice recovery is a more physiological treatment. Also, the use of nocodazole alone makes it difficult to study MT nucleation in mitotic cells, which form aberrant spindles and exit mitosis upon exposure to the drug (Jordan, Thrower, & Wilson, 1992). Cold-treated cells, in contrast, are preserved at distinct stages of mitosis so that comparison of Golgi-derived MT numbers can be performed (Maia et al., 2013). Moreover, recovery after ice, or a combination of ice and nocodazole treatments, can be used to detect other noncentrosomal MTs formed at distinct mitotic stages (e.g., augmin-dependent central spindle MTs, Uehara & Goshima, 2010).
On the other hand, manual analysis of the colocalization between the ends of newly nucleated MTs and MTOCs is tedious and time-consuming. Development of easily accessible image analysis software would be beneficial to those hoping to utilize this method. Such software would require an automated detection algorithm that recognizes MTs as single entities of distinct shape and detects colocalization of their ends with a Golgi marker. Automated analysis would likely require shorter recovery times in order to avoid MT overlapping.
Another negative of this assay is that it requires a fairly advanced confocal imaging system for the 3D detection of colocalization between MTs and the MTOC of interest. Because MT nucleation at an MTOC occurs below optical resolution, the best imaging equipment available is necessary to properly detect these events. In addition, at least three laser excitation lines are required to capture data on MTs, the centrosome, and your noncentrosomal MTOC, in our example, the Golgi complex.
An alternative method to the simple ice recovery assay is live cell imaging of cells expressing a +TIP marker and a Golgi marker. Microtubule plus-end tracking proteins (+TIPs) are a diverse group of proteins that track MT plus-ends as they grow (Akhmanova & Steinmetz, 2008). Near the MTOC, +TIPs only localize to the tips of newly nucleated MTs and move away from the MTOC as the MT polymerizes outwards. Expression of a +TIP protein, for example, EB3-GFP, in any cell type allows tracking of MTs as they are nucleated from either the centrosome or noncentrosomal MTOCs. This can be done either at steady state or over the course of either ice recovery or a nocodazole washout experiment.
At steady state, this alternative method allows for the identification of MT nucleation sites within the cell without modifying the MT network organization. However, as mentioned previously, the close proximity of the Golgi complex to the centrosome can make it difficult to monitor nucleation at the Golgi even when utilizing a clear marker of nucleation, such as a +TIP protein. For this type of experiment, the best way to improve detection of Golgi-derived MT nucleation events is to image cells in which the centrosome and the Golgi complex are physically separated within the intracellular space. Alternatively, when this is not possible, MTs can be depolymerized by your chosen method and allowed to undergo regrowth for the detection of nucleation in the absence of obstruction from the MT network. The use of a +TIP marker has been a common approach to track steady-state MT nucleation at centrosomes (e.g., Piehl, Tulu, Wadsworth, & Cassimeris, 2004) and in our lab to detect noncentrosomal MT nucleation at the Golgi in both steady state and upon nocodazole wash-out (Efimov et al., 2007). Our lab’s detailed protocol of how to use a +TIP marker in conjunction with live cell imaging to study nucleation of Golgi-derived MTs can be found in Microtubule Dynamics: Methods and Protocols (Zhu & Kaverina, 2011).
We hope that our ice recovery assay, as well as our recommendations for optimal image acquisition and analysis of MT nucleation events, proves useful in guiding your detection of Golgi-derived MTs or in your studies of additional noncentrosomal MTOCs. We believe that this method can be employed throughout the cell biology community for the examination of nucleation at MTOCs and serve as a platform for the development of improved techniques in the future.
SUMMARY
Ice recovery followed by immunofluorescence is a unique method to detect nucleation of Golgi-derived microtubules at the nonconventional MTOC, the Golgi complex. Disassembly of the microtubule network during ice treatment allows for the clear separation of MTs nucleated at the centrosomes in comparison to alternative MTOCs, which cannot be readily observed under steady-state conditions. The protocol outlined here provides a detailed guide for sample preparation, ice treatment, and recovery, as well as immunofluorescence, image acquisition, and analysis. Our method for detection of MT nucleation at the Golgi is fairly straightforward, inexpensive, and reliable. Therefore, we believe that this method can be applied for the novel discovery of additional noncentrosomal MTOCs and their functional characterization.
Acknowledgments
This work was supported by National Institutes of Health grant R01-GM078373 and by American Heart Association grant-in-aid 10GRNT4230026 (to I. K.) as well as American Heart association predoctoral fellowship 12PRE12040153 (to A. D. G.). M. F. was supported by the Vanderbilt International Scholar Program.
Footnotes
Author Contributions: A. D. G. cowrote the chapter. M. F. performed ice recovery and immunofluorescence experiments for Fig. 24.3. I. K. directed all of the work and project planning and cowrote the chapter.
References
- Akhmanova A, Steinmetz MO. Tracking the ends: A dynamic protein network controls the fate of microtubule tips. Nature Reviews Molecular Cell Biology. 2008;9:309–322. doi: 10.1038/nrm2369. [DOI] [PubMed] [Google Scholar]
- Bergen LG, Kuriyama R, Borisy GG. Polarity of microtubules nucleated by centrosomes and chromosomes of Chinese hamster ovary cells in vitro. Journal of Cell Biology. 1980;84:151–159. doi: 10.1083/jcb.84.1.151. [DOI] [PMC free article] [PubMed] [Google Scholar]
- Chabin-Brion K, Marceiller J, Perez F, Settegrana C, Drechou A, Poüs C. The Golgi complex is a microtubule-organizing organelle. Molecular Biology of the Cell. 2001;12:2047–2060. doi: 10.1091/mbc.12.7.2047. [DOI] [PMC free article] [PubMed] [Google Scholar]
- Efimov A, Kharitonov A, Efimova N, Loncarek J, Miller PM, Andreyeva N, et al. Asymmetric CLASP-dependent nucleation of noncentrosomal microtubules at the trans-Golgi network. Developmental Cell. 2007;12:917–930. doi: 10.1016/j.devcel.2007.04.002. [DOI] [PMC free article] [PubMed] [Google Scholar]
- Egea G, Lazaro-Dieguez F, Viella M. Actin dynamics at the Golgi complex in mammalian cells. Current Opinion in Cell Biology. 2006;18:168–178. doi: 10.1016/j.ceb.2006.02.007. [DOI] [PubMed] [Google Scholar]
- Jordan MA, Thrower D, Wilson L. Effects of vinblastine, podophyllotoxin and nocodazole on mitotic spindles. Implications for the role of microtubule dynamics in mitosis. Journal of Cell Science. 1992;102:401–416. doi: 10.1242/jcs.102.3.401. [DOI] [PubMed] [Google Scholar]
- Ladinsky MS, Wu CC, McIntosh S, McIntosh JR, Howell KE. Structure of the Golgi and distribution of reporter molecules at 20 degrees C reveals the complexity of the exit compartments. Molecular Biology of the Cell. 2002;13:2810–2825. doi: 10.1091/mbc.01-12-0593. [DOI] [PMC free article] [PubMed] [Google Scholar]
- Lowe M. Structural organization of the Golgi apparatus. Current Opinion in Cell Biology. 2011;23:85–93. doi: 10.1016/j.ceb.2010.10.004. [DOI] [PubMed] [Google Scholar]
- Maia AR, Zhu X, Miller P, Gu G, Maiato H, Kaverina I. Modulation of Golgi-associated microtubule nucleation throughout the cell cycle. Cytoskeleton. 2013;70:32–43. doi: 10.1002/cm.21079. [DOI] [PMC free article] [PubMed] [Google Scholar]
- Miller PM, Folkmann AW, Maia ARR, Efimova N, Efimov A, Kaverina I. Golgi-derived CLASP-dependent microtubules control Golgi organization and polarized trafficking in motile cells. Nature Cell Biology. 2009;11:1069–1080. doi: 10.1038/ncb1920. [DOI] [PMC free article] [PubMed] [Google Scholar]
- Ori-McKenney KM, Jan LY, Jan YN. Golgi outposts shape dendrite morphology by functioning as sites of acentrosomal microtubule nucleation in neurons. Neuron. 2012;76:921–930. doi: 10.1016/j.neuron.2012.10.008. [DOI] [PMC free article] [PubMed] [Google Scholar]
- Piehl M, Tulu US, Wadsworth P, Cassimeris L. Centrosome maturation: Measurement of microtubule nucleation throughout the cell cycle by using GFP-tagged EB1. Proceedings of the National Academy of Sciences of the United States of America. 2004;101:1584–1588. doi: 10.1073/pnas.0308205100. [DOI] [PMC free article] [PubMed] [Google Scholar]
- Rivero S, Cardenas J, Bornens M, Rios RM. Microtubule nucleation at the cis-side of the Golgi apparatus requires AKAP450 and GM130. The EMBO Journal. 2009;28:1016–1028. doi: 10.1038/emboj.2009.47. [DOI] [PMC free article] [PubMed] [Google Scholar]
- Salaycik KJ, Fagerstrom CJ, Murthy K, Tulu US, Wadsworth P. Quantification of microtubule nucleation, growth and dynamics in wound-edge cells. Journal of Cell Science. 2005;118:4113–4122. doi: 10.1242/jcs.02531. [DOI] [PubMed] [Google Scholar]
- Uehara R, Goshima G. Functional central spindle assembly requires de novo microtubule generation in the interchromosomal region during anaphase. Journal of Cell Biology. 2010;191:259–267. doi: 10.1083/jcb.201004150. [DOI] [PMC free article] [PubMed] [Google Scholar]
- Vaughan KT. Microtubule plus ends, motors and traffic of Golgi membranes. Biochimica et Biophysica Acta. 2005;1744:316–324. doi: 10.1016/j.bbamcr.2005.05.001. [DOI] [PubMed] [Google Scholar]
- Vinogradova T, Miller PM, Kaverina I. Microtubule network asymmetry in motile cells. Cell Cycle. 2009;8:2168–2174. doi: 10.4161/cc.8.14.9074. [DOI] [PMC free article] [PubMed] [Google Scholar]
- Vinogradova T, Paul R, Grimaldi AD, Loncarek J, Miller PM, Yampolsky D, et al. Concerted effort of centrosomal and Golgi-derived microtubules is required for proper Golgi complex assembly but not for maintenance. Molecular Biology of the Cell. 2012;23:820–833. doi: 10.1091/mbc.E11-06-0550. [DOI] [PMC free article] [PubMed] [Google Scholar]
- Zhai Y, Borisy GG. Quantitative determination of the proportion of microtubule polymer present during mitosis-interphase transition. Journal of Cell Science. 1994;107:881–890. doi: 10.1242/jcs.107.4.881. [DOI] [PubMed] [Google Scholar]
- Zhu X, Kaverina I. Quantification of asymmetric microtubule nucleation at subcellular structures. In: Walker JM, Straube A, editors. Methods in molecular biology: Vol. 777. Microtubule dynamics: Methods and protocols. New York: Humana Press; 2011. pp. 235–244. [DOI] [PMC free article] [PubMed] [Google Scholar]