

Abstract
Background
The Bypass Angioplasty Revascularization Investigation 2 Diabetes trial demonstrated similar long-term clinical effectiveness of revascularization (REV) and intensive medical (MED) therapy. Comparisons of post-intervention ischemic burden have not been explored but are relevant to treatment decisions. This study examined differences in 1-year stress myocardial perfusion SPECT (MPS) abnormalities by randomized treatment.
Methods
MPS was performed in 1,505 patients at 1-year following randomization. MPS images were analyzed (masked to treatment) by a Nuclear Core Laboratory using a quantitative percent (%) of total, ischemic, and scarred myocardium. Cox proportional hazards models were used to estimate the relationship between MPS variables and trial endpoints.
Results
At 1-year, nearly all REV patients underwent the assigned procedure; while 16% of those randomized to MED received coronary REV. Patients randomized to REV exhibited fewer stress perfusion abnormalities than MED patients (P < .001). CABG patients had more frequent ischemic and scarred myocardium encumbering ≥5% of the myocardium when compared to those receiving PCI. Patients randomized to MED had more extensive ischemia and the median % of the myocardium with perfusion abnormalities was lower following REV (3% vs 9%, P = .01). A total of 59% of REV patients had no inducible ischemia at 1-year compared to 49% of MED patients (P < .001). Within the CABG stratum, those randomized to MED had the greatest rate of ischemic (P = .032) and scarred (P = .017) perfusion abnormalities. At 1-year, more extensive and severe stress myocardial perfusion abnormalities were associated with higher 5-year rates of death and a combined endpoint of cardiac death or myocardial infarction (MI) rates (11.3%, 8.1%, 6.8%, for ≥10%, 5%-9.9%, and 1-4.9% abnormal myocardium at stress, respectively, P < .001). In adjusted models, selected MPS variables were significantly associated with an increased hazard of cardiac death or MI (hazard ratio = 1.11 per 5% increase in abnormal myocardium at stress, P = .004).
Conclusions
Patient management strategies that focus on ischemia resolution can be useful to guide the efficacy of near-term therapeutic approaches. A 1-year post-therapeutic intervention myocardial perfusion scan provides important information regarding prognosis in stable CAD patients with diabetes. (J Nucl Cardiol 2012;19:658–69.)
Keywords: Diabetes, clinical trials, myocardial perfusion imaging, ischemia
Introduction
Recent randomized clinical trials confirm equivalent long-term clinical outcomes for stable coronary artery disease (CAD) patients treated with intensive medical (MED) management with or without coronary revascularization (REV).1,2 In patients with type-2 diabetes, despite the high CAD mortality risk,3 the Bypass Angioplasty Revascularization Investigation 2 Diabetes (BARI 2D) trial reported no difference in the primary outcome of event-free survival between patients assigned to a strategy of MED therapy as compared to prompt coronary REV (87.8% vs 88.3%, P = .97).1 The results from BARI 2D support previous trial findings highlighting the effectiveness of first line, MED therapy approaches for stable CAD patients.1,2 Yet, the extent to which randomized treatment results in a differential extent and severity of residual ischemia has yet to be fully explored. Moreover, it is unknown whether the effectiveness of therapeutic risk reduction strategies may be confounded by the extent and the severity of residual ischemia documented early after the initiation of randomized treatment. From hypothesis-generating data in the Clinical OUtcomes following Revascularization and Aggressive druG Evaluation (COURAGE) trial substudy, there was a greater reduction in the extent and severity of ischemia at 1-year following randomization to REV than MED with results suggesting that normalization of ischemic abnormalities trended toward improved event-free survival.4 The aim of this study was to examine the prognostic utility and differential therapeutic risk reduction by the extent and the severity of stress myocardial perfusion SPECT (MPS) abnormalities and post-stress left ventricular ejection fraction (LVEF) at 1 year following randomization in type-2 diabetic patients with stable CAD.
Trial Methods
Eligibility Criteria
Stable CAD patients with type-2 diabetes were enrolled in the BARI 2D trial from January 2001 through March 2005.1 Details of patient enrollment and eligibility criteria can be found in the main trial results.1 In brief, eligible patients were those with a diagnosis of type-2 diabetes and documented stable CAD who were candidates for elective REV by either percutaneous coronary intervention (PCI) or coronary-artery bypass grafting (CABG). Patients were excluded under the following circumstances: urgent or emergent REV or significant left main CAD, creatinine >2.0 mg/dL, glycated hemoglobin >13.0%, class III or IV heart failure, hepatic dysfunction, or prior REV ≤1 year.
Randomized Treatment Strategies
Patients were randomized to two-treatment strategies for CAD and type-2 diabetes: (1) MED combined with prompt REV or MED alone and (2) Insulin-sensitization therapy or insulin-provision therapy to achieve a target glycated hemoglobin level of <7.0%.1 Randomization was stratified by the REV method (PCI or CABG) determined by their physician as the more appropriate therapy. REV was largely performed ≤1 month of randomization. REV in the MED patients was deemed appropriate when progressive, refractory angina, or an acute coronary syndrome or severe ischemia occurred.1
Patients were treated according to contemporary secondary prevention and diabetes control guidelines with the following targets: glycated hemoglobin of <7.0%, a low-density lipoprotein cholesterol level of <100 mg/dL, and blood pressure of ≤130/80 mm Hg.6-8 In addition, counseling regarding smoking cessation, weight loss, and regular exercise was included in lifestyle recommendations. Patients had an office visit monthly for the first 6 months and then each 3 months thereafter.1
Core Nuclear Laboratory
The stress MPS protocol and core laboratory procedures were previously described in detail.5 In brief, diabetic patients enrolled in the BARI 2D trial were recommended a 1-year stress MPS, if clinically feasible. One-year nuclear data was defined as data collected between 6 and 24 months past randomization. Of the 2,368 patients randomized in BARI 2D trial, there were 1,578 nuclear tests in this time range. In cases where a patient had more than one nuclear test between 6 and 24 months past randomization (n = 73), only the first test was counted in the current analysis. In total, 1,505 patients had 1-year nuclear data. Nuclear imaging results were not blinded to the site physicians.
Stress Testing Protocol and Interpretation
All patients enrolled in this study underwent intravenous adenosine pharmacologic stress MPS using the standardized protocols from the American Society of Nuclear Cardiology.9-13 The gated MPS were analyzed masked to treatment assignment in the Nuclear Core Laboratory at the University of Alabama at Birmingham. The images were assessed visually and applying automated methods. The MPS variables collected were included: LVEF, wall motion abnormalities, total stress perfusion abnormality extent and severity, ischemia (reversible defects) extent and severity, as well as scar (fixed defects) extent and severity. The 17-segment model was used to examine perfusion and regional function (wall motion and thickening). A score of 0-3 was used to depict regional tracer uptake (3 = normal, 2 = mild reduction, 1 = moderate reduction, and 0 = severe reduction or absent activity). A normal image had a total score of 51. The extent of any perfusion abnormality, ischemia, or scar was expressed by the number of segments with these abnormalities as well as by the summed stress score (SSS [scar plus ischemia]), summed rest score (SRS [scar]), and summed difference score (SDS [ischemia]). The total, ischemia, and scar were further analyzed using automated polar maps and expressed as % of left ventricular (LV) myocardium that is abnormal and assigned to one or more of the three major epicardial coronary territories
The LVEF was measured from the post-stress-gated images.
Trial Endpoints
The primary endpoint for this trial was all-cause mortality, and the principal secondary endpoint was a composite of death, myocardial infarction (MI), or stroke. The BARI 2D secondary outcome, a composite of cardiac death or MI, was included due to its common application in prognostic analyses with MPS. Definitions for end-points and ascertainment methods were provided in the main trial report.1 Periodic 12-lead electrocardiography was performed to identify silent MIs defined as a Q wave change of 2 grades according to the Minnesota code.1 MI was classified by an independent, Core Electrocardiography Laboratory masked to the randomized treatment assignment. Stroke and cause of death were adjudicated by an independent clinical events committee also masked to treatment assignment and MPS results.
Statistical Analyses
Means, standard deviations (SDs), and t test P values, and medians, interquartile ranges (IQRs), and Wilcoxon rank-sum P values are reported for normally and non-normally distributed continuous variables. Proportions and chi-square statistic P values are presented for categorical variables. Baseline demographic and clinical characteristics were compared for BARI 2D patients who underwent a 1-year MPS and those who did not. Clinical status and test results were compared at the time of the MPS for patients assigned to the REV and MED arms. All comparisons of stress test characteristics and clinical outcomes were performed on an intention-to-treat basis according to the randomized study-group assignment.1
Each MPS parameter was classified as an ordered categorical variable. For analyses of time-to-event outcomes, time 0 was defined as the date of the 1-year MPS. The association between the categorical nuclear parameters and the subsequent cardiovascular outcomes were assessed using Kaplan-Meier estimates and log-rank statistics. Cox proportional-hazards models were created to estimate the contribution of LVEF and the extent of perfusion abnormalities with and without adjusting for demographic and clinical risk factors. The statistical interaction between the MPS parameter and treatment group (REV vs MED) was tested in each Cox model to determine whether the effect of the MPS parameter differed by treatment assignment.
Results
Clinical Characteristics of Patients Undergoing MPS (Tables 1, 2)
Table 1. Pre-randomization, clinical characteristics of patients with and without 1-year stress MPS and by treatment to REV versus MED.
| Characteristic | 1-Year MPS (n = 1,505) |
No MPS (n = 863) |
P value | REV (n = 738) |
MED (n = 767) |
P value |
|---|---|---|---|---|---|---|
| Age, Mean, SD | 62.3, 8.7 | 62.5, 9.3 | .57 | 62.1, 8.7 | 62.5, 8.7 | .33 |
| Male | 72.5% | 66.7% | .003 | 72.2% | 72.8% | .79 |
| Race/ethnicity subsets | ||||||
| White, non-Hispanic | 69.2% | 60.2% | <.001 | 68.1% | 70.2% | .89 |
| Black, non-Hispanic | 13.2% | 23.1% | 13.8% | 12.6% | ||
| Hispanic | 12.6% | 12.5% | 13.0% | 12.2% | ||
| Asian | 4.6% | 3.5% | 4.5% | 4.6% | ||
| Other | 0.5% | 0.8% | 0.5% | 0.4% | ||
| HbA1c (%), mean, SD | 7.6, 1.6 | 7.7, 1.6 | .20 | 7.6, 1.6 | 7.6, 1.6 | .44 |
| Duration of diabetes, mean, SD | 10.2, 8.3 | 10.9, 9.3 | .07 | 9.9, 8.1 | 10.5, 8.4 | .20 |
| Insulin treatment | 26.3% | 30.6% | .02 | 26.5% | 26.2% | .90 |
| History of MI | 30.9% | 34.0% | .12 | 29.5% | 32.3% | .26 |
| History of heart failure | 5.1% | 9.4% | <.001 | 5.3% | 4.9% | .71 |
| CCS Class ≤6 weeks | ||||||
| No angina | 40.5% | 37.4% | .003 | 38.0% | 42.9% | .004 |
| Class 1-2 | 42.4% | 42.7% | 41.4% | 43.3% | ||
| Class 3-4 + unstable | 17.1% | 19.9% | 20.6% | 13.8% | ||
| Prior PCI | 18.9% | 20.9% | .22 | 19.5% | 18.2% | .50 |
| Prior CABG | 5.3% | 8.3% | .004 | 4.1% | 6.5% | .03 |
| Angiographic CAD | ||||||
| No stenosis ≥50% | 6.1% | 8.0% | .24 | 6.8% | 5.5% | .78 |
| 1 Vessel with ≥50% stenosis | 31.1% | 30.4% | 30.8% | 31.5% | ||
| 2 Vessels with ≥50% stenosis | 36.7% | 34.1% | 36.6% | 36.8% | ||
| 3 Vessels with ≥50% stenosis | 26.0% | 27.5% | 25.8% | 26.2% | ||
| Proximal left arterial descending | 13.0% | 13.6% | .71 | 12.8% | 13.2% | .79 |
| ≥50% stenosis | ||||||
| Angiographic EF<50% | 14.1% | 23.3% | <.001 | 13.9% | 14.1% | .92 |
SD, Standard deviation; MI, myocardial infarction; CCS, Canadian Cardiovascular Society; PCI, percutaneous coronary intervention; CABG, coronary-artery bypass graft.
Table 2. % of patients with a 1 year stress MPS by randomization strata.
| 1-Year MPS % (n) | P value | |
|---|---|---|
| Randomization | ||
| MED (n = 1,192) | 64.4% (767) | .42 |
| REV (n = 1,176) | 62.8% (738) | |
| Intended method of revascularization | ||
| PCI (n = 1,605) | 60.6% (973) | <.001 |
| CABG (n = 763) | 69.7% (532) | |
| PCI stratum | ||
| MED (n = 807) | 61.0% (492) | .77 |
| REV (n = 798) | 60.3% (481) | |
| CABG stratum | ||
| MED (n = 385) | 71.4% (275) | .30 |
| REV (n = 378) | 68.0% (257) | |
| Glycemic randomization | ||
| IP (n = 1,185) | 63.8% (756) | .81 |
| IS (n = 1,183) | 63.3% (749) | |
MED, Randomization to medical therapy; REV, randomization to MED plus coronary revascularization; PCI, percutaneous coronary intervention; CABG, Coronary artery bypass graft surgery; IP, randomization to insulin-providing; IS, randomization to insulin-sensitizing.
Patients undergoing 1-year nuclear imaging had a mean age of 62.3 years and duration of diabetes of approximately 10 years. They underwent nuclear imaging an average of 12.8 ± 2.4 months following randomization. Patients undergoing 1-year stress MPS were generally lower risk when compared to those not undergoing MPS (Table 1). When compared to patients not undergoing MPS, tested patients had less severe angina (P = .003) and heart failure (P <.001) and more preserved LVEF measurements (P<.001). Over 60% of patients undergoing MPS had angiographic multivessel CAD. Importantly, 1-year testing rates did not vary by randomization to MED versus MED overall (64.4% vs 62.8%, P = .42; Table 2), or within the PCI (P = .77) or CABG stratum (P = .30). Similarly, 1-year testing rates did not vary by glycemic randomization (P = .81).
Clinical Status and Gated Stress MPS Results at 1-Year Follow-up (Table 3)
Table 3. Nuclear stress test results and clinical symptoms at the time of testing.
| MED (N = 767) | REV (N = 738) | P value | |
|---|---|---|---|
| Revascularization since randomization | 16.2% | 97.8% | <.001 |
| Myocardial infarction since randomization | 3.8% | 5.4% | .002 |
| CCS class, at the time of testing | .06 | ||
| 0 | 57.8% | 64.8% | |
| 1-2 | 20.5% | 14.9% | |
| 3-4 | 1.5% | 1.1% | |
| Unstable + acute MI | 1.5% | 1.3% | |
| Unknown | 18.7% | 17.9% | |
| Adenosine stress myocardial perfusion SPECT results | |||
| Chest pain | 75.2% | 75.2% | .99 |
| Electrocardiographic changes | .63 | ||
| No ST depression | 66.1% | 67.9% | |
| Equivocal ST segment changes<1 mm | 19.4% | 17.3% | |
| ST segment depression ≥1 mm | 14.2% | 14.8% | |
| Post-stress LVEF, mean, SD | 58.6, 11.1 | 58.0, 11.9 | .31 |
| LVEF subsets | .23 | ||
| ≥50% | 82.2% | 80.3% | |
| 40%-49% | 12.2% | 11.8% | |
| <40% | 5.6% | 7.9% | |
| Any wall motion abnormality | 25.0% | 27.0% | .39 |
| Myocardial perfusion SPECT abnormalities | <.001 | ||
| 0 segments | 38.3% | 47.0% | |
| 1-2 segments | 17.5% | 13.4% | |
| 3-5 segments | 31.0% | 27.8% | |
| ≥6 segments | 13.2% | 11.8% | |
| Ischemia extent | <.001 | ||
| 0 segments | 48.8% | 58.8% | |
| 1-2 segments | 18.9% | 15.7% | |
| 3-5 segments | 24.3% | 21.4% | |
| ≥6 segments | 8.0% | 4.1% | |
| Territory of severely abnormal MPS | |||
| Left anterior descending | 24.4% | 21.4% | .17 |
| Right coronary artery | 34.9% | 28.4% | .007 |
| Left circumflex | 18.3% | 17.9% | .83 |
| Quantitative % myocardium | |||
| % Abnormal, median (25–75th %ile) | 9 (0–19) | 3 (0–12) | .01 |
| % Ischemic, median (25–75th %ile) | 2 (2–10) | 0 (0–7) | <.001 |
| % Scarred, median (25–75th %ile) | 0 (0–8) | 0 (0–1) | .85 |
| Semi-quantitative measures—summed scores | |||
| Summed stress score, mean, SD | 47.2, 4.8 | 47.3, 5.6 | .52 |
| Severe stress abnormality* | 61.5% | 52.9% | <.001 |
| Summed rest score, mean, SD | 49.3, 3.6 | 49.0, 4.7 | .08 |
| Severe rest abnormality* | 30.5% | 30.9% | .87 |
| Summed difference score (SDS), mean, SD | 2.2, 3.0 | 1.6, 2.7 | <.001 |
| Severe ischemia* | 51.0% | 41.1% | <.001 |
CCS, Canadian Cardiovascular Society; LVEF, left ventricular ejection fraction; MPS, myocardial perfusion SPECT.
Severe abnormalities defined semi-quantitatively as ≥10% of the myocardium.
After randomization but prior to MPS, nearly all (97.8%) the patients randomized to REV underwent the assigned procedure while 16% of those randomized to MED underwent a REV. Those randomized to REV more often had an inter current MI prior to MPS when compared to MED patients (5.4% vs. 3.8%, P = .002). REV patients exhibited a trend toward being angina-free while MED patients more often experienced Canadian Cardiovascular Society Class (CCS) I or II angina (P = .06).
At the time of MPS, patients randomized to REV exhibited fewer stress perfusion abnormalities as compared to MED patients (P < .001). The median quantitative % of the myocardium with stress perfusion abnormalities was 3% (IQR = 0%,12%) for REV and 9% (IQR = 0%,19%) for patients randomized to MED (P = .01). Similar differences in the % ischemic myocardium (P < .001) were observed. A total of 51% of MED patients had inducible ischemia at 1 year as compared to 41% of patients randomized to REV (P < .001).
A comparison of the frequency of mild and moderate-severe ischemia by intended REV stratum is reported in Figure 1 for the % ischemic and scarred myocardium. Patients in the CABG stratum had more frequent ischemic and scarred myocardium encumbering 5% of more of the myocardium when compared to those within the PCI stratum. Within the CABG stratum, those randomized to MED had the greatest rate of ischemic (P = .032) and scarred (P = .017) myocardial perfusion abnormalities. PCI patients had the lowest frequency of ischemic abnormalities.
Figure 1.
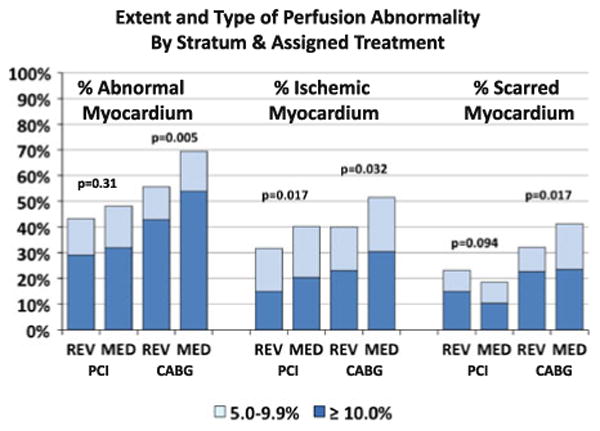
The proportion of patients with mild (5.0%-9.9%) and moderate severe (≥10%) perfusion abnormalities stratified by intended REV stratum and randomly assigned treatment. The P values correspond to the chi-square test for the distribution of perfusion abnormality categories between the assigned treatment groups (REV vs MED) within each stratum (PCI intended and CABG intended). The total percent abnormal myocardium is shown on the left, the percent ischemic myocardium in the center, and the percent scarred myocardium on the right.
A comparison of angiographic CAD by stress ischemia at 1 year is reported in Table 4. Nearly half of patients enrolled with 1 vessel CAD reported no ischemia at 1 year. By comparison, the majority of patients with multivessel CAD reported no or 1 vessel ischemia at 1 year.
Table 4. Comparison of baseline angiographic CAD extent prior as compared with 1 year ischemia extent by randomized treatment.
| Baseline angiographic CAD | Stress ischemia at 1 year | |||
|---|---|---|---|---|
|
| ||||
| None (%) | 1 Vessel (%) | 2 Vessels (%) | 3 Vessels (%) | |
| Medical therapy | ||||
| No CAD (n = 42) | 69.1 | 28.6 | 2.4 | 0.0 |
| 1 Vessel (n = 241) | 51.5 | 41.9 | 6.2 | 0.4 |
| 2 Vessels (n = 282) | 36.5 | 53.9 | 9.2 | 0.4 |
| 3 Vessels (n = 199) | 19.1 | 47.7 | 27.1 | 6.0 |
| Revascularization | ||||
| No CAD (n = 50) | 66.0 | 28.0 | 6.0 | 0.0 |
| 1 Vessel (n = 226) | 59.3 | 32.3 | 7.1 | 1.3 |
| 2 Vessels (n = 260) | 44.6 | 40.8 | 11.5 | 3.1 |
| 3 Vessels (n = 190) | 33.2 | 49.0 | 15.8 | 2.1 |
The bold values indicate less extensive ischemia than obstructive CAD extent. The shaded areas indicate concordant ischemia extent with obstructive CAD extent.
The distribution of the % ischemic and scarred myocardium in the MED and REV groups are shown in Figure 2. Patients with minimal ischemia frequently had extensive and severe scarring. No difference was reported in the relationship between ischemic and scarred myocardium according to the randomized treatment.
Figure 2.
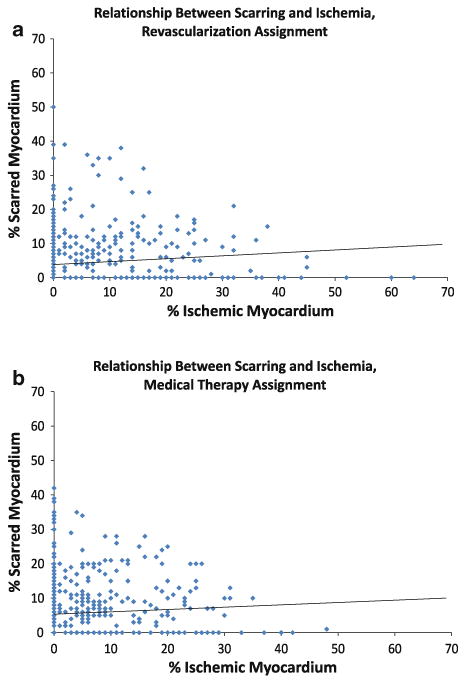
The scatter plot and linear regression line for percent scarred myocardium (y-axis) and percent ischemic myocardium (x-axis) among patients assigned to REV (A) and among patients assigned to MED (B).
Follow-Up Coronary REV (Figure 3)
Figure 3.
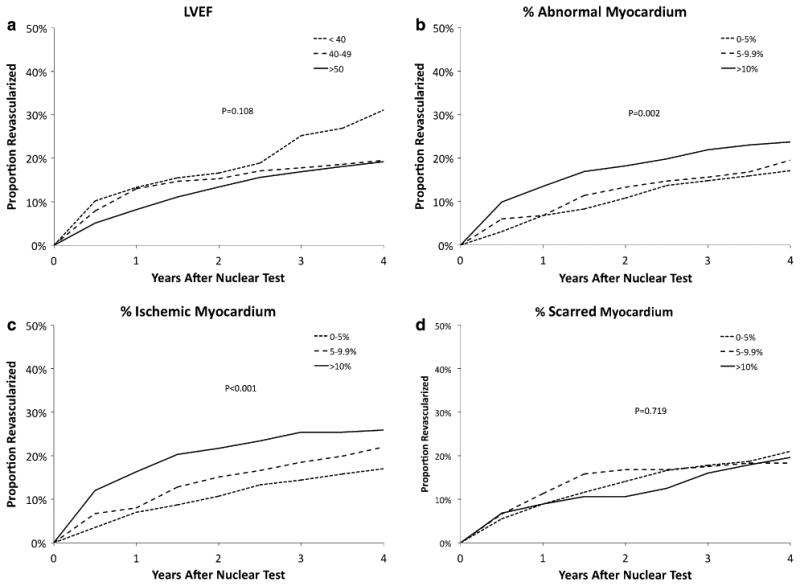
The Kaplan-Meier estimates of the cumulative percentage of patients receiving REV after the 1-year nuclear test according to the MPS parameters LVEF (A), percent abnormal myocardium (B), percent ischemic myocardium (C), and percent scarred myocardium (D).
Patients with worse LVEF had a greater likelihood of REV following MPS, yet this difference was not statistically significant (Figure 3A, P = .11). Among patients with 1-year MPS, a higher percentage of abnormal myocardium was associated with a greater likelihood of REV following stress testing (Figure 3B, P = .002). Similarly, there was a graded relationship between percent ischemic myocardium and an increased likelihood of REV (Figure 3C, P <.001); with no difference noted by the percent of scarred myocardium (Figure 3D, P = .72).
Primary and Secondary Endpoints
The average follow-up time after the nuclear test for BARI 2D patients was 4.4 years. A total of 153 deaths (58 were classified as cardiac in origin), 85 MIs, and 36 strokes were confirmed by adjudication.
Kaplan-Meier Estimated Event Rates by Post-stress LVEF and MPS Abnormalities (Table 5; Figure 4)
Table 5. Four-year event rates for death, death/MI/stroke and cardiac death/MI after 1-year nuclear test.
| Outcome | MPS predictor | MPS stratum | P value | ||
|---|---|---|---|---|---|
| Death | 0%–4.9% | 5%–9.9% | ≥10% | ||
| % Abnormal myocardium | 7.9 | 5.0 | 11.1 | .02 | |
| % Ischemic myocardium | 8.5 | 7.7 | 10.0 | .49 | |
| % Scarred myocardium | 7.5 | 9.7 | 13.4 | .01 | |
| ≥50% | 40%–49% | <40% | |||
| Post-stress LVEF | 7.6 | 10.0 | 16.6 | .002 | |
| Death/MI/stroke | 0%–4.9% | 5%–9.9% | ≥10% | ||
| % Abnormal myocardium | 13.6 | 10.9 | 16.9 | .02 | |
| % Ischemic myocardium | 14.9 | 12.1 | 15.0 | .87 | |
| % Scarred myocardium | 12.7 | 18.7 | 20.8 | .002 | |
| ≥50% | 40%–49% | <40% | |||
| Post-stress LVEF | 13.1 | 15.4 | 25.7 | .004 | |
| Cardiac death/MI | 0%–4.9% | 5%–9.9% | ≥10% | ||
| % Abnormal myocardium | 6.8 | 8.1 | 11.3 | .005 | |
| % Ischemic myocardium | 8.2 | 8.1 | 10.5 | .27 | |
| % Scarred myocardium | 7.1 | 12.9 | 13.1 | .002 | |
| ≥50% | 40%–49% | <40% | |||
| Post-stress LVEF | 7.9% | 7.9% | 17.2% | .01 |
Figure 4.
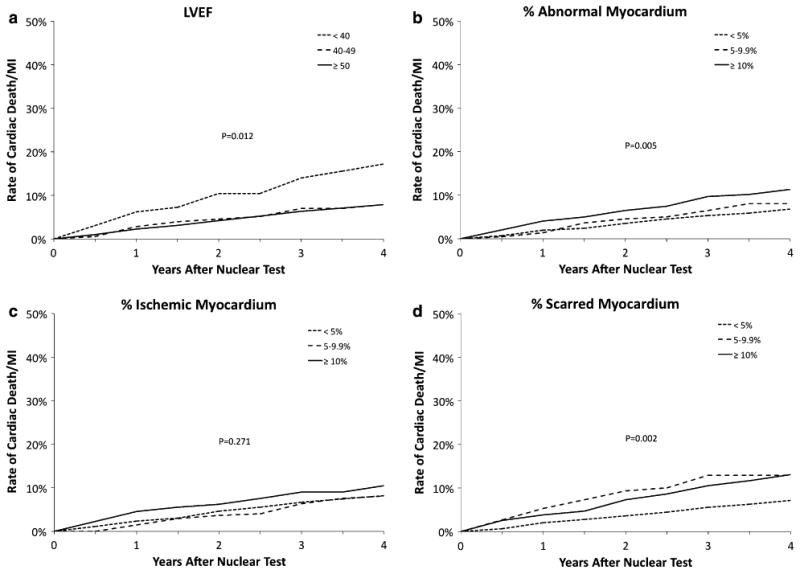
The Kaplan-Meier estimates of the risk of cardiac death or MI after the 1-year nuclear test according to the MPS parameters LVEF (A), percent abnormal myocardium (B), percent ischemic myocardium (C), and percent scarred myocardium (D).
There was a progressive association between the severity of the MPS results and the risk of cardiovascular events (Table 5). Patients with worse MPS results had higher rates of all-cause death as well as composite endpoints death, MI, or stroke and cardiac death or MI. Patients with post-stress LVEF ≥40% had lower rates of cardiac death or MI than those with post-stress LVEF <40% (7.9% vs 17.2%, P = .012, Figure 4A). The rate of cardiac death or MI was greater for patients with greater percentage of abnormal myocardium (Figure 4B, P = .005) and scarred myocardium (Figure 4C, P = .002), but not for patients with a greater percentage of ischemic myocardium (Figure 4D, P = .27). Figure 5 plots the cardiac death or MI-rates for patients with subsets of scarred and ischemic myocardium. Patients with ≥5% scarred myocardium had higher rates of cardiac death or MI including those with ≥5% ischemic myocardium (P = .001).
Figure 5.
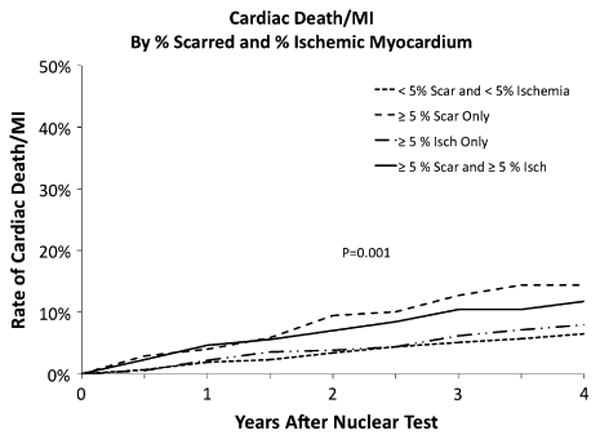
The Kaplan-Meier estimates of the risk of cardiac death or MI after the 1-year nuclear test for patients based on the combination of scarred and ischemic myocardium.
Models Estimating Cardiac Death or MI (Table 6)
Table 6. Cox proportional-hazards models estimating time to cardiac death or MI among patients undergoing MPS (n = 1,505).
| Predictor | Unadjusted | Adjusted for baseline risk factors* | Adjusted for baseline risk factors plus post-nuclear revascularization | |||
|---|---|---|---|---|---|---|
|
|
|
|
||||
| HR | P value | HR | P value | HR | P value | |
| Post-stress LVEF (per 5% decrease) | 1.08 | .082 | 0.98 | .711 | 0.98 | .748 |
| % Abnormal myocardium (per 5% increase) | 1.12 | <.001 | 1.11 | .004 | 1.12 | .003 |
| % Ischemic myocardium (per 5% increase) | 1.08 | .129 | 1.04 | .468 | 1.06 | .311 |
| % Scarred myocardium (per 5% increase) | 1.16 | <.001 | 1.16 | .002 | 1.16 | .002 |
Unadjusted model estimates the independent effects of each variable.
Model 1 simultaneously adjusts for baseline patient characteristics, trial characteristics, and LVEF.
Model 2 estimates independent effects of each nuclear predictor when simultaneously adjusting for baseline patient characteristics, trial characteristics, LVEF.
Age, gender, history of MI, history of CHF, number of diseased vessels, post-stress LVEF, intended REV randomization stratum, assigned glycemic treatment, assigned cardiac treatment.
The unadjusted and adjusted hazard ratios (HR) for the gated MPS variables are reported in Table 6. Patients with a greater percentage of abnormal and scarred myocardium had a greater hazard of cardiac death or MI. In particular, adjusting for baseline demographic and clinical factors as well as 1-year LVEF, the SRS (HR = 1.28 per 5 point decrease, P = .005), SSS (HR = 1.28 per 5 point decrease, P = .002), and the % of myocardium with abnormalities (HR = 1.11 per 5% increase, P = .004) and scar (HR = 1.16 per 5% increase, P = .002) were significant estimators of cardiac death or MI. There was no evidence that any of the associations between the MPS parameters and cardiac death or MI varied by the REV versus MED treatment assignment (all interactions P > .05; Table 7).
Table 7. Interactions with MED/REV assignment.
| First-order interactions | P value |
|---|---|
| LVEF * MED/REV | .16 |
| % Abnormal myocardium * MED/REV | .88 |
| % Ischemic myocardium * MED/REV | .44 |
| % Scarred myocardium * MED/REV | .55 |
When adjusting for covariates in Model 2, all P values for interactions between nuclear predictors and MED/REV were >.05.
The P value for an interaction between scar and ischemia is not significant in any models.
Discussion
The current results report on the 1-year stress MPS findings from the BARI 2D randomized clinical trial in patients with type-2 diabetes and stable CAD. Although the main trial results reported similar clinical outcomes based upon randomization to MED with or without REV (P = .97)1, the current results reveal that 1-year stress testing can be useful for assessing the near-term efficacy of comprehensive anti-ischemic treatment strategies. Most importantly, we report a near-term benefit of less ischemia with REV as compared to MED combined with prognostic findings which support the utility of the % scarred and abnormal myocardium as primary drivers of outcome. The % scarred myocardium was a powerful predictor of outcome and coincided with post-stress LVEF as a strong estimator of clinical outcomes. Notably, the impact of intermediate reduced MPS abnormalities on long-term cardiovascular outcomes did not vary by treatment strategy. These findings have implications for future trial designs and the integration of stress imaging to assess ischemia and guide decisions on the use of REV.
At the time of 1-year stress testing, differences by randomization were reported in the extent and the severity of MPS results. Applying both visual and quantitative measures, notable reductions in the rate and the extent of MPS abnormalities were observed with REV as compared to MED. Similar to previous reports,14 quantitative estimates of the % ischemic myocardium were markedly lower with REV as compared to MED. The median % ischemic myocardium was 2% (2%-10%) with MED and 0% (0%-7%) with REV (P < .001). Similarly, REV combined with MED in the COURAGE trial resulted in a greater reduction in the % ischemic myocardium.4 This pattern of ameliorating ischemia with REV should serve as the impetus for patient selection and provide physicians with the anticipated impact of REV on near-term MPS ischemic endpoints.
Importantly, the main trial results revealed that among patients with diabetes selected for CABG, significant improvements in cardiac death or MI were identified for patients assigned to a strategy of prompt REV when compared to those patients assigned to MED treatment.1 This same improvement in cardiovascular outcomes associated with REV compared with MED was not revealed for patients with diabetes selected for PCI. From the current analysis, we show that among patients identified for CABG, assignment to REV was associated with reduced frequency of mild to moderate-severe abnormal stress MPS and with less extensive and severe scarred myocardium when compared to MED. Similar to the main trial results, this finding was not observed for patients identified for PCI (Figure 1). Additionally, the higher % abnormal and scarred myocardium with MPS was associated with a higher relative hazard for cardiac death or MI and this heightened risk of cardiac events did not depend on whether REV (CABG or PCI) or MED treatment was selected. These findings suggest that the benefit of CABG (compared to MED) for reducing cardiac events might be partially attributed to a reduction in amount of the abnormal stress myocardium and, in particular, due to a reduction in scarred myocardium.
Our findings support that REV reduces ischemia but does not impact on prognosis for those with a sizeable burden of scarred (largely, infracted) myocardium. Long-term clinical outcomes were highly related to the % scarred myocardium more so than ischemia. The BARI 2D trial provided an exhaustive evaluation of important clinical outcomes including all-cause death, as the primary endpoint, and an array of secondary [(death, MI, or stroke) and (cardiac death or MI)] endpoints that were examined herein with the 1-year MPS results. A synthesis of the MPS findings reveals a pattern of outcome prediction that more often relates to burden of infarction including % scarred myocardium and post-stress LVEF in this diabetic population. Post-stress LVEF is a similar marker of the extent of infarcted myocardium and was highly predictive of the BARI 2D primary outcomes of all-cause death (P = .003) and death, MI, or stroke (P = .001). Additional MPS variables that serve as surrogates for infarcted myocardium include the % scarring and % abnormal myocardium at stress; both measures include infarcted plus fixed defect involvement. Cardiac death or MI rates ranged from 7% to 13% for patients with <5% and ≥5% scarred myocardium (P = .002). Similarly, Kaplan-Meier cardiac death or MI rates ranged from 6.8% to 11.3% for <5% to ≥10% abnormal myocardium at stress (P = .005). The lack of impact of randomized treatment on scarred myocardium and its associated worsening prognosis provides insight into the patient's residual risk at the time of 1-year MPS. By comparison, the % ischemic myocardium did not discriminate clinical outcomes yet served as an impetus for decisions regarding repeat or crossover REV. Given the high rate of REV for patients with moderate-severe ischemia encumbering 10% or more of the myocardium, it remains plausible that REV in this cohort may have impacted the prognostic findings.
Upon initial review, these results stand in contrast to the long-held concept of ischemia-guided intervention impacting on treatment decisions as well as outcome. However, an alternative proposal is that the guideline-accepted practice of ischemia-guided REV alters the natural history of ischemic risk. Traditional risk models examine the impact of non-revascularized patients when survival analyses are plotted. That is, patients are traditionally censored at the time of REV and, therefore, MPS survival curves from observational series plot survival in medically treated patients. However, within the BARI 2D trial, this concept of REV altering outcome is now extended to the powerful anti-ischemic medication armamentarium that is available to our CAD patients. Our paradigm operating within randomized trials, such as BARI 2D, is that any treatment that effectively aims at reducing ischemia will alter the natural history of MPS ischemic findings. This remains speculation on our part and is worthy of testing as a primary hypothesis. An application has currently been funded by the NIH-NHLBI to randomize patients with substantive ischemia (i.e., ≥10% of the myocardium) to catheterization-based treatment as compared to MED (International Study of Comparative Health Effectiveness with Medical and Invasive Approaches [ISCHEMIA] trial).
Two observational reports have reported a differential therapeutic benefit with treatment by the % of ischemic myocardium.15,16 These two reports focused on identifying a threshold beyond which risk reduction with REV was notable. These results revealed that patients with approximately 10% ischemic myocardium had a reduction in the relative hazard for death when compared to MED. Of course, interpretation of treatment selection based on observational findings is tenuous and the current results from a randomized trial cannot confirm these findings. We examined an array of MPS variables and their relationship with randomized treatment to MED versus REV. In every case, the prognostic models yielded non-significant findings (interaction P > .05). Our data suggest that the extent and the severity of ischemia prompt therapeutic intervention but do not show that this intervention leads to improved outcomes. Rather, these data support equipoise as to whether the extent and the severity of ischemia is a factor in therapeutic risk reduction or whether its utility lies in prompting therapeutic intervention.
Trial Limitations
The performance of a 1-year MPS was protocol directed yet performed in only 63.6% of enrolled patients. Data on pre-randomization ischemia were not available and could provide further insight into changes by randomized therapy and prognosis. BARI 2D employed a meticulous evaluation of the presence, extent, and severity of MPS abnormalities and LVEF measurements. The Core Laboratory measurements may be less influential on patient management and discordant with site interpretations. The current results reflect evaluation of the role of prognostication as well as randomized therapeutic differences. This study was underpowered to examine differences by randomized therapy; these results should be viewed as hypothesis-generating. Moreover, a higher rate of MI occurred prior to 1-year testing for patients randomized to REV and could have impacted on the reduced frequency of less extensive and severe ischemia when compared to MED therapy alone. The similarity in the extent of scarred myocardium by randomized treatment diminishes the strength of this pre-supposition. Detailed pre-randomization ischemia testing information is unavailable to provide definitive comparisons on temporal changes in ischemia and scarring. Despite this, the current results represent a sizeable improvement in the quality of evidence on risk stratification for stress MPS in patients with type 2 diabetes and chronic CAD.
Conclusion
The BARI 2D trial results reveal that REV is associated with near-term reductions in myocardial ischemia when compared to MED. A 1-year post-therapeutic intervention MPS provides important information regarding an intermediate outcome of the extent of residual ischemia in stable CAD patients with diabetes. Moreover, the 1-year MPS scan provides important information as to patient prognosis with markers of the burden of stress abnormalities and scarred myocardium as effective drivers of long-term outcome. These results support a dichotomy whereby ischemia may be an effective driver of therapeutic intervention while scarring may provide important clues as to patient long-term risk.
Acknowledgments
The Bypass Angioplasty Revascularization Investigation 2 Diabetes (BARI 2D) is funded by the National Heart, Lung and Blood Institute and the National Institute of Diabetes and Digestive and Kidney Diseases (U01 HL061744, U01 HL061746, U01 HL061748, U01 HL063804). BARI 2D receives significant supplemental funding from GlaxoSmithKline and additional funding from Lantheus Medical Imaging, Inc. (formerly Bristol-Myers Squibb Medical Imaging, Inc.), Astellas Pharma US, Inc., Merck & Co., Inc., Abbott Laboratories, Inc. and Pfizer, Inc. Medications and supplies were donated by Abbott Laboratories, Ltd., MediSense Products, Bayer Diagnostics, Becton, Dickinson, and company, J. R. Carlson Labs, Centocor, Inc., Eli Lilly and company, LipoScience, Inc., Merck Sante, Novartis Pharmaceuticals Corporation, and Novo Nordisk, Inc. Unrestricted grant support for the Nuclear Core Laboratory was provided by Astellas Healthcare and Lantheus Imaging.
Footnotes
This study is conducted for the BARI 2D Investigators.
References
- 1.Frye RL, August P, Brooks MM, Hardison RM, Kelsey SF, MacGregor JM, et al. A randomized trial of therapies for type 2 diabetes and coronary artery disease. N Engl J Med. 2009;360:2503–15. doi: 10.1056/NEJMoa0805796. [DOI] [PMC free article] [PubMed] [Google Scholar]
- 2.Boden WE, O'Rourke RA, Teo KK, Hartigan PM, Maron DJ, Kostuk WJ, et al. Optimal medical therapy with or without PCI for stable coronary disease. N Engl J Med. 2007;356:1503–16. doi: 10.1056/NEJMoa070829. [DOI] [PubMed] [Google Scholar]
- 3.Flaherty JD, Davidson CJ. Diabetes and coronary revascularization. JAMA. 2005;293:1501–8. doi: 10.1001/jama.293.12.1501. [DOI] [PubMed] [Google Scholar]
- 4.Shaw LJ, Berman DS, Maron DJ, Mancini GB, Hayes SW, Hartigan PM, et al. Optimal medical therapy with or without percutaneous coronary intervention to reduce ischemic burden: Results from the clinical outcomes utilizing revascularization and aggressive drug evaluation (courage) trial nuclear substudy. Circulation. 2008;117:1283–91. doi: 10.1161/CIRCULATIONAHA.107.743963. [DOI] [PubMed] [Google Scholar]
- 5.Iskandrian AE, Heo J, Mehta D, Tauxe EL, Yester M, Hall MB, et al. Gated SPECT perfusion imaging for the simultaneous assessment of myocardial perfusion and ventricular function in the BARI 2D trial: An initial report from the nuclear core laboratory. J Nucl Cardiol. 2006;13:83–90. doi: 10.1016/j.nuclcard.2005.10.002. [DOI] [PubMed] [Google Scholar]
- 6.Patel MR, Dehmer GJ, Hirshfeld JW, Smith PK, Spertus JA. ACCF/SCAI/STS/AATS/AHA/ASNC 2009 appropriateness criteria for coronary revascularization: A report by the American college of cardiology foundation appropriateness criteria task force, society for cardiovascular angiography and interventions, society of thoracic surgeons, American association for thoracic surgery, American heart association, and the American society of nuclear cardiology endorsed by the American society of echocardiography, the heart failure society of America, and the society of cardiovascular computed tomography. J Am Coll Cardiol. 2009;53:530–53. doi: 10.1016/j.jacc.2008.10.005. [DOI] [PubMed] [Google Scholar]
- 7.Thomas RJ, King M, Lui K, Oldridge N, Pina IL, Spertus J, et al. AACVPR/ACC/AHA 2007 performance measures on cardiac rehabilitation for referral to and delivery of cardiac rehabilitation/secondary prevention services endorsed by the American college of chest physicians, American college of sports medicine, American physical therapy association, canadian association of cardiac rehabilitation, european association for cardiovascular prevention and rehabilitation, inter-American heart foundation, national association of clinical nurse specialists, preventive cardiovascular nurses association, and the society of thoracic surgeons. J Am Coll Cardiol. 2007;50:1400–33. doi: 10.1016/j.jacc.2007.04.033. [DOI] [PubMed] [Google Scholar]
- 8.Smith SC, Jr, Allen J, Blair SN, Bonow RO, Brass LM, Fonarow GC, et al. AHA/ACC guidelines for secondary prevention for patients with coronary and other atherosclerotic vascular disease: 2006 update endorsed by the national heart, lung, and blood institute. J Am Coll Cardiol. 2006;47:2130–9. doi: 10.1016/j.jacc.2006.04.026. [DOI] [PubMed] [Google Scholar]
- 9.Holly TA, Abbott BG, Al-Mallah M, Calnon DA, Cohen MC, Difilippo FP, et al. Single photon-emission computed tomography. J Nucl Cardiol. 2010;17:941–73. doi: 10.1007/s12350-010-9246-y. [DOI] [PubMed] [Google Scholar]
- 10.Bokhari S, Ficaro EP, McCallister BD., Jr Adenosine stress protocols for myocardial perfusion imaging. J Nucl Cardiol. 2007;14:415–6. doi: 10.1016/j.nuclcard.2007.04.005. [DOI] [PubMed] [Google Scholar]
- 11.Tilkemeier PL, Cooke CD, Ficaro EP, Glover DK, Hansen CL, McCallister BD., Jr American society of nuclear cardiology information statement: Standardized reporting matrix for radio-nuclide myocardial perfusion imaging. J Nucl Cardiol. 2006;13:e157–71. doi: 10.1016/j.nuclcard.2006.08.014. [DOI] [PubMed] [Google Scholar]
- 12.Hendel RC, Wackers FJ, Berman DS, Ficaro E, DePuey EG, Klein L, et al. American society of nuclear cardiology consensus statement: Reporting of radionuclide myocardial perfusion imaging studies. J Nucl Cardiol. 2006;13:e152–6. doi: 10.1016/j.nuclcard.2006.08.013. [DOI] [PubMed] [Google Scholar]
- 13.Ficaro EP, Corbett JR. Advances in quantitative perfusion SPECT imaging. J Nucl Cardiol. 2004;11:62–70. doi: 10.1016/j.nuclcard.2003.10.007. [DOI] [PubMed] [Google Scholar]
- 14.Shaw LJ, Heller GV, Casperson P, Miranda-Peats R, Slomka P, Friedman J, et al. Gated myocardial perfusion single photon emission computed tomography in the clinical outcomes utilizing revascularization and aggressive drug evaluation (courage) trial, veterans administration cooperative study no. 424. J Nucl Cardiol. 2006;13:685–98. doi: 10.1016/j.nuclcard.2006.06.134. [DOI] [PubMed] [Google Scholar]
- 15.Hachamovitch R, Hayes SW, Friedman JD, Cohen I, Berman DS. Comparison of the short-term survival benefit associated with revascularization compared with medical therapy in patients with no prior coronary artery disease undergoing stress myocardial perfusion single photon emission computed tomography. Circulation. 2003;107:2900–7. doi: 10.1161/01.CIR.0000072790.23090.41. [DOI] [PubMed] [Google Scholar]
- 16.Hachamovitch R, Rozanski A, Hayes SW, Thomson LE, Germano G, Friedman JD, et al. Predicting therapeutic benefit from myocardial revascularization procedures: Are measurements of both resting left ventricular ejection fraction and stress-induced myocardial ischemia necessary? J Nucl Cardiol. 2006;13:768–78. doi: 10.1016/j.nuclcard.2006.08.017. [DOI] [PubMed] [Google Scholar]