

Abstract
Bedaquiline is a novel agent for the treatment of pulmonary multidrug-resistant Mycobacterium tuberculosis infections, in combination with other agents. The objective of this study was to develop a population pharmacokinetic (PK) model for bedaquiline to describe the concentration-time data from phase I and II studies in healthy subjects and patients with drug-susceptible or multidrug-resistant tuberculosis (TB). A total of 5,222 PK observations from 480 subjects were used in a nonlinear mixed-effects modeling approach. The PK was described with a 4-compartment disposition model with dual zero-order input (to capture dual peaks observed during absorption) and long terminal half-life (t1/2). The model included between-subject variability on apparent clearance (CL/F), apparent central volume of distribution (Vc/F), the fraction of dose via the first input, and bioavailability (F). Bedaquiline was widely distributed, with apparent volume at steady state of >10,000 liters and low clearance. The long terminal t1/2 was likely due to redistribution from the tissue compartments. The final covariate model adequately described the data and had good simulation characteristics. The CL/F was found to be 52.0% higher for subjects of black race than that for subjects of other races, and Vc/F was 15.7% lower for females than that for males, although their effects on bedaquiline exposure were not considered to be clinically relevant. Small differences in F and CL/F were observed between the studies. The residual unexplained variability was 20.6% and was higher (27.7%) for long-term phase II studies.
INTRODUCTION
Tuberculosis (TB) is a contagious bacterial infection caused by Mycobacterium tuberculosis that commonly affects the lungs but can also spread to other organs (1). In 2010, there were an estimated 11 to 14 million prevalent TB cases, and approximately 1.2 to 1.5 million people died from this curable disease in 2010 (2).
The increasing occurrence of multidrug-resistant TB (MDR-TB) and human immunodeficiency virus (HIV)-TB coinfection are important drivers of the TB epidemic. MDR-TB is defined as infection with a strain of M. tuberculosis that is resistant to at least the 2 first-line anti-TB drugs, isoniazid (INH) and rifampin (RIF) (and possibly other drugs). A recent survey of drug resistance showed that worldwide, 3.4% (95% confidence interval [CI], 1.9 to 5.0%) of all new TB cases and 19.8% (95% CI, 14.4 to 25.1%) of previously treated TB cases are MDR (3). Today, the magnitude of this global MDR-TB problem is unclear due to low levels of testing for drug resistance and poor curative services for MDR-TB patients, but according to WHO estimates, about 650,000 new cases of MDR-TB were identified in 2010 (3). Regions with the highest rates of MDR-TB coincide with the regions with the fastest-growing HIV epidemics (see http://www.who.int/mediacentre/factsheets/fs104/en/). Some MDR-TB cases are considered extensively drug resistant (XDR). XDR-TB is defined as being MDR-TB plus resistant to any fluoroquinolone and any one of the second-line anti-TB injectable drugs (amikacin [AMK], kanamycin [KAN], or capreomycin) (4). Worldwide, 9.4% (95% CI, 7.4 to 11.6%) of MDR-TB cases are XDR cases (3).
MDR-TB is considered curable but often requires extensive supervised chemotherapy (up to 2 years of treatment) with a combination of second-line drugs, and it is expensive to treat. Bedaquiline (formerly TMC207) is a diarylquinoline and novel antimycobacterial agent (5) that was recently approved by the FDA for the treatment of pulmonary MDR-TB in adults, in combination with other agents. Bedaquiline has a novel mode of action (specific inhibition of mycobacterial ATP synthase) (6) and represents a new class of anti-TB drugs. In vitro and in vivo studies have demonstrated that bedaquiline is primarily subjected to oxidative metabolism via CYP3A, leading to the formation of the N-monodesmethyl metabolite (M2), with only 0.01% of the dose excreted unchanged in the urine (6). The M2 metabolite is active against M. tuberculosis, although it is less potent than the parent drug (6).
In healthy subjects, bedaquiline displayed dose-proportional pharmacokinetics (PK) across a wide range of single and multiple oral doses from 10 to 700 mg (6). The relative bioavailability of bedaquiline was found to increase by approximately 2-fold when taken with food compared to that with administration under fasting conditions, and it was subsequently recommended to be taken with food. Bedaquiline displayed relatively slow absorption, with a median time to maximum concentration (Tmax) of 5 h, along with a multiphasic distribution and elimination profile with a prolonged terminal elimination half-life, which has been estimated to be about 5.5 months (6). The population PK of bedaquiline using limited data in 35 healthy subjects with PK sampling up to 14 days postdose has been described by a 3-compartment disposition model and a dynamic transit compartment absorption model (7). The purpose of this analysis was to describe the population PK of bedaquiline across a larger cohort of subjects with PK sampling up to 98 weeks postdose, as well as to identify potential covariates that may explain intersubject variability in bedaquiline exposure.
MATERIALS AND METHODS
Subjects.
Bedaquiline plasma concentration data were obtained from six clinical studies conducted in healthy adult volunteers and four clinical studies conducted in adult patients with drug-susceptible (DS)-TB and MDR-TB. A summary of these data, including dose regimen, formulation, number of subjects, and a short description of each study, is presented in Table 1. A total of 480 subjects (111 healthy volunteers and 369 patients with TB) were used to develop the population PK model, with a summary table of subject demographics shown in Table 2. The ages of the subjects ranged from 18 to 68 years (standard deviation [SD], 11.9 years), with weight ranging from 30 to 113 kg in a total of 331 male (69%) and 149 female (31%) subjects. The majority of the subjects were of black race (31.0%), with 27.9% of Caucasian race. The distribution of renal functions varied with estimated creatinine clearance (CLCR) (8), ranging from 39.8 to 227 ml/min. Ninety-nine subjects received the solution formulation (20.6%), with the majority of subjects receiving the tablet formulation (79.4%). The relative bioavailabilities of bedaquiline after single-dose administration in the solution or tablet formulation were comparable (data on file, Janssen Infectious Diseases BVBA, Beerse, Belgium).
TABLE 1.
Summary of clinical trials used for model development
| Study code | Study phase | Population | No. of subjects with TMC207 data | TMC207 dosea | Formulation | No. of PK samples per subject | Duration of sampling | No. of sexb | No. of race | Age range (yr) | Wt range (kg) | BMI range (kg/m2)c |
|---|---|---|---|---|---|---|---|---|---|---|---|---|
| CDE-102 | I | Healthy | 18 | 50, 150, or 400 mg QD for 14 days | Solution | 43 | Up to 7 days after last dose | 18 M | 16 Caucasian, 1 black, 1 other | 19–37 | 62.9–98.3 | 20.3–27.5 |
| C104 | I | Healthy | 22 | 400 mg QD for 10 days | Solution | 12 | Up to 24 h after last dose | 22 M | 21 Caucasian, 1 Hispanic | 18–38 | 63–101 | 21.3–29.5 |
| C109 | I | Healthy | 15 | 400 mg QD from days 1–11 | Solution | 13 | Up to 24 h after last dose | 15 M | 15 Caucasian | 26–55 | 60.9–97.1 | 19.6–29.3 |
| C110 | I | Healthy | 8 | 400 mg single dose | Tablet | 16 | Up to 14 days after dosing | 8 M | 6 Caucasian, 2 black | 20–54 | 68–103 | 20.4–29.4 |
| C111 | I | Healthy | 4 | 100 mg single dose | Tablet | 18 | Up to 28 days after dosing | 2 M, 2 F | 1 Caucasian, 3 black | 23–54 | 58–106 | 20.6–29.7 |
| C202 | IIa | DS-TB patients | 44 | 25, 100, or 400 mg QD for 7 days | Solution | 12 | Up to 24 h after last dose | 27 M, 17 F | 25 black, 19 other | 18–61 | 32–79 | 15–33.3 |
| C208 stage 1 | IIb | MDR-TB patients | 22 | 400 mg QD for the first 2 wk, 200 mg TIW for the following 6 wk | Tablet | Up to 43 (21 of 22 subjects with rich sampling) | Up to 98 wk after last dose | 17 M, 5 F | 13 black, 9 other | 18–57 | 37–75 | 14.1–26.9 |
| C208 stage 2 | IIb | MDR-TB patients | 76 | 400 mg QD for the first 2 wk, 200 mg TIW for the following 22 wk | Tablet | Up to 33 (34 of 76 subjects with rich sampling) | Up to 38 wk after last dose | 50 M, 26 F | 8 Caucasian, 27 black, 13 Hispanic, 9 Asian, 19 other | 18–63 | 37–81 | 14.8–32.4 |
| C209 | IIb | MDR-TB patients | 227 | 400 mg QD for the first 2 wk, 200 mg TIW for the following 22 wk | Tablet | Up to 11 (all sparse) | Up to 72 h after last dose | 146 M, 81 F | 56 Caucasian, 74 black, 89 Asian, 8 other | 18–68 | 30–113 | 13.1–36.8 |
| TBC1003 | I | Healthy | 44 | 800 mg single dose | Tablet | 12 | Up to 24 h after dosing | 26 M, 18 F | 11 Caucasian, 4 black, 27 Hispanic, 1 Asian, 1 other | 19–55 | 53–92 | 19.7–27.5 |
QD, once a day; TIW, three times a week.
M, male; F, female.
BMI, body mass index.
TABLE 2.
Demographic characteristics of the whole study population
| Characteristica | Age (yr) | Ht (m) | Wt (kg) | BMI (kg/m2)b | BSA (m2)c | CLCRd (ml/min) | Albumin level (g/liter) | TB type (no. [%])e | Race (no. [%])f | Sex (no. [%])g | HIV status (%) |
|---|---|---|---|---|---|---|---|---|---|---|---|
| n | 480 | 480 | 480 | 480 | 480 | 480 | 480 | 111 (23.1) no TB | 134 (27.9) Cauc | 331 (69.0) M | 438 (91.3) negative |
| Mean | 34.7 | 1.69 | 61.1 | 21.3 | 1.69 | 112 | 37.8 | 50 (10.4) DS | 149 (31.0) black | 149 (31.0) F | 35 (7.3) positive |
| SD | 11.9 | 0.104 | 14.3 | 3.9 | 0.223 | 28.1 | 7.84 | 160 (33.3) MDR-TB | 41 (8.5) Hisp | 7 (1.4) unknown | |
| CV (%) | 34.4 | 6.17 | 23.4 | 18.3 | 13.2 | 25 | 20.7 | 60 (12.5) pre-XDR | 99 (20.6) Asian | ||
| Median | 32.5 | 1.69 | 59 | 20.7 | 1.67 | 108 | 38 | 40 (8.3) XDR | 57 (11.9) other | ||
| Min | 18 | 1.44 | 30 | 13.1 | 1.16 | 39.8 | 15 | 59 (12.3) unknown | |||
| Max | 68 | 2.03 | 113 | 36.8 | 2.39 | 227 | 53 |
SD, standard deviation; CV, coefficient of variation; Min, minimum; Max, maximum.
BMI, body mass index.
BSA, body surface area.
CLCR, creatinine clearance (Cockcroft-Gault).
DS, drug sensitive; TB, tuberculosis; MDR-TB, multidrug-resistant tuberculosis; pre-XDR, pre-extensively drug resistant; XDR, extensively drug resistant.
Cauc, Caucasian; Hisp, Hispanic.
M, male; F, female.
Assay.
Bedaquiline was quantified in human plasma samples by liquid chromatography-tandem mass spectrometry (LC-MS/MS) after protein precipitation using a 2-in-1 assay as in the following description. Aliquots of 100 μl of plasma were spiked with an isotope-labeled internal standard, and proteins were precipitated with 2 aliquots of 200 μl of methanol or 70% ethanol (in case of infected patient samples). After centrifugation, the supernatant was analyzed by LC-MS/MS. Chromatography was performed on a 4.6 by 30 mm Polaris C18 column at a temperature of 40°C. The mobile phase was pumped at a flow rate of 1.5 ml/min and consisted of 25% 0.01 M ammonium formate (pH 4) (A)/75% methanol (B). The starting condition of 25% A to 75% B was held for 0.5 min and was followed by a step gradient to 2% A to 98% B, which was held for 3.1 min. Detection was performed by tandem MS using an API 3000 Sciex instrument with electrospray operating in positive ion mode. The following transitions were used for monitoring bedaquiline and the internal standards: bedaquiline, m/z 555.2 to 58.0, and internal standard, m/z 561.2 to 64.0. The range of the assay was 1.00 to 2,000 ng/ml. The assays were run at 2 different analytical laboratories and were validated according to FDA guidelines (9); all the acceptance criteria specified therein were met.
Population pharmacokinetic model development.
PK models were fitted to the data with the nonlinear mixed-effects modeling software NONMEM (version VII, level 2.0; Icon, Hanover, MD). The data were modeled using a log-transform-both-sides (LTBS) approach and first-order conditional estimation (FOCE) with interaction. Based upon the known multiphasic distribution of bedaquiline, 3- and 4-compartment distribution models were considered, along with a variety of input models, including single zero- and first-order inputs with and without an absorption lag time (Tlag), and dual-input models (zero-order, first-order sequential, and zero-order, zero-order sequential) following a Tlag.
Base model development.
The base model was selected using a variety of methods that evaluated the numerical stability and goodness of fit of the model to the data, by assessing the objective function value, parameter estimates and their respective relative standard errors (RSEs), and a range of graphical techniques.
Between-subject variability (BSV) was modeled as in equation 1:
| (1) |
where Pj represents the individual PK parameter for the jth individual, TVP represents the typical value of the pharmacokinetic parameter, and ηj represents the independent random variable, characterized by normal distribution with mean zero and variance ωp2, which corresponds to a log-normal distribution for Pj.
Residual unexplained variability (RUV) was modeled as an additive error, which corresponds to a proportional error when using an LTBS approach, such that (equation 2):
| (2) |
where ln(Cij) is the natural logarithm of the ith observation in the jth individual, ln(Ĉij) is the natural logarithm of the model prediction for the ith observation in the jth individual, and εij is the proportional RUV characterized by normal distribution with mean zero and variance σ2. Potential differences in the RUV between study phases were assessed by comparing the distributions of the conditional residuals across studies.
The effect of study was also assessed on relative bioavailability (F) during the development of the base model, and it was included as a descriptive covariate where required to account for variability that could not be assessed during covariate model development, such as treatment compliance and/or increased absorption due to food intake (6).
Covariate model development.
Following the development of the base model, a graphical assessment was undertaken to relate empirical Bayes estimates (“post hoc”) eta (η) values for apparent CL (CL/F) and apparent central volume of distribution (Vc/F) to covariates. A graphical approach was undertaken if eta shrinkage was <35% (10); otherwise, all covariates were evaluated on the parameter. Shrinkage was defined as in equation 3:
| (3) |
where SDηparameter is the standard deviation of the individual estimates of η for each parameter, and ω is the standard deviation of the typical estimation population variance.
The covariates considered were sex, race, body size, HIV coinfection status, TB type, baseline albumin, and creatinine clearance (CLCR) (calculated using the equation by Cockcroft and Gault [8]). The body size covariates included weight, body surface area (BSA) (11), and body mass index (BMI).
If two or more covariates were highly correlated, only the most clinically/biologically and practically relevant covariate was tested on the PK parameter in the analysis. The covariate model was built according to the following steps: (i) if a visually apparent relationship was identified between post hoc eta estimates and the covariate of interest, the covariates were added in a univariate manner to determine if they significantly improved the fit of the model to the data; (ii) any covariates in the univariate analysis that were deemed statistically significant based upon a change in objective function value (ΔOBJ) of ≥7.9 (P < 0.005) were retained for inclusion in a full model; (iii) all significant covariates from the univariate analysis were then included in the full model; (iv) a backwards elimination process was then performed in which covariates were deleted singly from the full model with the ΔOBJ computed from the reduced and full models. Covariates that were deleted from the full model without an associated increase in OBJ of ≥10.8 (P < 0.001) were sorted by OBJ, and the covariate with the smallest ΔOBJ was removed from the model. This process was repeated until no more covariates could be removed from the model. Continuous covariates were normalized to the population median values and modeled using equation 4.
| (4) |
where TVPi represents the model-predicted pharmacokinetic parameter (e.g., apparent clearance [CL/F]) for the typical individual with covariate value covi, Ppop represents the population central tendency for the pharmacokinetic parameter TVPi, covmed represents the population median value of the covariate, and θ represents a scale factor.
Categorical covariates, such as race and sex, were modeled as in equation 5:
| (5) |
where θ is the change in parameter relative to the reference subgroup, for example, for females (covi = 1) relative to males (covi = 0).
Following the covariate analysis, a model refinement phase was undertaken to explore whether any remaining variability in parameters could be attributed to unknown study factors, by examining the distribution of the etas by study.
Model evaluation.
Graphical techniques were used to assess the fit of the model to the data, including plots of observed versus population and individual predicted plasma bedaquiline concentrations, and conditional weighted residuals (CWRES) versus population predicted concentration and time after last dose. In addition, consideration was made to the RSEs of the parameter estimates and the condition number of the model (12), calculated as in equation 6:
| (6) |
A condition number of <1,000 indicates there is minimal collinearity between the parameter estimates and the covariance matrix for the random effects (the Omega matrix in NONMEM) is well conditioned. A condition number that is >10,000 indicates that the model may be unstable due to high collinearity and/or overparameterization (12).
Visual predictive checks (VPCs) were also performed to determine if the simulation characteristics of the model were adequate. The VPCs were performed by simulating 100 replicates of the data set from the posterior distribution of the model to compute the 95% prediction intervals of the 10th, 50th, and 90th percentiles. The observed data were then overlaid on the simulated percentiles together with the 10th, 50th, and 90th percentiles computed from the observed data.
RESULTS
A total of 5,222 observations (1,896 from 111 healthy volunteers and 3,326 from 369 patients) were available for analysis. The pharmacokinetics of bedaquiline were best characterized by a 4-compartment disposition model (Fig. 1), with absorption described by a dual zero-order input function, which characterized the systematic dual peaks observed in the data (Fig. 2). The model was parameterized in terms of apparent clearance (CL/F), apparent central volume of distribution (Vc/F), apparent clearances between Vc/F and the three peripheral compartments (CLP1–3/F), three peripheral volumes (Vp1–3/F), a lag time prior to absorption (Tlag) from the depot compartment dependent on formulation, an additional lag time prior to administration of the remaining dose into the central compartment (Tlag,add), the duration of infusion into the depot compartment (DUR1) and central compartment (DUR2), the fraction of dose into the depot compartment (FR1) (constrained to a value between 0 and 1 using a logit function), and a covariance term between CL/F and Vc/F. During structural model development, F was found to be dependent on study and was therefore included in the model. RUV was also identified to be higher for the phase IIb studies TiDP13-C208 and TiDP13-C209. To allow the dual zero-order model to be implemented in NONMEM, the rate parameter describing drug movement from the input compartment to the central compartment was fixed to a high rate (1,000), resulting in the dose via the input compartment describing an initial zero-order (rather than first-order) input.
FIG 1.

Schematic diagram of the structural model. *, rate parameter fixed to 1,000; DUR1 and DUR2, duration of dose into the input and central compartments, respectively; Tlag, absorption lag time for input compartment; Tlag,add, additional absorption lag time for central compartment; FR1, fraction of dose into the input compartment.
FIG 2.

Example of raw data plots showing dual peaks in the rich data.
Based upon a graphical analysis, black race, Asian race, subject status (patient), sex, TB type, HIV status, age, and CLCR were considered to be covariates with CL/F (eta shrinkage, 29.0%), whereas all covariates were considered with Vc/F, as shrinkage was >35% (eta shrinkage, 37.9%). Only a negligible to weak relationship was observed between eta for CL/F and weight or BMI (Fig. 3); however, given the wide range of subjects included in this analysis (30 to 113 kg; BMI range, 13.1 to 36.8 kg/m2) and the biological plausibility of an increase in CL/F with body size, weight and BMI were also tested on CL/F.
FIG 3.
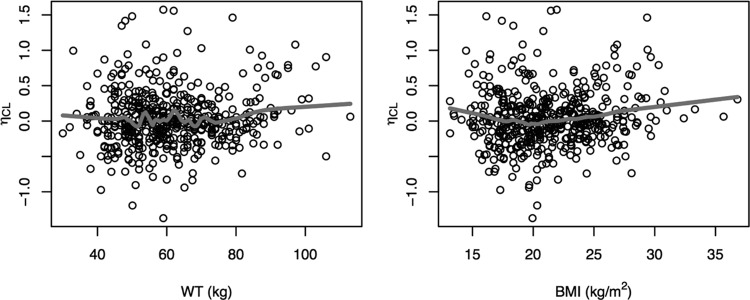
Relationship between the individual random effects (η) for CL/F and body size covariates. BMI, body mass index; WT, weight.
During univariate analysis, 6 covariates were found to be significant at a P value of <0.005 with CL/F, including black race (ΔOBJ = −38.287), TB type (ΔOBJ = −32.997), Asian race (ΔOBJ = −23.512), subject status (patient, ΔOBJ = −23.028), age (ΔOBJ = −12.808), and BMI (ΔOBJ = −9.913), and 5 covariates were significant on Vc/F: BMI (ΔOBJ = −13.266), TB type (DS TB, ΔOBJ = −11.050), weight (ΔOBJ = −10.534), albumin (ΔOBJ = −10.247), and sex (ΔOBJ = −8.707). Following stepwise backwards elimination of covariates from the full covariate model, 3 covariates were found to be significant at a P value of <0.001 and were thus retained in the model, including subject status and black race with CL/F, and sex with Vc/F.
Finally, in addition to subject status affecting CL/F, it was identified that CL/F also varied according to study, with lower CL/F in phase IIb studies in patients with MDR-TB than in the other studies. As such, healthy volunteers and patients with DS-TB were added as a covariate to CL/F, with the effect described as an increase in CL/F compared to the phase IIb studies in patients with MDR-TB (which were fixed as the reference group for both F and CL/F).
The final covariate model for bedaquiline therefore included study as a covariate with F, black race, subject status, and DS-TB with CL/F, and sex with Vc/F. The parameter estimates for the final covariate model are presented in Table 3.
TABLE 3.
Parameter estimates for the final covariate model
| Parameter (abbreviation)a | Parameter estimate (%CV) | BSV estimate as %CV (RSE as %CV)b | Shrinkage estimate (%) |
|---|---|---|---|
| Apparent clearance (CL/F) (liters/h) | 2.78 (5.1) | 50.4 (12.3) | 31.8 |
| Apparent vol of distribution (Vc/F) (liters) | 164 (5.0) | 39.1 (15.6) | 38.5 |
| Apparent clearance between Vc/F and Vp1/F (CLP1/F) (liters/h) | 11.8 (7.6) | ||
| Apparent vol of distribution for the first peripheral compartment (Vp1/F) (liters) | 178 (8.1) | ||
| Apparent clearance between Vc/F and Vp2/F (CLP2/F) (liters/h) | 8.03 (4.9) | ||
| Apparent vol of distribution for the second peripheral compartment (Vp2/F) (liters) | 3,010 (9.0) | ||
| Apparent clearance between Vc/F and Vp3/F (CLP3/F) (liters/h) | 3.58 (9.0) | ||
| Apparent vol of distribution for the third peripheral compartment (Vp3/F) (liters) | 7,350 (5.8) | ||
| Fraction of dose into the depot compartment (FR1) (%) | 58.5 (11.1) | 113 (15.9) | 43.5 |
| Duration of infusion into the depot compartment (DUR1) (h) | 2.22 (1.0) | ||
| Additional lag time prior to administration of the remaining dose into Vc/F (Tlag,add) (h) | 1.48 (3.2) | ||
| Duration of infusion into Vc/F (DUR2) (h) | 1.48 (3.2) | ||
| Lag time prior to absorption (solution) (Tlag) (h) | 0.541 (5.7) | ||
| Lag time prior to absorption (tablet) (Tlag) (h) | 0.917 (0.6) | ||
| Study R207910-CDE102 or TiDP13-C104 on F | 1.51 (7.5) | ||
| Other studies on Fc | 2.03 (4.7) | ||
| Increase in CL/F with black race (%) | 52.0 (21.2) | ||
| Decrease in Vc/F with female sex (%) | −15.7 (42.5) | ||
| Increase in CL/F for healthy volunteers or patients with DS-TB (%) | 37.5 (35.2) | ||
| Between-subject variability on F | 39.6 (9.3) | 13.6 | |
| Residual unexplained variability (%CV) | 20.6 (3.3) | ||
| Residual unexplained variability on TiDP13-C208 or TiDP13-C209 (%CV) | 27.7 (3.2) | ||
| Correlation between CL/F and Vc/F | 0.407 |
F, apparent bioavailability; DS-TB, drug-sensitive Mycobacterium tuberculosis; %CV, percent coefficient of variation.
BSV, between-subject variability; RSE, relative standard error of estimate. Note that due to long run times (∼24 h), a bootstrap analysis was unable to be performed, and therefore, the RSEs presented are the NONMEM reported values.
Studies TMC207-TiDP13-C109, TMC207-TiDP13–110, TMC207-TiDP13–111, TMC207-TiDP13–202, and TMC207-TBC1003.
Model evaluation.
Goodness-of-fit plots for the final model are presented in Fig. 4. A plot of the observed versus the population-predicted plasma concentration (Fig. 4a) shows that the data were generally uniformly scattered about the line of unity. A plot of the observed versus individual predicted plasma concentration (Fig. 4b) shows that the data were tightly scattered about the line of unity. Additional diagnostic plots also confirmed that the final model fitted the data with good precision and minimal bias. Plots of CWRES versus population-predicted plasma concentration (Fig. 4c) and CWRES versus time after last dose (Fig. 4d) show no model misspecification at any concentration or time point. Frequency histograms of the individual random effects for CL/F, Vc/F, FR1, and relative bioavailability (F) demonstrated that all BSV terms were approximately normally distributed around zero, with moderate shrinkage observed for Vc/F and FR1 (38.5 and 43.5%, respectively). The condition number was 77.3, which indicated that the model was not overparameterized and that there was no evidence of collinearity (12). The RSEs were all considered acceptable, with values of <21.2% for all fixed effects, except for the parameters describing a decrease in Vc/F for females, and the increase in CL/F for non-C208 and -C209 studies, which were 42.5% and 35.2%, respectively. The RSEs for the random effects were all <15.9%. Finally, the VPCs presented in Fig. 5 confirmed that the model described the data well and had good simulation characteristics. Additional VPCs for the final model are provided in the supplemental material.
FIG 4.

Goodness-of-fit plots for the final population PK model. The light gray line shows the trend of the data, with the black circles representing the observed data. Darker coloring indicates multiple/overlapping observations. CWRES, conditional weighted residual.
FIG 5.

Visual predictive checks for the final population PK model for all data to 16,440 h (98 weeks) postdose (top) and data from 0 to 100 h postdose (bottom). The dark gray circles represent the observed data. The lower and upper dashed lines represent the 10th and 90th percentiles for the observed data. The solid line represents the 50th percentile for the observed data. The shaded areas represent the 95% prediction intervals for the 10th, 50th, and 90th percentiles for the simulated data.
DISCUSSION
The population PK model for bedaquiline presented in this paper is able to describe the PK of bedaquiline following oral administration of a range of bedaquiline dosing regimens, with good precision. Furthermore, the VPCs indicated that the model could be used for simulation purposes.
A 4-compartment disposition model with two sequential zero-order input functions best describes the data, including the long terminal elimination half-life of bedaquiline, which has been estimated to be about 5.5 months (6). Bedaquiline has the structural characteristics of a cationic amphiphilic drug (CAD), resulting in an affinity to bind to intracellular phospholipids and, consequently, drug accumulation in tissues (13). This is reversible upon treatment discontinuation, and the slow release of bedaquiline from peripheral tissue compartments explains its prolonged terminal elimination half-life.
For absorption, the two zero-order absorption rates were preceded by separate lag times, with the lag time from the second compartment being greater than the first, thus characterizing the dual peaks observed in the rich data. This input model contrasts that recently reported by Svensson et al. (7) and describes the input over the first 6 h postdose with greater precision, with the RUV for this model estimated to be 20.6% (27.7% for studies C208 and C209) compared to 45% for the Svensson et al. model. The slow and erratic absorption of bedaquiline results in maximum concentrations typically being achieved at 5 h postdose, with absorption enhanced after food intake (6). This results in a second absorption peak presenting after lunch (4 h postdose in trials with rich sampling) following the intake of bedaquiline with breakfast in the morning. Because of the known effect of food intake on bedaquiline absorption (6), an enterohepatic absorption model was not considered to describe the dual peaks.
The pharmacokinetic parameters of bedaquiline indicated that the compound has low apparent clearance (2.78 liters/h) and is widely distributed, with the apparent volume of the central compartment (typical value, 164 liters) approximately twice as high as the total body volume and with apparent volume at steady state (estimated as the sum of the apparent volumes of the four compartments) in excess of 10,000 liters. These volume of distribution estimates are quite different from those estimated from the model presented by Svensson et al. (7), which did not consider the 4th peripheral compartment due to limitations in the data used for the model, where PK sampling was limited to 14 days postdose. Based on the current structural PK model, the rate-limiting steps characterizing the long terminal t1/2 of the compound are due to the redistribution of bedaquiline from the peripheral tissue compartments. The difference in the Vc/F between models (17.3 liters, as estimated by Svensson et al., compared to 164 liters in the current analysis) may be due to a combination of the additional peripheral compartment identified in this analysis and the different input model used to describe absorption, as estimates of Vc/F can be highly influenced by absorption. Again, it should be noted that the RUV during absorption was lower than that for the Svensson et al. model (7), and the model had good simulation characteristics during both the input and distribution phases.
The BSV terms were included on the disposition parameters CL/F and Vc/F. A BSV term was also included on the parameter describing the fraction of the dose administered into the depot compartment (FR1), with an additional BSV term included on relative bioavailability (F). The BSV was estimated to be moderate at 50.4% coefficient of variation (%CV) for CL/F, 39.1%CV for Vc/F, and 39.6%CV for F. BSV was high for FR1 and estimated to be 113%CV. The RUV was estimated to be 20.6%CV for all studies, excluding the phase IIb studies TMC207-TiDP13-C208 and TMC207-TiDP13-C209, which had an estimated RUV of 27.7%CV. This was expected, as greater variability is commonly observed for data obtained in multicenter phase II studies compared to those obtained in tightly controlled single-center phase I studies.
Differences in the trial procedures and study populations may have contributed to the disparity in bioavailability observed during structural model development between the phase II studies in patients with MDR-TB versus phase I studies and the early bactericidal activity phase IIa study, which recruited patients with DS-TB (14). Reduced intestinal permeability has been observed in patients with TB, which may reduce bioavailability and thus explain lower exposure to certain anti-TB drugs (15, 16). Barroso et al. (15) evaluated intestinal barrier function and serum concentrations of RIF and INH in outpatients with MDR-TB, DS-TB, and healthy subjects, and they observed a significantly lower intestinal area of absorption (as measured by the urinary excretion rate of orally administered mannitol) and lower RIF concentrations in patients with MDR-TB than those of patients with DS-TB or of healthy subjects (15). In a population pharmacokinetics analysis of another TB drug, ethionamide, the average exposure was about 50% lower in patients with TB than that in healthy volunteers, which was explained by a lower bioavailability of ethionamide in the patients (17). Although no mechanistic explanation was provided in this study, the lower bioavailability of ethionamide is consistent with the reports of reduced intestinal permeability in patients with TB. Similarly, reduced intestinal permeability, particularly in those with more advanced disease characteristics (i.e., MDR-TB versus DS-TB), may have contributed to the lower bioavailability and exposure to bedaquiline in patients with MDR-TB compared to patients with DS-TB or healthy volunteers.
Three additional covariates were also included in the model. Healthy volunteers and patients with DS-TB were identified as having a CL/F that was 37.5% higher than that of patients with MDR-TB. Additionally, subjects of black race had a CL/F that was 52.0% higher than those of subjects of other races, and females were also identified to have a Vc/F that was 15.7% lower than that of males. The effect of black race on CL/F appeared to be independent of other covariates, while the effect of sex on Vc/F might have been driven by body size, with females having a lower weight and BMI than those of males. It should be noted, however, that no continuous body size covariate was found to be statistically significant on Vc/F.
Despite the wide range of weight for subjects included in this analysis, body size was also not found to be significant on CL/F. This result is in contrast to Svensson et al., who found an improvement in model fit when allometric scaling of disposition parameters with fixed coefficients were included (0.75 for clearances, 1 for volumes) (7). Our finding was not surprising, however, given the weak relationship observed between the eta for CL/F and size covariates, and a nonstratified distribution of weight, which can result in a lower probability of identifying a true covariate effect (18). It is likely in this case that the underlying covariate effect of weight was instead partially described by the lower CL/F observed for sicker MDR-TB patients than that for DS-TB patients and healthy volunteers. Although a fixed size relationship could have been included on CL/F for the current model, the purpose of this analysis, which was to identify potential covariates that explain intersubject variability in bedaquiline exposure in this particular subject group, would have been defeated. Furthermore, controversy exists over which body size covariate should be used to describe drug clearance, e.g., BSA, lean body weight (LBW), or weight, and which allometric exponent, if any, should be used, e.g., 2/3 or 3/4 (19). Nevertheless, we caution the use of this model for predicting exposure in children and adolescents, and further investigation is required to properly ascertain the effect of body size on bedaquiline PK.
The therapeutic dosing regimen of bedaquiline consists of 400 mg daily (QD) for 2 weeks, followed by 200 mg thrice weekly (TIW). After an initial drop in plasma concentrations when the bedaquiline dose is reduced from 400 mg QD to 200 mg TIW, the exposures increase from week 12 to week 24 during the TIW regimen, which is explained by the long terminal half-life of the compound that is captured by the population model by incorporation of a 4-compartment model, with estimates of Vp2/F and Vp3/F of 3,010 and 7,350 liters, respectively. The plasma bedaquiline concentrations are predicted to be 93 and 105% at weeks 12 and 24, respectively, relative to the concentration at week 3.
The influence of race on CL/F and sex on Vc/F for the target patient population was also explored. The reference subject was considered to be a male of nonblack race, recruited in studies TMC207-TiDP13-C208 and TMC207-TiDP13-C209 (i.e., phase IIb MDR-TB patients), with a CL/F of 2.78 liters/h and a Vc/F of 164 liters. The typical estimate of CL/F increased from 2.78 to 4.23 liters/h for subjects of black race, while the Vc/F decreased from 164 to 138 liters for female patients. The impact of these covariates is shown in Fig. 6, with the area under the concentration-time curve at steady state (AUCss) over a week (i.e., 168 h [AUCss,weekly]) simulated for 1,000 females of black race, 1,000 males of black race, 1,000 females of white race, and 1,000 males of white race administered 200 mg TIW. It can be seen that the exposure is similar between male and female subjects, regardless of race; however, subjects of black race had lower exposures than subjects of nonblack race, with the AUCss,weekly for a typical nonblack subject expected to be 216 μg · h/ml, compared to 142 μg · h/ml for a subject of black race. Despite this lower exposure in black subjects, efficacy has shown to be similar in black subjects and subjects of other races (6). Furthermore, no relationship has been observed between the bedaquiline plasma AUC over 24 h (AUC0–24) and time to culture conversion and culture conversion rates, nor between the average concentration (Cavg) and Cavg/MIC values in plasma (6). As such, the difference in exposure due to race can be considered clinically irrelevant (6), with no dose adjustments required according to race.
FIG 6.

Comparison of weekly bedaquiline exposure by sex and race. Box plots represent the median (thick line), 25th to 75th percentiles (box), 1.5 times the interquartile range (whiskers) of values, and outliers (points).
Finally, a simulation was performed to determine the typical AUCweekly over time as a percentage of the AUCss,weekly under the standard therapeutic dosing regimen described above, over the approved treatment duration of 6 months. It can be seen in Fig. 7 that following the 2-week loading-dose period, the AUCweekly declined to 60% and 75% of the AUCss,weekly in white and black males, respectively, followed by relatively stable concentrations until the end of treatment. After treatment, the AUCweekly declined from approximately 80% to 50% of the AUCss,weekly within 2 to 3 weeks, followed by slow elimination, with 5 to 10% of the AUCss,weekly remaining 52 weeks (1 year) after dosing. With continuation of treatment, 90% of the AUCss,weekly was achieved by 36 and 55 weeks for black and white males, respectively.
FIG 7.
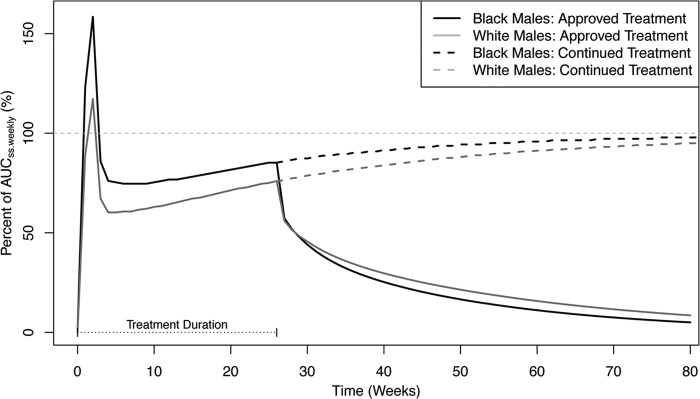
AUCweekly as a percentage of AUCss,weekly over time. The horizontal dotted gray line represents 100%.
In conclusion, a population pharmacokinetic model for bedaquiline was developed using data from 9 clinical studies that described concentrations to 685 days (16,400 h) postdose. The apparent central volume of distribution was lower in females, which may be explained by a difference in body size, although the difference between females and males was <20%, had a minimal impact on exposure, and was not considered to be of clinical significance. The apparent clearance was higher in subjects of black race than in subjects of other races, although no difference in effectiveness has been observed in the clinical effectiveness studies (6), and this is therefore not considered to be of clinical significance. Although the t1/2 of bedaquiline is long, the approved dosing regimen of 400 mg QD for 2 weeks followed by 200 mg TIW achieves relatively stable concentrations over the 6-month treatment period. The results of this analysis were included as supporting documentation for FDA approval of bedaquiline in 2012.
Supplementary Material
ACKNOWLEDGMENTS
Sarah C. McLeay and Bruce Green were paid consultants by Janssen R&D. Peter Vis was a paid employee of Janssen R&D, and Rolf P.G. van Heeswijk is currently a paid employee of Janssen R&D.
Footnotes
Published ahead of print 23 June 2014
Supplemental material for this article may be found at http://dx.doi.org/10.1128/AAC.01418-13.
REFERENCES
- 1.Tiruviluamala P, Reichman LB. 2002. Tuberculosis. Annu. Rev. Public Health 23:403–426. 10.1146/annurev.publhealth.23.100901.140519 [DOI] [PubMed] [Google Scholar]
- 2.World Health Organization. 2011. WHO report 2011: global tuberculosis control. WHO, Geneva, Switzerland: http://www.who.int/tb/publications/global_report/2011/gtbr11_full.pdf [Google Scholar]
- 3.Zignol M, van Gemert W, Falzon D, Sismanidis C, Glaziou P, Floyd K, Raviglione M. 2011. Surveillance of anti-tuberculosis drug resistance in the world: an updated analysis, 2007–2010. Bull. World Health Organ. 90:111D–119D. 10.2471/BLT.11.092585 [DOI] [PMC free article] [PubMed] [Google Scholar]
- 4.CDC. 2006. Emergence of Mycobacterium tuberculosis with extensive resistance to second-line drugs—worldwide, 2000–2004. MMWR Morb. Mortal. Wkly. Rep. 55:301–305 [PubMed] [Google Scholar]
- 5.Andries K, Verhasselt P, Guillemont J, Göhlmann HW, Neefs JM, Winkler H, Van Gestel J, Timmerman P, Zhu M, Lee E, Williams P, de Chaffoy D, Huitric E, Hoffner S, Cambau E, Truffot-Pernot C, Lounis N, Jarlier V. 2005. A diarylquinoline drug active on the ATP synthase of Mycobacterium tuberculosis. Science 307:223–227. 10.1126/science.1106753 [DOI] [PubMed] [Google Scholar]
- 6.FDA. 2012. Anti-infective drugs advisory committee meeting: briefing document. TMC207 (bedaquiline) treatment of patients with MDR-TB: NDA 204-384. FDA, Silver Spring, MD: http://www.fda.gov/downloads/AdvisoryCommittees/CommitteesMeetingMaterials/Drugs/Anti-InfectiveDrugsAdvisoryCommittee/UCM329260.pdf [Google Scholar]
- 7.Svensson EM, Aweeka F, Park JG, Marzan F, Dooley KE, Karlsson MO. 2013. Model-based estimates of the effects of efavirenz on bedaquiline pharmacokinetics and suggested dose adjustments for patients coinfected with HIV and tuberculosis. Antimicrob. Agents Chemother. 57:2780–2787. 10.1128/AAC.00191-13 [DOI] [PMC free article] [PubMed] [Google Scholar]
- 8.Cockcroft DW, Gault MH. 1976. Prediction of creatinine clearance from serum creatinine. Nephron 16:31–41. 10.1159/000180580 [DOI] [PubMed] [Google Scholar]
- 9.Center for Drug Evaluation and Research. 2001. Guidance for industry: bioanalytical method validation. FDA, U.S. Department of Health and Human Services, Rockville, MD: http://www.fda.gov/downloads/Drugs/Guidances/ucm070107.pdf [Google Scholar]
- 10.Karlsson MO, Savic RM. 2007. Diagnosing model diagnostics. Clin. Pharmacol. Ther. 82:17–20. 10.1038/sj.clpt.6100241 [DOI] [PubMed] [Google Scholar]
- 11.Du Bois D, Du Bois EF. 1989. A formula to estimate the approximate surface area if height and weight be known. 1916. Nutrition 5:303–311 [PubMed] [Google Scholar]
- 12.Bonate P. 2006. Pharmacokinetic-pharmacodynamic modeling and simulation. Springer, New York, NY: [DOI] [PubMed] [Google Scholar]
- 13.Hanumegowda UM, Wenke G, Regueiro-Ren A, Yordanova R, Corradi JP, Adams SP. 2010. Phospholipidosis as a function of basicity, lipophilicity, and volume of distribution of compounds. Chem. Res. Toxicol. 23:749–755. 10.1021/tx9003825 [DOI] [PubMed] [Google Scholar]
- 14.Rustomjee R, Diacon AH, Allen J, Venter A, Reddy C, Patientia RF, Mthiyane TCP, De Marez T, van Heeswijk R, Kerstens R, Koul A, De Beule K, Donald PR, McNeeley DF. 2008. Early bactericidal activity and pharmacokinetics of the diarylquinoline TMC207 in treatment of pulmonary tuberculosis. Antimicrob. Agents Chemother. 52:2831–2835. 10.1128/AAC.01204-07 [DOI] [PMC free article] [PubMed] [Google Scholar]
- 15.Barroso EC, Pinheiro VG, Façanha MC, Carvalho MR, Moura ME, Campelo CL, Peloquin CA, Guerrant RL, Lima AA. 2009. Serum concentrations of rifampin, isoniazid, and intestinal absorption, permeability in patients with multidrug resistant tuberculosis. Am. J. Trop. Med. Hyg. 81:322–329 [PubMed] [Google Scholar]
- 16.Pinheiro VG, Ramos LM, Monteiro HS, Barroso EC, Bushen OY, Façanha MC, Peloquin CA, Guerrant RL, Lima AA. 2006. Intestinal permeability and malabsorption of rifampin and isoniazid in active pulmonary tuberculosis. Braz. J. Infect. Dis. 10:374–379. 10.1590/S1413-86702006000600003 [DOI] [PubMed] [Google Scholar]
- 17.Zhu M, Namdar R, Stambaugh JJ, Starke JR, Bulpitt AE, Berning SE, Peloquin CA. 2002. Population pharmacokinetics of ethionamide in patients with tuberculosis. Tuberculosis (Edinb.) 82:91–96 [DOI] [PubMed] [Google Scholar]
- 18.Han PY, Kirkpatrick CM, Green B. 2009. Informative study designs to identify true parameter-covariate relationships. J. Pharmacokinet. Pharmacodyn. 36:147–163. 10.1007/s10928-009-9115-y [DOI] [PubMed] [Google Scholar]
- 19.McLeay SC, Morrish GA, Kirkpatrick CM, Green B. 2012. The relationship between drug clearance and body size: systematic review and meta-analysis of the literature published from 2000 to 2007. Clin. Pharmacokinet. 51:319–330. 10.2165/11598930-000000000-00000 [DOI] [PubMed] [Google Scholar]
Associated Data
This section collects any data citations, data availability statements, or supplementary materials included in this article.