

Abstract
Bacteria can become resistant not only by horizontal gene transfer or other forms of exchange of genetic information but also by de novo by adaptation at the gene expression level and through DNA mutations. The interrelationship between changes in gene expression and DNA mutations during acquisition of resistance is not well documented. In addition, it is not known whether the DNA mutations leading to resistance always occur in the same order and whether the final result is always identical. The expression of >4,000 genes in Escherichia coli was compared upon adaptation to amoxicillin, tetracycline, and enrofloxacin. During adaptation, known resistance genes were sequenced for mutations that cause resistance. The order of mutations varied within two sets of strains adapted in parallel to amoxicillin and enrofloxacin, respectively, whereas the buildup of resistance was very similar. No specific mutations were related to the rather modest increase in tetracycline resistance. Ribosome-sensed induction and efflux pump activation initially protected the cell through induction of expression and allowed it to survive low levels of antibiotics. Subsequently, mutations were promoted by the stress-induced SOS response that stimulated modulation of genetic instability, and these mutations resulted in resistance to even higher antibiotic concentrations. The initial adaptation at the expression level enabled a subsequent trial and error search for the optimal mutations. The quantitative adjustment of cellular processes at different levels accelerated the acquisition of antibiotic resistance.
INTRODUCTION
The de novo acquisition of resistance against antibiotics is known to be accompanied by certain mutations and differential expression of specific genes (1–5). The “radical-based” theory (6, 7) proposes that bactericidal antibiotics cause cell death by a single mechanism, driven by the accumulation of oxygen radicals in the cells. In that case, the cellular response to sublethal concentrations of antibiotics should be similar even for compounds belonging to different classes of bactericidal drugs, such as beta-lactams or fluoroquinolones. The outcome might differ for bacteriostatic drugs, for example, tetracycline. The radical-based theory, however, is the subject of debate (8). The revelation of a common denominator for the adaptation processes to different antibiotics might illuminate the question of a single mechanism from a different angle.
Resistance can easily be induced in Escherichia coli by exposure to stepwise increasing sublethal antibiotic concentrations (9). The effects of the acquisition of resistance to amoxicillin on the overall physiology is a complex set of adaptations at the gene expression level, preventing metabolic costs at the expense of the ecological range (10). After the initial stage, the prolonged exposure to antibiotics modulates the SOS response, leading in turn to mutations that cause resistance (11). The mutations generate more permanent resistance, which remains long after the antibiotic pressure has been removed (3). Resistance to amoxicillin is primarily caused by overexpression of ampC due to mutations in the promoter region (12). The effectiveness of fluoroquinolones is greatly reduced by mutations in gyrA and parC (13). If these mutations are induced by a single mechanism, a common pattern in the incidence may reveal itself.
The question therefore poses itself whether the response of the cell upon exposure to different antibiotics is very similar, as a common mechanism of action and induction of resistance would suggest, or that it differs for each class of antibiotics. In addition, the delicate interplay between changes at the expression level and the induction of mutations has not been documented. To investigate differences in cellular responses of E. coli upon exposure to various antibiotics, we documented the effects of adaptation to amoxicillin, enrofloxacin, and tetracycline, each belonging to a different class of compounds.
MATERIALS AND METHODS
Bacterial strains, growth media, culture conditions, and MIC measurement.
The drug-sensitive wild-type (WT) E. coli MG1655 was used throughout. Amoxicillin, tetracycline, and enrofloxacin resistance were induced by stepwise increase of the drug concentration with every transfer cycle when almost normal growth occurred (9). Batch cultures of E. coli were grown at 37°C in a phosphate buffer (100 mM total NaH2PO4 and Na2HPO4) and defined minimal medium containing 55 mM glucose with a pH of 6.9 (14). The MIC values were measured by following growth in 96-well plates as described previously (15), using duplicate serial dilutions of a factor of 2, ranging from 0 to 1,024 μg/ml of the antibiotic. The MIC was defined as the lowest concentration of antibiotic that reduced the growth to an optical density at 595 mm (OD595) of 0.2 or less after 23 h.
Amplification and sequencing of resistance-conferring gene loci.
Amplification was performed in 50-μl working volumes with Taq DNA polymerase (Thermo Scientific) using the following parameters: denaturation at 95°C for 5 min, followed by 35 cycles of 35 s at 95°C, 55s at 49°C, and 90 s at 72°C, and finally, extension at 72°C for 90 s. The PCR products were purified with the MSB Spin PCRapace kit (Invitek) and sequenced by Macrogen Europe. Oligonucleotide primers used throughout this study are listed in Table 1.
TABLE 1.
Oligonucleotide primers used in this study for the detection of alterations in the ampC promoter region of amoxicillin-resistant and gyrA, gyrB, or parC gene loci for enrofloxacin-resistant E. coli cells
| Primer | Gene range (no. of nucleotides) | Oligonucleotide sequence |
|---|---|---|
| ampC-promoter | 239 bp upstream (124) | Forward: 5′-GGGATCTTTTGTTGCTCT-3′ |
| Reverse: 5′-CTTCATTGGTCGCGTATT-3′ | ||
| gyrA | 19 bp upstream (497) | Forward: 5′-AGGTTAGGAATTTTGGTTGG-3′ |
| Reverse: 5′-GTAGAGGGATAGCGGTTAG-3′ | ||
| gyrB | (998–1158) | Forward: 5′-ACGATAGAAGAAGGTCAACA-3′ |
| Reverse: 5′-CTCCCAGACCAAAGACAAA-3′ | ||
| parC | 34 bp upstream (550) | Forward: 5′-TATGCGGTGGAATATCGGT-3′ |
| Reverse: 5′-GAAGGCTGGCGAATAAGT-3′ |
Microarray RNA analysis.
Three biological replicates were inoculated to an OD600 of 0.2 in fresh medium with or without antibiotics and harvested at an OD600 of 1.0. Antibiotics were added at 0.25× MIC (1 [WT] and 128 μg/ml [adapted] for amoxicillin, 0.125 and 128 μg/ml for enrofloxacin, and 0.25 and 16 μg/ml for tetracycline). The pellet was flash-frozen in liquid nitrogen and stored at −80°C. The total RNA was extracted by adding 500 μl of RNeasy lysis buffer containing 1% mercaptoethanol and incubated at room temperature for 5 min. The lysed cells were extracted twice with acid phenol, followed by two chloroform extractions. Total RNA was precipitated with isopropanol, incubated overnight at −80°C, and centrifuged for 30 min at 4°C. The pellet was washed with ice-cold 75% ethanol and redissolved in 100 μl RNase-free water. The RNA samples were purified with the RNeasy kit (Qiagen). The amount of RNA was measured on the NanoDrop ND-1000 (Thermo Scientific). The integrity of the RNA samples was investigated with the BioAnalyzer (Agilent Technologies) using the RNA nano 6000 kit (Agilent Technologies). Labeling, microarray hybridization, scanning, and data processing were performed at the MicroArray Department of the University of Amsterdam as described previously (10).
Genome sequencing and assembly.
Whole-genome sequencing was performed described previously on a Roche 454 platform (10, 16). The following criteria were utilized to rule out sequencing errors: (i) the region of the structural variation is unique in the reference sequence, (ii) no perfect match reads can be aligned, and (iii) at least 3 or more reads should unambiguously support each single nucleotide polymorphism (SNP).
RESULTS
Expression profiles.
Expression profiles of strains made permanently resistant by growth at stepwise increasing concentrations (9) were compared to those of the wild type to establish the role of differential expression in the de novo acquisition of resistance (Fig. 1). The final MICs were between 256 and 1,024 μg/ml for amoxicillin, 512 and 1,024 μg/ml for enrofloxacin, and 64 μg/ml for tetracycline. Replicates of a single adapted strain were analyzed for each antibiotic. Possibly, various results might have been obtained by using different strains, but physiological parameters, such as growth rate, enzyme activities, or stress tolerance, turned out to be very similar in other studies using more strains (9, 10). This indicates that the outcome of the regulatory processes was similar as well.
FIG 1.
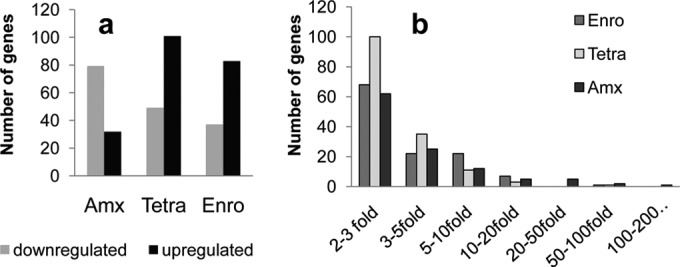
Expression profiles of cells adapted to antibiotics and grown at 0.25× MIC, compared to the wild-type cells in the absence of antibiotics. (a) Number of differentially up- and downregulated genes in amoxicillin (Amx)-adapted (MIC, 512 μg/ml), tetracycline (Tetra)-adapted (MIC, 64 μg/ml), or enrofloxacin (Enro)-adapted (MIC, 512 μg/ml) E. coli cells compared to the wild-type cells. Genes are listed when expression is significantly (95% confidence level) changed by a factor exceeding 2. (b) Number of genes that are up- or downregulated, grouped according to the factor of the differential expression in E. coli cells resistant to enrofloxacin (Enro), tetracycline (Tetra), and amoxicillin (Amx).
Overall, roughly twice as many genes were significantly (factor of >2 at a 95% confidence level [n = 3]) downregulated as upregulated upon adaptation to amoxicillin, but for enrofloxacin and tetracycline this was the opposite (Fig. 1a). Expression of >200 genes varied by a factor between 2 and 3, either up or down, and just 127 between 3- and 10-fold (Fig. 1b). Only very few genes had differential expression higher than 20-fold in resistant cells compared to the wild type. The acid stress chaperone hdeB (17) was 200- and 82-fold suppressed in amoxicillin- and tetracycline-resistant cells, respectively. Enrofloxacin-resistant cells showed a 65-fold increased expression of the superoxide response regulon soxS. Amoxicillin-resistant cells showed strong induction of the frd operon and of the putative amino acid transporter yjeM and a 97-fold induction of ampC expression.
A consistent pattern did not present itself when we analyzed and compared expression patterns, but some aspects deserve notice. Adaptation to tetracycline required by far the largest number of differentially expressed genes, but the adaptation to this antibiotic was less successful than to the others. Only 4 genes (hdeA and gadA, gadB, and gadC [gadABC]) were differentially regulated in all three resistant cell types. These genes are part of the acid resistance systems (18). Expression of a pH-inducible protein involved in the stress response (inaA), the major oxygen-insensitive nitroreductase (nfsAB), and the multidrug efflux transporters (acrAB and mdtG) (19) was significantly induced in tetracycline- and enrofloxacin-resistant cells. The regulator of acrAB, acrR, was upregulated 5.9 times in enrofloxacin-resistant cells, resulting in a very comparable upregulation of acrA by a factor of 7.9 and acrB by a factor of 5.8. In the same cells, pilus- and membrane-associated genes (fimACDI and ompF) were suppressed.
The diverging character of the expression profile is also seen when comparing differentially regulated genes according to their function (Table 2). For example, only in the tetracycline-resistant cells were 16 and 11 genes showing significant differential expression clustered into the functional groups of transcription and ATP binding, respectively. However, upon induction of resistance to each of the three antibiotics, functional groups of cell wall and membrane, iron ion binding, or cellular and anaerobic respiration were affected, but not identical genes. Overall, for all three antibiotics, the acquired resistance was accompanied by a large set of differentially expressed genes, both up- and downregulated, but the physiological roles are not always obvious.
TABLE 2.
Summary of differential regulation in selected functional groupsa of tetracycline-, enrofloxacin-, and amoxicillin-resistant E. coli compared to the wild type
| Functional group | No. of genes with differential regulation when exposed to indicated antibioticb |
|||||
|---|---|---|---|---|---|---|
| Tetra |
Enro |
Amx |
||||
| Upregulated | Downregulated | Upregulated | Downregulated | Upregulated | Downregulated | |
| Total | 101 | 49 | 83 | 37 | 32 | 79 |
| Plasma membrane | 22 | 18 | 14 | 12 | 18 | |
| Cell wall | 16 | 9 | 14 | 7 | 10 | 13 |
| Iron ion binding | 13 | 7 | 10 | 4 | ||
| Response to drug | 5 | 7 | ||||
| Nucleotide binding | 14 | 7 | ||||
| Transcription | 16 | |||||
| ATP binding | 11 | |||||
| Metal ion binding | 20 | 19 | 10 | |||
| Cellular respiration | 3 | 6 | ||||
| Anaerobic respiration | 5 | 5 | ||||
Found with DAVID Bioinformatics Resources 6.7 (41). Genes were analyzed that showed a minimally 2-fold significantly different expression (95% confidence level).
Tetra, tetracycline; Enro, enrofloxacin; Amx, amoxicillin.
Mutations.
The results of the whole-genome sequencing of several of the strains yielded no SNPs or other mutations that correlated consistently with increasing resistance other than those described below, which are known from the literature. Genes that are both up- or downregulated and mutated are discussed below.
As de novo resistance against amoxicillin in E. coli involves primarily mutations in the Pribnow box promoter region of the ampC gene coding for a beta-lactamase (12, 20–22), this region was sequenced in 7 parallel cultures during the building up of a more than 500-fold increased resistance to amoxicillin (Fig. 2). In total, 12 such mutations were observed, of which only 5 were present in the final cultures. An insertion of a T at the −15 position in the Pribnow box was found in the final samples of 5 out of 7 strains, twice accompanied by an apparently nonessential G-to-T mutation at position +33. The two other strains had a T-to-A mutation at position −32, also in the Pribnow box, always complemented by another mutation. This succession of events suggests that with increasing antibiotic concentrations some mutations were fixed in the culture, while others disappeared, even though these originally may have contributed to the increase of resistance (12). The final outcome can be described as the result of a set of events that do not always occur in the same order, concurring with some of the existing hypotheses on successful adaptation as a result of mutations (23–25).
FIG 2.

Genetic modifications in the ampC promoter region of E. coli MG1655 during the acquisition of amoxicillin resistance. (a) The measured MIC as a function of the amoxicillin concentration in the culture and the mutations found in the ampC promoter sequence over the course of stepwise increasing amoxicillin concentrations for 7 replicate cultures of E. coli MG1655. For every concentration, PCR products of 2 clones were sequenced. The asterisks indicate mutations that were found only in one colony. Green color indicates mutations in the ampC attenuator region, yellow, mutations in the −10 box, blue, mutations in the interbox distance, and red, mutations in the −35 box. (b) Genomic location of the ampC promoter mutations identified during the acquisition of amoxicillin resistance in the genome of E. coli MG1655.
Resistance to quinolones, inhibitors of DNA replication that bind to DNA gyrases (13), is generally associated with mutations in gyrA, though mutations in parC, coding for a topoisomerase (26), and gyrB (27) can further increase levels of resistance. The more than 1,000-fold increase of the MIC for enrofloxacin was accompanied by 3 to 5 mutations (Fig. 3). The initial mutations always occurred in the gyrA gene and were rarely lost or reversed. In 4 out of 7 instances it was the well-documented S83L mutation (28, 29). For the highest levels of resistance, at least one of the several observed mutations in parC was necessary as well. Mutations in gyrA and parC were not reversed during 30 days of continued growth in either the absence or presence of the antibiotic (Fig. 4). Two strains had mutation(s) in gyrB that, with one exception, occurred only at the very end of the experiments and could not be correlated with additional resistance because saturation levels had already been reached. Therefore, it seems that mutations in gyrB did not directly influence the level of resistance, but an indirect relationship involving stabilization of the quinolone-binding pocket (27) cannot be excluded. Compared to ampC in the case of amoxicillin, the path to resistance is therefore more focused for gyrA, but just as variable for parC and gyrB. Conceivably, in the case of de novo enrofloxacin resistance, the initial adaptation at the expression level makes the subsequent occurrence of mutations possible by protecting the cell against the antibiotic immediately after exposure, when mutations have not yet taken place.
FIG 3.

Genetic modifications in resistance-conferring genes of E. coli MG1655 during the adaptation to enrofloxacin. Top, plot of the measured MIC as a function of the enrofloxacin concentration in the medium. Bottom, mutations in gyrA, parC, and gyrB as a function of the MIC during growth at stepwise increasing enrofloxacin concentrations in 7 replicate cultures of E. coli MG1655. For every concentration, 2 clones were sequenced. The asterisks indicate mutations found only in one colony; blue, mutations in gyrA; red, mutations in parC; grey, mutations in gyrB.
FIG 4.

Mutations found in resistance-conferring regions of gyrA, parC, and gyrB in 2 enrofloxacin-resistant E. coli replicates cultured for 30 days in the presence or absence of the antibiotic. Blue indicates mutations in gyrA; red, mutations in parC; grey, mutations in gyrB. The asterisks indicate mutations found in only one of the two colonies that were sequenced for each data point.
Despite the large number of differentially expressed genes, no consistent mutations were discerned by whole-genome sequencing during the development of tetracycline resistance, which was limited to a factor of 16, or 4 steps of 2 (data not shown and reference 9). Hence the moderate resistance that was developed against tetracycline must be primarily due to adaptations at the gene expression level. Alternatively, the mutations in seemingly unrelated genes may have contributed to the rather modest resistance that was built up against tetracycline. More likely, the lack of effective mutations explains why tetracycline-adapted cells had the most differentially expressed genes (Fig. 5A).
FIG 5.
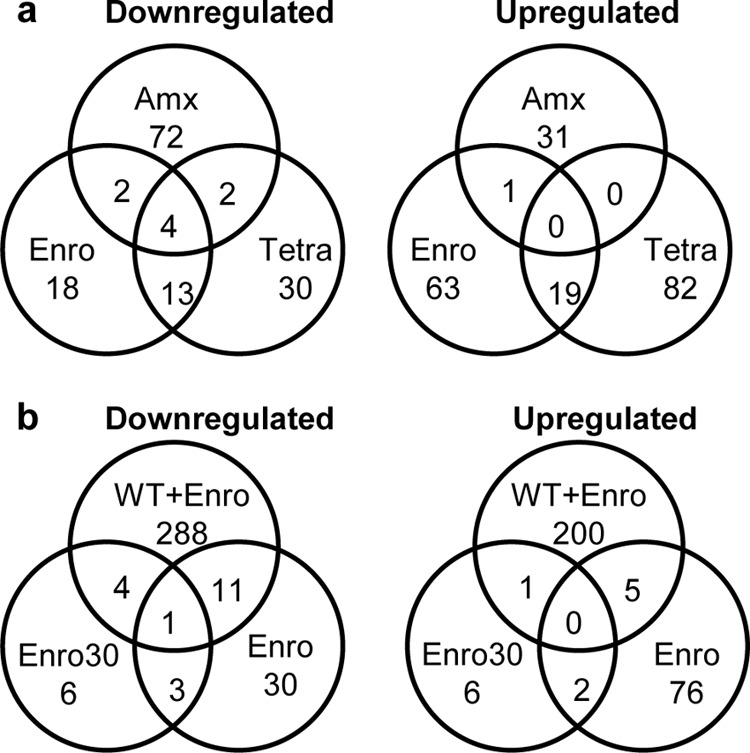
Overlap of differentially up- and downregulated genes in E. coli MG1655 wild-type and antibiotic-resistant cells. (a) Overlap of up- and downregulated genes in E. coli cells resistant to enrofloxacin (Enro), tetracycline (Tetra), and amoxicillin (Amx) in the absence of antibiotics compared to wild-type expression levels. The genes gadABC and hdeA were downregulated in all three antibiotic adapted strains. (b) Overlap of up- and downregulated genes in enrofloxacin-exposed (0.25× MIC, 0.125 μg/ml) wild-type and enrofloxacin-resistant E. coli cells (Enro, enrofloxacin adapted; Enro30, enrofloxacin adapted and cultured 30 days without the antibiotic) compared to wild-type expression levels. Only the NADH-quinone reductase azoR was downregulated in all 3 conditions.
Regulatory processes.
Names and roles of genes that are both mutated and differentially expressed are presented in Table 3. These genes were considered of special interest as they are affected by both mechanisms that confer resistance in the absence of exchange of genetic information. Most of these doubly affected genes are involved in transport or metabolism and only very few, notably ampC (30), are known resistance genes. If simple mutational pathways would be assumed in the development of de novo resistance, then mutations may be directly linked to expression. However, the data suggest that development of de novo resistance requires cellular adjustments regulated in a far more complex manner. Only very few genes were mutated and differentially regulated at the same time, despite the huge number of differentially expressed genes and mutations identified. This indicates that a complex set of adjustments operates within the regulatory network of the cell during adaptation (Table 3).
TABLE 3.
Genes that were simultaneously mutated in the in-frame and/or out-of-frame position (>1,000 bp upstream of differentially expressed genes) and significantly (minimally 2-fold at the 95% confidence level) differentially expressed, even after the antibiotic was removed from the medium
| Antibiotic, position, and genea | Position of mutation | Without indicated antibiotic (fold change) | With indicated antibiotic (fold change) | Gene function |
|---|---|---|---|---|
| Enro | ||||
| Out of frame | ||||
| yieP | 684 bp upstream, G to T; 688 bp upstream, T to A; 706 bp upstream, A to G; 753 bp upstream, T to A | 2.5 | 2.3 | Predicted transcriptional regulator |
| pptA | 95 bp upstream, G to T | 2.3 | 2.1 | Probable 4-oxalocrotonate tautomerase |
| stpA | 35 bp upstream, deletion | −3.3 | −3.4b | H-NS-like DNA-binding protein with RNA chaperone activity |
| fimA | 452 bp upstream, deletion | −7.9 | −8.5 | Major type 1 subunit fimbrin (pilin) |
| In frame | ||||
| dgt | G77G | 3.1 | 2.9 | dGTPase, binds single-stranded DNA |
| fimD | T331Y | −3.8 | −3.9 | Outer membrane protein; export and assembly of type 1 fimbriae |
| gadA | S24P, R31, D39A, F43L | 3.2 | 3.2 | Glutamate decarboxylase A, confers resistance to extreme acid conditions |
| mdlA | N234T | 2.5 | 2.4 | Predicted multidrug transporter subunit of ABC superfamily, ATP-binding component |
| ompF | I336I, I336N | 10.1 | 11.4 | Transporter: outer membrane porin F |
| Amx | ||||
| Out of frame | ||||
| insL | 61 bp and 59 bp upstream, T to C | −2.9 | −1.6 | IS186 hypothetical protein |
| iraM | 528 bp upstream, insertion | −2.2 | −1.6 | Inhibitor of σS proteolysis, contributes to acid resistance |
| narG | 460 bp upstream, insertion | 2.6 | 5.1 | Nitrate reductase 1, alpha subunit |
| Promoter region | ||||
| ampCc | −12 insertion of A | 97.1 | 106.2 | β-Lactamase; penicillin resistance |
| In frame | ||||
| insB-4 | F81L, R65S, Y128H | 2.3 | 2.5 | IS1 protein InsB |
| gadB | D233H, T214P | −5.3 | −22.9 | Glutamate decarboxylase isozyme |
| gadA | H465Y, Q459K | −5.4 | −4.4 | Glutamate decarboxylase A |
| frdD | V117V | 25.3 | 44.7 | Fumarate reductase subunit D/ampC promoter region |
| narG | T236T, A242A, Y245Y, S255S, V257V, T260T | 2.6 | 5.1 | Nitrate reductase 1, alpha subunit |
| Tetra | ||||
| Out of frame | ||||
| fimA | 62 bp upstream, deletion | 8.3 | 9.1 | Major type 1 subunit fimbrin (pilin) |
| higB | 198 bp upstream, T to G; 198 bp upstream, deletion; 199 bp upstream, G to A; 200 bp upstream, C to A/T; 212 bp upstream, C to A | 3.6 | 12.6 | Translation-dependent mRNA interferase, toxin of the HigB-HigA toxin-antitoxin system |
| ompF | 392 bp upstream, insertion | −10.7 | −1.9b | Outer membrane porin F |
| ybdK | 89 bp upstream, deletion | 2.7 | −1.8b | Carboxylate-amine ligase |
| In frame | ||||
| cpxP | S152V | 2.9 | 1.1b | Regulator of the Cpx response and possible chaperone involved in resistance to extracytoplasmic stress |
| gadA | H465Y, Q459K, Y393Y, D233Y, T214S | −2.7 | −41.5 | Glutamate decarboxylase A, part of the glutamate-dependent acid resistance system 2 |
| gadB | H465H, Q459E, N81Y | −2.7 | −40.7 | Glutamate decarboxylase B |
| ompF | I336I, I336N, Y332H, K299N, T298A, T298I, T298T, D288H | −10.7 | −1.9b | Transporter: outer membrane porin F |
| ybfD | A194A, F206F, P218P, K219E | 2.0 | 1.2 | Putative DNA ligase |
| yliE | M89N | −2.2 | −1.1b | Predicted c-di-GMP (3′–5′-cyclic diguanylic acid)-specific phosphodiesterase |
Enro, enrofloxacin; Amx, amoxicillin; Tetra, tetracycline.
Not significantly (P > 0.05) differentially expressed.
Differs from selection criterion ii described in Materials and Methods. Perfect match reads as well as structural variations were identified.
While different genes are mutated upon induction of resistance to different antibiotics, it is not obvious that the same applies to differential regulation. Conceivably a distinction must be made between genes involved in the primary processes, such as efflux pump, and a set of secondary genes that are differentially regulated to compensate and adjust for the effects of the primary effectors. If the same mechanisms are involved in countering the effects of each antibiotic, a similar response at the expression level, up- and downregulating at least a similar set of secondary genes, can be expected. The overlap of genes involved in acquired resistance against the three antibiotics through differential expression was surprisingly small (Fig. 5). Only strains made resistant to enrofloxacin and tetracycline shared a considerable number of coregulated genes. The widely varying sets of differentially regulated genes suggest that different mechanisms are involved in adapting to each antibiotic.
A second question regarding regulation at the expression level is how many genes are rapidly induced upon initial exposure to an antibiotic. To answer this question, the effect of the antibiotic on wild-type genes was studied by exposing the cells to 0.25× MIC, allowing growth but ensuring the effect of the antibiotic (Fig. 6a). Exposure of cells to amoxicillin had the smallest effect on the transcriptomic profile. While wild-type cells showed no significant change in gene expression when exposed to 0.25× MIC, amoxicillin-resistant cells showed 4 suppressed and 8 induced genes. In contrast, the use of 0.125 μg/ml enrofloxacin (0.25× MIC) for the wild-type cells showed a massive effect on the transcriptomic profile, with 303 suppressed and 206 induced genes. When the wild-type cells were made permanently resistant to enrofloxacin, the global transcriptomic effect of enrofloxacin exposure was reversed and only a single gene was differentially expressed by growth at 0.25× MIC (128 μg/ml).
FIG 6.
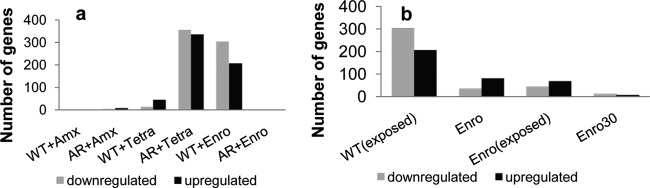
Change in transcriptomic profile of wild-type and antibiotic-resistant E. coli cells in response to short-term (<10 generations) drug exposure and long-term adaptation (>100 generations). (a) Number of up- and downregulated genes after antibiotic exposure (0.25× MIC, 1 μg/ml amoxicillin, 0.25 μg/ml tetracycline, and 0.125 μg/ml enrofloxacin) in wild-type (WT) and antibiotic-resistant (AR) cells compared to wild-type cells. (b) Number of up- or downregulated genes in AR cells compared to wild-type cells for the wild-type cells exposed to 0.25× MIC enrofloxacin [WT(exposed)], enrofloxacin-adapted cells (Enro), enrofloxacin-adapted cells exposed to 0.25× MIC [Enro(exposed)], and enrofloxacin-adapted cells cultured for 30 days without the antibiotic (Enro 30).
To study the opposite effect of rapid induction, growth of adapted cells was followed in the absence of the antibiotic. The number of differentially regulated genes in enrofloxacin-resistant cells reduced from 120 differentially regulated genes after the adaptation phase to 23 genes after growth for 30 days without antibiotic (Fig. 4 and 5), while the MIC remained above 1,024 μg/ml. Only one gene, the NADH-quinone oxidoreductase azoR, had a 2.7-, 6.25-, and 2.2-fold suppressed expression in wild-type cells exposed to enrofloxacin, cells after adaptation, and adapted cells grown in the absence of enrofloxacin, respectively (Fig. 5b). No mutation was found in the coding or upstream region (>1,000 bp) of azoR. When the wild-type cells were exposed to enrofloxacin, 18 genes of the SOS response cluster were upregulated, for example, recA (6-fold) and umuD (32-fold) of the SOS. The SOS response is not induced if the enrofloxacin-resistant strain is exposed to this antibiotic. Upon exposure of the WT strain to tetracycline, induction of the SOS response cluster was not observed. But when the tetracycline-adapted strain is compared to the wild-type strain (without antibiotics), 3 genes belonging to the SOS response (recX, sulA, and umuD) are marginally, but significantly, upregulated (only 2- to 4-fold).
Interaction between adaptation of expression and mutations.
The effects of short-term exposure on expression levels differ strongly from those on long-term adaptation. To elucidate these differences, the induction of resistance by adaptation was compared to the immediate regulation of gene expression upon initial exposure of the wild-type strain to antibiotics. This is illustrated by the expression levels of the wild-type genes in response to short-term exposure and adapted cells in the presence or absence of the antibiotic (Fig. 6). When the role of mutations is large, as for amoxicillin resistance (Fig. 6a) and for high levels of enrofloxacin resistance (Fig. 6b), the role of expression is limited. When mutations have no obvious role, as in the cases of tetracycline resistance and the initial reaction to enrofloxacin exposure, a large number of genes is differentially regulated. These observations suggest that the cell initially reacts to the exposure to antibiotics by differentially expressing genes, but when successful mutations subsequently occur, the role of differential expression is reduced. Thus, the role of mutations in the acquisition of resistance is exactly mirrored by that of differential expression. As an exception, the constitutive upregulation of ampC as a consequence of a mutation in the Pribnow box regulating its expression is a remarkable combination of both. We expected to find physiological differences, such as lower growth rates, upon acquisition of resistance. In reality only cells exposed to tetracycline had lower growth rates (data not shown and reference 9).
DISCUSSION
Taking into consideration all information on the response at the molecular level of E. coli to exposure to antibiotics in this and other studies (5, 6, 10, 25, 31–34), a picture emerges of the cell exploring all possible escape routes both at the transcriptional and at the mutational level. The overall result is an intricate set of interactions between mutations and quantitative adaptations at the enzymatic level that result in enhanced resistance of the cell to the antibiotic it encounters. For each of the three antibiotics applied in this study, the outcome was different, as well as the strategy, as far as that term is valid in this context, since intent cannot be implied. The example of tetracycline is one extreme, as no mutations seem to be involved consistently and many genes are differentially expressed. Enrofloxacin resistance is the other extreme since it is caused by mutations, with a very limited role for regulation of expression once the crucial mutations have occurred. The middle path is taken toward amoxicillin resistance, as the consistent mutations affect the expression of ampC, a beta-lactamase that deactivates amoxicillin effectively (10). The effect of adaptation in reducing the ecological range (10) is confirmed by the downregulation of the acid stress chaperone hdeB (17), which most likely results in a lesser ability of the cell to survive acid stress.
The mutations induced in this study by stepwise increasing exposure to amoxicillin are identical to those found in clinical AmpC hyperproducing E. coli isolates (12, 35) and seem to have the same effect. Acquisition of enrofloxacin resistance utilized different evolutionary pathways that lead to identical phenotypic outcomes. In 36 clinical E. coli isolates, the most abundant change in gyrA was found to be an amino acid change of serine to leucine at position 83 (28), in accordance with our findings. This suggests that while initially some variation occurred in the mutations, the successful final set is limited. This implies a “gambling for existence” search procedure for the optimal mutations, maintaining the most beneficial ones, as shown for long-term adaptation and evolution (36). The different strategies possibly reflect the different operating mechanisms of the antibiotics, with amoxicillin blocking cell wall synthesis, while tetracycline inhibits protein synthesis and enrofloxacin DNA synthesis.
Interestingly, the essential mutations were not reversed when the antibiotic was no longer present, suggesting that the cell pays a limited metabolic price for the mutations, if at all. This in turn raises the question what the advantage is of the wild-type allele. The implication for patient treatment is considerable, as even low levels of induced amoxicillin resistance caused the susceptible population to be outcompeted by cells made moderately resistant due to short-term exposure to nonlethal concentrations of antibiotics (37). The remarkable capability of E. coli to become highly resistant to amoxicillin and enrofloxacin within 100 generations and without observed fitness costs is reflected in the abundant observations of tremendous spread of antibiotic resistance in the environment.
In conclusion, de novo resistance to antibiotics is brought about by a complex interaction of cellular processes, involving both adaptation of expression levels and mutations. Ribosome-sensed induction and efflux-pump activation are examples of mechanisms that initially protect the cell through induction of expression (38) and allow it to survive low levels of antibiotics. Subsequently, mutations are promoted by the SOS response that stimulate the horizontal exchange of resistance genes (11) or stress-induced modulation of genetic instability (39) and result in resistance to higher concentrations. The quantitative adjustment of cellular processes at different levels (40) facilitates the rapid evolution observed during the acquisition of antibiotic resistance.
ACKNOWLEDGMENTS
This work was financed by the Netherlands Food and Consumer Product Safety Authority.
We thank Y. Budovskaya for stimulating discussions and comments on an earlier version of this article.
The students N. M. Lechner, L. Elmann Larsen, and P. Jacobs performed experiments as part of their degree requirements.
We declare that we have no conflicts of interest.
Footnotes
Published ahead of print 19 May 2014
REFERENCES
- 1.Andersson DI, Hughes D. 2010. Antibiotic resistance and its cost: is it possible to reverse resistance? Nat. Rev. Microbiol. 8:260–271. 10.1038/nrmicro2319 [DOI] [PubMed] [Google Scholar]
- 2.Depardieu F, Podglajen I, Leclercq R, Collatz E, Courvalin P. 2007. Modes and modulations of antibiotic resistance gene expression. Clin. Microbiol. Rev. 20:79–114. 10.1128/CMR.00015-06 [DOI] [PMC free article] [PubMed] [Google Scholar]
- 3.Martinez JL, Fajardo A, Garmendia L, Hernandez A, Linares JF, Martinez-Solano L, Sanchez MB. 2009. A global view of antibiotic resistance. FEMS Microbiol. Rev. 33:44–65. 10.1111/j.1574-6976.2008.00142.x [DOI] [PubMed] [Google Scholar]
- 4.Martinez JL, Rojo F. 2011. Metabolic regulation of antibiotic resistance. FEMS Microbiol. Rev. 35:768–789. 10.1111/j.1574-6976.2011.00282.x [DOI] [PubMed] [Google Scholar]
- 5.Toprak E, Veres A, Michel JB, Chait R, Hartl DL, Kishony R. 2012. Evolutionary paths to antibiotic resistance under dynamically sustained drug selection. Nat. Genet. 44:101–105. 10.1038/ng.1034 [DOI] [PMC free article] [PubMed] [Google Scholar]
- 6.Kohanski MA, Depristo MA, Collins JJ. 2010. Sublethal antibiotic treatment leads to multidrug resistance via radical-induced mutagenesis. Mol. Cell 37:311–320. 10.1016/j.molcel.2010.01.003 [DOI] [PMC free article] [PubMed] [Google Scholar]
- 7.Kohanski MA, Dwyer DJ, Hayete B, Lawrence CA, Collins JJ. 2007. A common mechanism of cellular death induced by bactericidal antibiotics. Cell 130:797–810. 10.1016/j.cell.2007.06.049 [DOI] [PubMed] [Google Scholar]
- 8.Fang FC. 2013. Antibiotic and ROS linkage questioned. Nat. Biotechnol. 31:415–416. 10.1038/nbt.2574 [DOI] [PubMed] [Google Scholar]
- 9.van der Horst MA, Schuurmans JM, Smid MC, Koenders BB, Ter Kuile BH. 2011. De novo acquisition of resistance to three antibiotics by Escherichia coli. Microb. Drug Resist. 17:141–147. 10.1089/mdr.2010.0101 [DOI] [PubMed] [Google Scholar]
- 10.Händel N, Schuurmans JM, Brul S, ter Kuile BH. 2013. Compensation of the metabolic costs of antibiotic resistance by physiological adaptation in Escherichia coli. Antimicrob. Agents Chemother. 57:3752–3762. 10.1128/AAC.02096-12 [DOI] [PMC free article] [PubMed] [Google Scholar]
- 11.Beaber JW, Hochhut B, Waldor MK. 2004. SOS response promotes horizontal dissemination of antibiotic resistance genes. Nature 427:72–74. 10.1038/nature02241 [DOI] [PubMed] [Google Scholar]
- 12.Corvec S, Caroff N, Espaze E, Marraillac J, Reynaud A. 2002. −11 Mutation in the ampC promoter increasing resistance to beta-lactams in a clinical Escherichia coli strain. Antimicrob. Agents Chemother. 46:3265–3267. 10.1128/AAC.46.10.3265-3267.2002 [DOI] [PMC free article] [PubMed] [Google Scholar]
- 13.Drlica K, Hiasa H, Kerns R, Malik M, Mustaev A, Zhao X. 2009. Quinolones: action and resistance updated. Curr. Top. Med. Chem. 9:981–998. 10.2174/156802609789630947 [DOI] [PMC free article] [PubMed] [Google Scholar]
- 14.Evans CGT, Herbert D, Tempest DW. 1970. The continuous culture of microorganisms. II. Construction of a chemostat. In Norris JR, Ribbons DW. (ed), Methods in microbiology, vol 2 Academic Press, London, United Kingdom [Google Scholar]
- 15.Schuurmans JM, Nuri Hayali AS, Koenders BB, ter Kuile BH. 2009. Variations in MIC value caused by differences in experimental protocol. J. Microbiol. Methods 79:44–47. 10.1016/j.mimet.2009.07.017 [DOI] [PubMed] [Google Scholar]
- 16.Schuurmans JM, van Hijum SA, Piet JR, Handel N, Smelt J, Brul S, Ter Kuile BH. 2014. Effect of growth rate and selection pressure on rates of transfer of an antibiotic resistance plasmid between E. coli strains. Plasmid 72C:1–8. 10.1016/j.plasmid.2014.01.002 [DOI] [PubMed] [Google Scholar]
- 17.Kern R, Malki A, Abdallah J, Tagourti J, Richarme G. 2007. Escherichia coli HdeB is an acid stress chaperone. J. Bacteriol. 189:603–610. 10.1128/JB.01522-06 [DOI] [PMC free article] [PubMed] [Google Scholar]
- 18.Tramonti A, De Canio M, Delany I, Scarlato V, De Biase D. 2006. Mechanisms of transcription activation exerted by GadX and GadW at the gadA and gadBC gene promoters of the glutamate-based acid resistance system in Escherichia coli. J. Bacteriol. 188:8118–8127. 10.1128/JB.01044-06 [DOI] [PMC free article] [PubMed] [Google Scholar]
- 19.Eicher T, Brandstatter L, Pos KM. 2009. Structural and functional aspects of the multidrug efflux pump AcrB. Biol. Chem. 390:693–699. 10.1515/BC.2009.090 [DOI] [PubMed] [Google Scholar]
- 20.Grundstrom T, Jaurin B. 1982. Overlap between ampC and frd operons on the Escherichia coli chromosome. Proc. Natl. Acad. Sci. U. S. A. 79:1111–1115. 10.1073/pnas.79.4.1111 [DOI] [PMC free article] [PubMed] [Google Scholar]
- 21.Jaurin B, Grundstrom T, Normark S. 1982. Sequence elements determining ampC promoter strength in E. coli. EMBO J. 1:875–881 [DOI] [PMC free article] [PubMed] [Google Scholar]
- 22.Tracz DM, Boyd DA, Hizon R, Bryce E, McGeer A, Ofner-Agostini M, Simor AE, Paton S, Mulvey MR, Canadian Nosocomial Infection Surveillance Program 2007. ampC gene expression in promoter mutants of cefoxitin-resistant Escherichia coli clinical isolates. FEMS Microbiol. Lett. 270:265–271. 10.1111/j.1574-6968.2007.00672.x [DOI] [PubMed] [Google Scholar]
- 23.Kawecki TJ, Lenski RE, Ebert D, Hollis B, Olivieri I, Whitlock MC. 2012. Experimental evolution. Trends Ecol. Evol. 27:547–560. 10.1016/j.tree.2012.06.001 [DOI] [PubMed] [Google Scholar]
- 24.Lang GI, Rice DP, Hickman MJ, Sodergren E, Weinstock GM, Botstein D, Desai MM. 2013. Pervasive genetic hitchhiking and clonal interference in forty evolving yeast populations. Nature 500:571–574. 10.1038/nature12344 [DOI] [PMC free article] [PubMed] [Google Scholar]
- 25.Wielgoss S, Barrick JE, Tenaillon O, Wiser MJ, Dittmar WJ, Cruveiller S, Chane-Woon-Ming B, Medigue C, Lenski RE, Schneider D. 2013. Mutation rate dynamics in a bacterial population reflect tension between adaptation and genetic load. Proc. Natl. Acad. Sci. U. S. A. 110:222–227. 10.1073/pnas.1219574110 [DOI] [PMC free article] [PubMed] [Google Scholar]
- 26.Marcusson LL, Frimodt-Moller N, Hughes D. 2009. Interplay in the selection of fluoroquinolone resistance and bacterial fitness. PLoS Pathog. 5:e1000541. 10.1371/journal.ppat.1000541 [DOI] [PMC free article] [PubMed] [Google Scholar]
- 27.Heddle J, Maxwell A. 2002. Quinolone-binding pocket of DNA gyrase: role of GyrB. Antimicrob. Agents Chemother. 46:1805–1815. 10.1128/AAC.46.6.1805-1815.2002 [DOI] [PMC free article] [PubMed] [Google Scholar]
- 28.Everett MJ, Jin YF, Ricci V, Piddock LJ. 1996. Contributions of individual mechanisms to fluoroquinolone resistance in 36 Escherichia coli strains isolated from humans and animals. Antimicrob. Agents Chemother. 40:2380–2386 [DOI] [PMC free article] [PubMed] [Google Scholar]
- 29.Madurga S, Sanchez-Cespedes J, Belda I, Vila J, Giralt E. 2008. Mechanism of binding of fluoroquinolones to the quinolone resistance-determining region of DNA gyrase: towards an understanding of the molecular basis of quinolone resistance. Chembiochem 9:2081–2086. 10.1002/cbic.200800041 [DOI] [PubMed] [Google Scholar]
- 30.Siu LK, Lu PL, Chen JY, Lin FM, Chang SC. 2003. High-level expression of ampC beta-lactamase due to insertion of nucleotides between -10 and -35 promoter sequences in Escherichia coli clinical isolates: cases not responsive to extended-spectrum-cephalosporin treatment. Antimicrob. Agents Chemother. 47:2138–2144. 10.1128/AAC.47.7.2138-2144.2003 [DOI] [PMC free article] [PubMed] [Google Scholar]
- 31.Fong SS, Joyce AR, Palsson BO. 2005. Parallel adaptive evolution cultures of Escherichia coli lead to convergent growth phenotypes with different gene expression states. Genome Res. 15:1365–1372. 10.1101/gr.3832305 [DOI] [PMC free article] [PubMed] [Google Scholar]
- 32.Lee HH, Molla MN, Cantor CR, Collins JJ. 2010. Bacterial charity work leads to population-wide resistance. Nature 467:82–85. 10.1038/nature09354 [DOI] [PMC free article] [PubMed] [Google Scholar]
- 33.Palmer AC, Kishony R. 2013. Understanding, predicting and manipulating the genotypic evolution of antibiotic resistance. Nat. Rev. Genet. 14:243–248. 10.1038/nrg3351 [DOI] [PMC free article] [PubMed] [Google Scholar]
- 34.Weinreich DM, Delaney NF, Depristo MA, Hartl DL. 2006. Darwinian evolution can follow only very few mutational paths to fitter proteins. Science 312:111–114. 10.1126/science.1123539 [DOI] [PubMed] [Google Scholar]
- 35.Caroff N, Espaze E, Gautreau D, Richet H, Reynaud A. 2000. Analysis of the effects of −42 and −32 ampC promoter mutations in clinical isolates of Escherichia coli hyperproducing ampC. J. Antimicrob. Chemother. 45:783–788. 10.1093/jac/45.6.783 [DOI] [PubMed] [Google Scholar]
- 36.Barrick JE, Yu DS, Yoon SH, Jeong H, Oh TK, Schneider D, Lenski RE, Kim JF. 2009. Genome evolution and adaptation in a long-term experiment with Escherichia coli. Nature 461:1243–1247. 10.1038/nature08480 [DOI] [PubMed] [Google Scholar]
- 37.Feng Y, Händel N, De Groot, MHP. Brul S, Schultsz C, Ter Kuile BH. 2014. Experimental simulation of the effects of an initial antibiotic treatment on a subsequent treatment after initial therapy failure. Antibiotics 3:49–63. 10.3390/antibiotics3010049 [DOI] [PMC free article] [PubMed] [Google Scholar]
- 38.Chancey ST, Zahner D, Stephens DS. 2012. Acquired inducible antimicrobial resistance in Gram-positive bacteria. Future Microbiol. 7:959–978. 10.2217/fmb.12.63 [DOI] [PMC free article] [PubMed] [Google Scholar]
- 39.Fonville NC, Ward RM, Mittelman D. 2011. Stress-induced modulators of repeat instability and genome evolution. J. Mol. Microbiol. Biotechnol. 21:36–44. 10.1159/000332748 [DOI] [PMC free article] [PubMed] [Google Scholar]
- 40.ter Kuile BH, Westerhoff HV. 2001. Transcriptome meets metabolome: hierarchical and metabolic regulation of the glycolytic pathway. FEBS Lett. 500:169–171. 10.1016/S0014-5793(01)02613-8 [DOI] [PubMed] [Google Scholar]
- 41.Huang da W, Sherman BT, Lempicki RA. 2009. Systematic and integrative analysis of large gene lists using DAVID bioinformatics resources. Nat. Protoc. 4:44–57. 10.1038/nprot.2008.211 [DOI] [PubMed] [Google Scholar]