

Abstract
Artemether-lumefantrine (AL) is the first-line treatment for uncomplicated malaria in the second and third trimesters of pregnancy. Its efficacy during pregnancy has recently been challenged due to altered pharmacokinetic (PK) properties in this vulnerable group. The aim of this study was to determine the PK profile of AL in pregnant and nonpregnant women and assess their therapeutic outcome. Thirty-three pregnant women and 22 nonpregnant women with malaria were treated with AL (80/480 mg) twice daily for 3 days. All patients provided five venous plasma samples for drug quantification at random times over 7 days. Inter- and intraindividual variability was assessed, and the effects of covariates were quantified using a nonlinear mixed-effects modeling approach (NONMEM). A one-compartment model with first-order absorption and elimination with linear metabolism from drug to metabolite fitted the data best for both arthemether (AM) and lumefantrine (LF) and their metabolites. Pregnancy status and diarrhea showed a significant influence on LF PK. The relative bioavailability of lumefantrine and its metabolism rate into desmethyl-lumefantrine were, respectively, 34% lower and 78% higher in pregnant women than in nonpregnant patients. The overall PCR-uncorrected treatment failure rates were 18% in pregnant women and 5% in nonpregnant women (odds ratio [OR] = 4.04; P value of 0.22). A high median day 7 lumefantrine concentration was significantly associated with adequate clinical and parasitological response (P = 0.03). The observed reduction in the relative bioavailability of lumefantrine in pregnant women may explain the higher treatment failure in this group, mostly due to lower posttreatment prophylaxis. Hence, a modified treatment regimen of malaria in pregnancy should be considered.
INTRODUCTION
Malaria during pregnancy is a major public health problem, which is associated with high maternal and perinatal mortality in tropical and subtropical regions (1). Pregnant women are at increased risk of clinical malaria compared to nonpregnant women because of the associated immunological and hormonal changes in pregnancy (2). Substantial direct risks to pregnant women include severe maternal anemia, and the risks affecting the baby are intrauterine growth retardation, intrauterine death, stillbirth, premature delivery, low birth weight, and perinatal and neonatal morbidity and mortality (3). Because of all this, malaria during pregnancy should be treated effectively.
Artemether-lumefantrine (AL) (20 mg and 120 mg, respectively) is one of the most popular and efficacious fixed-dose artemisinin-based combination therapies (ACTs) against Plasmodium falciparum. It is currently available at a subsidized cost in most countries where malaria is endemic. AL has proved to be not inferior to quinine in East Africa for the treatment of P. falciparum infection in the second and third trimesters of pregnancy (4). ACTs are recommended by the World Health Organization (WHO) as the first-line treatment for uncomplicated malaria in the second and third trimesters of pregnancy (5). Unfortunately, general interindividual variability for drug absorption, distribution to different compartments of the body and tissues, plasma binding proteins, rate of metabolism, enterohepatic recirculation, and excretion may be associated with changes in the bioavailability of a drug and consequently may affect the therapeutic efficacy (6).
Pregnancy has been reported to affect the efficacy of some drugs, including antimalarial drugs. This is due to physiological changes that lower drug absorption, speed up drug clearance, and increase body fluid volume of distribution (7–9). Elevated levels of estrogens, progesterone, cortisol, and prolactin hormones during pregnancy have been linked to altered metabolic activity of several hepatic cytochrome P450 enzymes. For instance, catalytic activity of CYP3A4, CYP2C9, and CYP2A6 enzymes increases during pregnancy (10, 11), and these enzymes are responsible for lumefantrine and artemether metabolism (12, 13). Hence, it is expected that significant alteration of the pharmacokinetics (PK) of most antimalarial drugs during pregnancy occurs, which may be associated with lower drug concentrations and lower antimalarial cure rate, especially in advanced pregnancy (14–16). A higher treatment failure rate has indeed been observed for pregnant women compared to nonpregnant ones living in the same area (16). Several PK studies on artemether (AM) and lumefantrine (LF) and their respective metabolites, dihydroartemisinin (DHA) and debutyl-lumefantrine (DLF), have demonstrated low concentrations of these drugs in plasma in pregnant women compared to nonpregnant adults. However, most of these studies included healthy male adult volunteers as a comparative group rather than female malaria patients (16–19). Because of various determinants of PK and therapeutic outcome, it is essential to have a comparative population of nonpregnant women of the same study area with the same disease.
An important concern during the course of AL treatment is to achieve adequate residual LF level after complete elimination of AM and DHA so that it may clear all residual malaria parasites (9). Therefore, day 7 LF concentration has been proposed as a good indicator of AL effectiveness (20, 21). A recent pharmacokinetics study of AL in Cambodia and Tanzania reported that the targeted day 7 LF concentration was also not achieved in a significant number of nonpregnant adult patients. In Tanzania, 35% of samples had LF concentration below the cutoff value of 175 ng/ml at day 7 (22). During pregnancy, when host antiparasite immunity is somehow compromised (2), a higher day 7 venous concentration of LF may be required than what has previously been proposed in studies of nonpregnant adult patients, i.e., a cutoff value of 175 ng/ml or 280 ng/ml in order to achieve effective therapeutic outcome and 600 ng/ml for maximal efficacy (23, 24). Some predictive models have suggested that a twice-daily regimen of AL for 5 days would be preferable in later pregnancy in order to achieve sufficient drug concentration in plasma (19). Increasing the duration of AL administration is indeed expected to increase the residual LF level in the subsequent posttreatment cycle so as to reduce the chance of recrudescence (22). This should be interpreted with caution, because extending the duration of treatment regimen may possibly lead to lower adherence. Doubling the dose might be another option, but it may not be appropriate because absorption of LF is dose limited (25).
The aim of the present study was to characterize the PK profiles of AL and their metabolites, to determine their variability, and to identify factors that might explain variations in drugs and metabolite levels in pregnant (second and third trimesters of pregnancy) and nonpregnant women living in the same area and to assess cure rate and parasitological clearance in these two groups. The model developed for lumefantrine was used to simulate day 7 concentrations under standard and alternative dosage regimens and quantify the percentages of pregnant and nonpregnant women having concentrations below different proposed cutoff thresholds.
MATERIALS AND METHODS
Study design and procedures.
This study was conducted in Rufiji district in a coastal region in eastern Tanzania. The asexual parasitemia prevalence is 14%, and Plasmodium falciparum is the predominant species (26). The study was carried out at the Kibiti health center from April to September 2012. Approval for the study was granted by two independent ethical review bodies: (i) the Research Ethics Committee of the Ifakara Health Institute (IHI) and (ii) the National Institute for Medical Research (NIMR) Ethical Committee. All women signed an informed consent form prior to enrollment in the study.
Pregnant and nonpregnant women diagnosed with uncomplicated malaria were recruited from either the outpatient department or Reproductive and Child Health (RCH) clinic. Inclusion criteria were women aged 18 years and above, resident of Rufiji study area, pregnant and in the second or third trimester, and having signs or symptoms suggestive of uncomplicated malaria with fever (axillary temperature of ≥37.5°C) or history of fever for the past 24 h, P. falciparum detected by microscopy, and hemoglobin level of ≥7 g/dl. Exclusion criteria were known allergy to AL or quinine; history of renal, liver, or heart problem; hyperparasitemia above 200,000/μl; reported intake of any antimalarial drug within the past 28 days; unable to take oral medication; and vomiting the medication within 1 h of taking the first dose. The same criteria applied to nonpregnant women (control group) that were recruited concurrently during the same study period after informed consent. A full medical history, including concomitant illness and concomitant medication, was recorded. Clinical examination on the day of enrollment in the study was performed by an experienced physician. Patients were also seen by the clinician during follow-up visits on days 1, 2, 3, 7, 14, 28, and 42 when axillary temperature was measured and malaria-related symptoms were evaluated (5). Gestational age was determined from the estimated first day of the last normal menstrual period and compared to clinical examination of a fundal height. In case of any discrepancy, gestational age was recalculated from the estimated age at the first RCH visit.
Drug regimen.
Enrolled participants received four tablets of artemether-lumefantrine (AL) (Coartem; Novartis Pharma AG, Basel, Switzerland) (20 mg artemether [AM] and 120 mg lumefantrine [LF]) over the course of 3 days at 0, 8, 24, 36, 48, and 60 h. Each dose was administered with 200 ml of milk containing 4.5 g of fat because of the associated increase in LF bioavailability when taken with a meal rich in fat (27). All patients were asked to come back to the health center for each drug administration and observed for 1 h after dose intake. None of the patients was admitted during the course of AL treatment, but one pregnant woman who developed severe malaria on day 1 was admitted, and the treatment was changed to intravenous quinine. A limited number of patients were administered drug at home by the study's clinician or field assistant, specifically for those who had difficulty coming to the clinic at scheduled times for observed drug administration.
Blood samples.
To determine AM, dihydroartemisinin (DHA), LF, and debutyl-lumefantrine (DLF) concentrations, 2 ml of venous blood was drawn from the patient at random times between 8 and 11 a.m. on days 0, 1, 2, 3, and 7. The schedule for sample collections agrees with WHO recommendation for lumefantrine concentration measurement, but is suboptimal for artemether due to practical difficulties for patients to return to the health center for all requested time points (21). Day 0 blood sample was collected before starting the medication as a baseline so as to determine the presence of any antimalarial in the patient's plasma prior to treatment due to intake of nondeclared drugs (28, 29). The blood samples in EDTA Vacutainer tubes were centrifuged at 2,000 × g for 5 min, and the plasma samples were stored in cryotubes. Samples were kept at −25°C for at most 6 weeks before transferred to the Ifakara Health Institute Bagamoyo clinical laboratory for temporary storage at −80°C. It is known that the storage of plasma samples for bioassay of artemether and lumefantrine and their metabolites at −20°C for 8 months does not affect drug concentration (21). All samples were packed in dry ice and then shipped to the clinical pharmacology laboratory of the University Hospital in Lausanne, Switzerland, for the drug bioassay.
To estimate the parasite density and clearance rate, capillary blood from a finger prick was taken at days 0, 3, 7, 14, 28, and 42. Samples were collected on slides and Giemsa stained, and thick and thin blood smears were examined by two different experienced microscopists using light microscopy. The number of parasites in thick blood smears were counted per 200 leukocytes, and the parasite count was multiplied by a factor of 40 to give the number of parasites per microliter of blood. Approximately 50 μl of finger pricked blood was spotted onto Whatman filter paper cards (3MM). DNA was extracted from Whatman filter paper cards by the Chelex method (30). In order to differentiate between recrudescence and new infection, samples were genotyped by the most polymorphic marker, the merozoite surface protein 2 (MSP2) and the amplicons were visualized in a 2% agarose gel as described elsewhere (31).
Drug assay.
The concentrations of AM, DHA, LF, and DLF in plasma were determined using a validated liquid chromatography-tandem mass spectrometry (LC-MS/MS) method (32). The presence of 10 other antimalarial drugs and metabolites, i.e., artesunate, amodiaquine, N-desethyl-amodiaquine, piperaquine, pyronaridine, mefloquine, chloroquine, pyrimethamine, and sulfadoxine, were also assessed at the same time. This is standard procedure for LC-MS/MS, and it helps to ensure that the malaria outcome that was observed was due to AL intake, and not to any other residual antimalarial. The assay is precise (3.1% to 12.6% for interday variation coefficient) and sensitive (0.15 to 3.0 ng/dl for lower limit quantification [LOQ] of basic or neutral antimalarial and 0.75 to 5 ng/dl for artemisinin derivatives).
The bioassays were carried out at the Laboratory of Clinical Pharmacology of the Lausanne University Hospital, which takes part in the quality control system of the WorldWide Antimalarial Resistance Network (WWARN).
Efficacy assessment.
AL efficacy was determined by cure rate and parasitological clearance. The definition of treatment response was according to WHO recommendations on the methods for surveillance of antimalarial drug efficacy (33). Treatment response was thus classified into early treatment failure (ETF), late clinical failure (LCF), late parasitological failure (LPF), and adequate clinical and parasitological response (ACPR). Participants who developed either clinical or parasitological failure as defined above received quinine (10 mg/kg of body weight) three times a day for 7 days, according to standard treatment guidelines (34).
Pharmacokinetic analysis.
Drugs and their metabolites were modeled using the NONMEM computer program version 7.2 (NM-TRAN version II) (35)with the PsN-Toolkit version 3.5.3 (36). The program uses mixed-effects (fixed and random) regression to estimate population means and variances of the pharmacokinetic parameters and to identify the factors that influence them.
Structural model.
One- and two-compartment models with first-order absorption and elimination and linear metabolization to DLF and DHA were compared to describe LF and AM pharmacokinetics, respectively, with an additional compartment used to characterize metabolite data. Sequential and simultaneous parent-metabolite modeling methods were used for LF/DLF and AM/DHA, respectively. The final estimated parameters were drug and metabolite systemic clearance (CL and CLmet, respectively), volume of distribution of the central compartment (Vc), and metabolism rate constant from the drug to the metabolite compartment (K23). Owing to identification problems, the volume of distributions of DLF and DHA could not be estimated and were assumed to be equal to those of LF and AM, respectively. Because of the limited number of measurements in the absorption phase, the absorption rate constants (Ka) could not be adequately estimated and were thus fixed at 0.7 and 0.54 h−1 to achieve peak plasma AM and LF concentrations, respectively, 2 h and 6 to 8 h after drug intake (37). Finally, the known presystemic conversion of AM into DHA was modeled estimating the fraction of the AM dose directly converted into the metabolite using 1 − F1, with F1 = 1 representing the relative bioavailability of AM. Since the drugs were given orally, these parameters represent apparent values. In case the analysis of baseline plasma samples showed nonzero concentration of the drugs (suggesting that AL was previously taken), a factor (F0) was introduced in the model in order to estimate the residual doses from previous treatments.
Statistical model.
Interpatient variability of all the PK parameters was described by exponential errors following a log normal distribution, as illustrated by the equation θj = θexp(ηj), where θj is the pharmacokinetic parameter associated with the jth individual, θ is the average population value, and ηj is the jth individual component of the interpatient random effect, an independent, normally distributed variable with mean 0 and variance ω2. In order to constrain individual F1 to vary between 0 and 1, a logit function (logit F1) was used. Correlations between PK parameters were also investigated. Finally, proportional, additive, and combined proportional-additive error models were compared to describe the intrapatient (residual) variability for both drug and metabolite. The correlation between drug and metabolite concentration measurements was tested using the NONMEM L2 item.
Covariate model.
The available covariates were pregnancy status, body weight, body mass index (BMI), age, gestational age, and diarrhea. The covariate analysis was performed using a stepwise insertion/deletion approach. Visual inspection of the correlation between post hoc individual estimates of the PK parameters and the available patients' characteristics was conducted at first. During the forward selection, potential covariates influencing the kinetic parameters were sequentially incorporated in the model and retained if statistical significance was achieved in NONMEM (P < 0.05). Backward deletion was performed once the model, including all the significant factors was built. It consisted of removing the covariates one at time, starting from the most insignificant one, until no further nonsignificant deterioration of the model was observed (P < 0.01). The typical value of the pharmacokinetic parameters θ was modeled to depend linearly on the covariate X (continuous covariates centered on the population median; dichotomous variables coded as 0 and 1) using θ = θa(1 + θbX), where θa is the mean estimate and θb is the relative deviation of the mean due to the X covariate. Body weight (BW) effect was alternatively modeled using the allometric function θ = θa(BW/MBW)θc, where MBW is the median population BW and θc was fixed to the values in the literature, i.e., 0.75 for CL and 1 for V. Linear and allometric functions were then compared to identify the model describing at best the relationships between BW and the pharmacokinetic parameters.
Selection of the model and parameter estimation.
Drugs and metabolites were fitted by use of the first-order conditional (FOCE) method with interaction using the ADVAN5 subroutine. Concentrations below the quantification limit (BQL) of the assay were treated using the M3 method described by Beal (38) as implemented by Ahn et al. (39). Nevertheless, when using the L2 function, BQL data were replaced by LOQ/2 and handled by the M6 approach (38). The log likelihood ratio test, based on differences in the objective function value (ΔOFV) provided by NONMEM, was employed to discriminate between hierarchical models. Since a ΔOFV between any two models approximates a χ2 distribution, a change of the objective function was considered statistically significant if it exceeded 3.84 (P < 0.05) for one additional parameter in model building and covariate forward-addition steps or 6.63 (P < 0.01) in covariate backward elimination. The Akaike information criterion (AIC) was used to compare nonnested models. Shrinkage was also examined. Additional criteria for model selection were diagnostic goodness-of-fit plots, precision of pharmacokinetic parameter estimates, and the reduction of the interpatient variability in parameters.
Validation of the model.
The stability of the final model was assessed by means of the bootstrap method implemented in PsN, generating 2,000 data sets by resampling from the original data set. Mean parameter values with their 95% confidence intervals (CI95%s) were derived and compared with the final pharmacokinetic model estimates. Model validation was performed by visual predictive checks (VPC), simulating data for 1,000 individuals based on the final model and generating 2.5th, 50th, and 97.5th percentiles. The observed concentrations were plotted against the 95% prediction interval (PI95%) of the simulated data set at each time point and visually compared. Figures were generated with GraphPad Prism (version 6.00 for Windows; GraphPad Software, San Diego, CA, USA).
Model-based stimulation for LF.
The concentration-time profiles of LF in 1,000 individuals receiving two different regimens of 6 doses over 3 days (at 0, 8, 24, 36, 48, and 60 h) and 5 days (at 0, 8, 24, 48, 72, and 96 h) were derived by simulations based on the final model, including interpatient variability. Day 7 predicted median concentrations with their PI95%s for pregnant and nonpregnant women were derived. In addition, these simulations allowed quantification of the percentages of pregnant and nonpregnant women having a day 7 concentration below different proposed cutoff thresholds of 175 ng/ml, 280 ng/ml, and 600 ng/ml associated with treatment efficacy (24, 40, 41).
Other statistical analyses.
The relation of the outcome variable (treatment failure) and explanatory variables were tested using a t test for continuous variables (predicted LF day 7 concentration, gestation age, baseline parasite count, and BMI) and Pearson chi-square test for categorical variable (pregnancy status, residual antimalarial, and diarrhea). A P value below 0.05 was considered statistically significant. All the statistical analyses were performed using STATA 12.0 (Stata Corporation, College Station, TX, USA).
RESULTS
Demographic and clinical parameters.
Thirty-five pregnant women and 22 nonpregnant women with acute Plasmodium falciparum malaria were enrolled in the study from 23 April to 5 September 2012. Two of the enrolled pregnant women were withdrawn from the study on days 2 and 7 because they refused to continue participating in the study. Two (9.1%) nonpregnant women were lost for follow-up at day 42. None of the pregnant women was lost for follow-up. The baseline characteristics of pregnant and nonpregnant women are presented in Table 1. Two pregnant women presented with diarrhea on the day of enrollment in the study and throughout the course of treatment. None of the study participants vomited the drug. All participants had normal physical condition on examination with no history of a chronic disease or smoking. Twenty-six women (14 pregnant women and 12 nonpregnant women) reported taking paracetamol before enrollment. The median gestational age for pregnant women was 27 (range, 14 to 37) weeks with relatively equal numbers of women in the second and third trimesters of pregnancy. No participant during the study period had a miscarriage or stillbirth or severe adverse drug reaction.
TABLE 1.
Characteristics of study participants with P. falciparum malaria on the day of enrollment in the study
| Characteristic | Value for characteristica for: |
|
|---|---|---|
| Pregnant women (n = 33) | Nonpregnant women (n = 22) | |
| Age (yr) | 25 (18–41) | 21.5 (18–35) |
| Body wt (kg) | 52 (40–80) | 48.5 (41–79) |
| Ht (cm) | 158 (147–169) | 157 (150–174) |
| BMI | 21.8 (16.5–30.1) | 20.3 (16.4–33.3) |
| Hemoglobin (g/dl) | 10.2 (7.1–13.3) | 13.4 (8–15.5) |
| Temp (°C) | 37.1 (36.0–39) | 37.2 (36.0–39.6) |
| Parasitemia (counts/μl) | 25,280 (560–198,080) | 22,280 (560–195,680) |
| Gestational age (wk) | 27 (14–37) | NA |
| Pregnancy | ||
| Second trimester | 17 (52) | NA |
| Third trimester | 16 (48) | NA |
Most values are medians with the ranges in parentheses. For pregnancy, the values the numbers of women with the percentages in parentheses. NA, not applicable.
Residual antimalarial.
Blood samples from all 57 recruited participants in the study were screened to determine the presence of any antimalarial drugs prior to initiation of malaria treatment. Fifty-five (96.5%) had at least one antimalarial in their plasma: 89.5% (29 pregnant women and 22 nonpregnant women) of participants had plasma LF above the LOQ, but the drug concentration was generally low, with an average value of 37.3 ng/ml. Other antimalarial drugs that were detected were DLF in 8 patients (14.0%), AM in 4 patients (7%), sulfadoxine in 14 patients (24.6%), pyrimethamine in 11 patients (19.3%), and quinine in 1 patient (1.8%). Summarized statistics are shown in Table 2. Out of 14 participants detected with sulfadoxine, 13 were pregnant with a median baseline parasitemia of 72,086 (range, 3,920 to 198,080) counts/μl (Fig. 1). Sulfadoxine concentration persisted at relatively constant concentration throughout the first 7 days of monitoring plasma drug levels.
TABLE 2.
Concentrations of residual antimalarial drugs in plasma detected prior to treatment with AL in 57 recruited study patients
| Antimalarial | No. of patients (%) | Antimalarial drug concn in plasma (ng/ml) |
|||
|---|---|---|---|---|---|
| Mean | Median | Minimum | Maximum | ||
| Lumefantrine | 51 (89.5) | 37.3 | 24.9 | 5.4 | 205.5 |
| Desbutyl-lumefantrine | 8 (14.0) | 2.5 | 1.5 | 0.3 | 6 |
| Artemether | 4 (7) | 26.4 | 2.9 | 0.4 | 157.3 |
| Sulfadoxine | 14 (24.6) | 1,334.3 | 1,298.1 | 5.3 | 3,615.6 |
| Pyrimethamine | 11 (19.6) | 6.9 | 5.3 | 1.7 | 18 |
| Quinine | 1 (1.8) | 12.3 | 12.3 | 12.3 | 12.3 |
FIG 1.
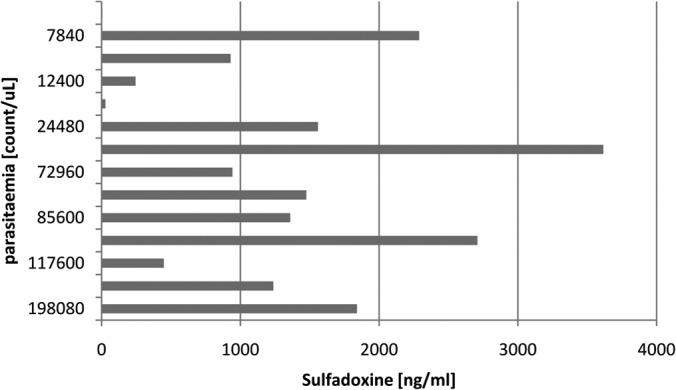
Relationship between parasite density at enrollment in this study and residual levels of sulfadoxine in plasma before treatment in 14 pregnant women.
Population pharmacokinetic analysis.
A total of 265 LF, 263 DLF, 146 AM, and 98 DHA concentrations in plasma were included in the analysis. Twenty-five percent (n = 37) AM, 7% (n = 7) DHA, and 2% (n = 4) DLF concentrations were below the respective LOQs. The median (range) numbers of samples available per study subject were 5 (4 to 5) for LF, 4 (3 to 5) for DLF, 3 (1 to 5) for AM, and 2 (1 to 4) for DHA.
Artemether.
AM and DHA pharmacokinetics were best described using a one-compartment model with first-order absorption from the gastrointestinal tract and linear metabolism to DHA, including presystemic conversion into the metabolite. Elimination of both compounds was modeled using a first-order process. The few basal AM concentrations did not allow estimation of a residual dose from previous treatments. Inclusion of interpatient variability of Vc, CLmet, K23, or F1 in addition to AM CL did not improve description of the data (ΔOFV ≥ −1.9; P ≥ 0.17). A mixed-error model best described residual intrapatient variability for AM and a proportional one for DHA. No correlations between the drug and metabolite concentrations could be identified. Structural model shrinkages lower than 15% were found for all the inter- and intraindividual variability. Our results show that 21% of the AM dose is converted presystemically into DHA. None of the available covariates significantly affected AM or DHA pharmacokinetics (ΔOFV ≤ 3.0; P ≥ 0.08). Although nonsignificant, an increase of 37% in drug CL in pregnant women compared to nonpregnant ones was observed however (ΔOFV = −1 and P = 0.32). The final model parameter estimates and bootstrap evaluations are given in Table 3. The model was considered reliable, since the parameter estimates obtained lay within the bootstrap CI95%. VPC graphs of AM and DHA are shown in Fig. 2A.
TABLE 3.
Final population parameter estimates of artemether and lumefantrine, and their metabolites and their bootstrap evaluations in 2,000 replicates
| Antimalarial drug and parametera | Population pharmacokinetics analysis |
Bootstrap evaluation |
||||||
|---|---|---|---|---|---|---|---|---|
| Estimate | θi SEb (%) | IIVc (%) | SEd (%) | Estimate | CI95%e | IIV (%) | CI95% | |
| Artemether | ||||||||
| CL (liter/h) | 98 | 24 | 99 | 65 | 102 | 69 to 140 | 93 | 66 to 120 |
| Vc (liter) | 373 | 16 | 354 | 225 to 492 | ||||
| Logit F1 | 1.4 | 27 | 1.5 | 0.7 to 2.6 | ||||
| Ka (h−1) | Fixed at 0.70 | |||||||
| VM (liter) | Fixed to Vc | |||||||
| K23 (h−1) | 0.084 | 0.088 | 0.05 to 0.16 | |||||
| CLmet (liter/h) | 71 | 46 | 69 | 38 to 136 | ||||
| σprop,AM (CV%) | 72 | 26 | 69 | 49 to 87 | ||||
| σadd,AM (μmol/liter) | 0.13 | 7 | 0.13 | 0.03 to 0.20 | ||||
| σprop,DHA (CV%) | 53 | 14 | 51 | 44 to 59 | ||||
| Lumefantrine | ||||||||
| CL (liter/h) | 2.8 | 12 | 2.8 | 2.2 to 3.6 | ||||
| Vc (liter) | 134 | 14 | 134 | 101 to 174 | ||||
| F1 | Fixed at 1 | 65 | 50 | 61 | 43 to 77 | |||
| θPregF1 | −0.33 | 37 | −0.31 | −0.52 to −0.05 | ||||
| θdiarrF1 | −0.84 | 15 | −0.78 | −0.95 to −0.44 | ||||
| Ka (h−1) | Fixed to 0.54 | |||||||
| VM (liter) | Fixed to Vc | |||||||
| F0 (mg) | 2.7 | 18 | 87 | 46 | 2.95 | 1.9 to 4.4 | 116 | 70 to 164 |
| K23 (h−1) | 1.6 × 10⁻⁴ | 46 | 54 | 1.6 × 10⁻⁴ | (1.2 to 2.0) × 10−4 | 44 | 31 to 57 | |
| θPregK23 | 0.80 | 32 | 0.80 | 0.4 to 1.3 | ||||
| CLmet (liter/h) | 2.6 | 15 | 2.6 | 1.9 to 3.5 | ||||
| σprop,LF (CV%) | 51 | 32c | 51 | 45 to 56 | ||||
| σprop,DLF (CV%) | 39 | 40c | 38 | 32 to 44 | ||||
| Correlation LF/DLF | 68 | 18 | 67 | 63 to 69 | ||||
| σadd,DLF (μmol/liter) | 4.4 × 10⁻³ | 17c | 4.9 × 10⁻³ | (3.8 to 6.1) × 10−3 | ||||
Abbreviations: CL, clearance; Vc, central volume of distribution; logit F1, F1 expressed as a logit function; ka, first-order absorption rate constant; VM, volume of distribution of the metabolite; F0, residual amount from the previous treatment; K23, metabolism rate constant; CLmet, metabolite clearance; σprop, exponential residual error for the drug; σadd, additive residual error for the drug; CV, coefficient of variation; θX PAR, effect of the X covariate (pregnancy [Preg] or diarrhea [diarr]) on the parameter PAR expressed as 1 − θXPARX.
Standard error (SE) of the estimate θi defined as SE estimate/estimate, expressed as a percentage.
IIv, interindividual variability.
Standard error (SE) of the coefficient of variation or the additive component of the residual error defined as the square root of the SE estimate/estimate ratio, expressed as a percentage.
CI95%, 95% confidence interval.
FIG 2.

(A) Observed artemether (AM) (left panel) and dihydroartemisinin (DHA) (right panel) concentrations in plasma. Filled and empty circles represent pregnant and nonpregnant women, respectively. The solid line represents the average predicted concentrations, and the dashed lines show the 95th prediction interval. (B) Observed plasma lumefantrine (LF) (top panels) and debutyl-lumefantrine (DLF) (bottom panels) concentrations in pregnant and nonpregnant women. Triangles show residual plasma LF and DLF concentrations found prior to treatment initiation. The solid lines represent the mean population prediction, and the dashed lines show PI95%.
Lumefantrine.
A one-compartment model with first-order absorption and elimination was retained to depict LF data. A two-compartment model did not improve the model fit (ΔOFV = −0.1 and P = 0.75). The average dose from previous treatment (F0) was estimated to be 3.2 mg with a large interindividual variability (ΔOFV = −40 and P = 2.5 × 10⁻¹⁰). In addition to CL, interpatient variability on Vc (ΔOFV = −23 and P = 1.6 × 10⁻⁶) and a correlation between CL and Vc significantly improved the fit (ΔOFV = −117 and P = 2.9 × 10⁻²⁷). The assignment of interpatient variability on LF bioavailability F1 (fixed at 1) accounting for the correlation between CL and Vc and their variability resulted in additional improvement of the model fit (ΔOFV = −9.5 and P = 8.7 × 10⁻³). Metabolite concentrations were included in the model using a supplementary compartment with linear metabolism from the LF central compartment. The addition of interindividual variability on K23 significantly improved the description of the data (ΔOFV = −41 and P = 1.5 × 10⁻¹⁰), while no enhancement was observed when assigning variability on CLmet (ΔOFV = −0.02 and P = 0.89). Residual intrapatient variability was best described using a proportional and mixed-error model for LF and DLF, respectively. The model was improved further by including a correlation between drug and metabolite concentrations (ΔOFV = −85 and P = 3.0 × 10⁻²⁰). Structural model shrinkages for the inter- and intraindividual variability were all estimated to be lower than 15%.
In univariable analyses, pregnancy and diarrhea were identified as significant covariates for both F1 (ΔOFV = −5.1 and P = 0.024 and ΔOFV = −15 and P = 1.1 × 10⁻⁴, respectively) and K23 (ΔOFV = −13 and P = 3.1 × 10⁻⁴ and ΔOFV = −4 and P = 0.045, respectively). None of the remaining covariates influenced LF and DLF pharmacokinetics (ΔOFV ≥ −1.4 and P ≥ 0.24). Multivariable combination of the significant covariates showed an additive influence of pregnancy and diarrhea on F1 and pregnancy on K23 (ΔOFV = −33 and P = 3.2 × 10⁻⁷ with respect to the model without covariates). Our results show that the relative bioavailability is 34% lower and the metabolism rate is 78% higher in pregnant women than in nonpregnant women. A decrease of 83% in F1 was observed in women with diarrhea compared to those who had no diarrhea. Table 3 contains the final model parameter estimates together with their bootstrap evaluations. The model was considered reliable, since the parameter estimates obtained lay within the bootstrap CI95%. Figure 2B shows the concentration-time plots of LF and DLF for pregnant and nonpregnant women included in the analysis with average population predictions and 95% intervals.
Concentration-time simulation of lumefantrine.
The day 7 predicted median concentrations of LF after administration of a 6-dose regimen over 3 days were 908 (PI95%, 217 to 3,256) ng/ml for pregnant women and 1,382 (PI95%, 386 to 5,135) ng/ml for nonpregnant women (P = 0.10). While considering the large interpatient variability in the kinetics of LF, 3% of the pregnant women would have day 7 concentrations below the cutoff value of 175 ng/ml, 9% below 280 ng/ml, and 31% below 600 ng/ml. For nonpregnant women, 1% would exhibit day 7 concentrations below the cutoff value of 170 ng/ml, 2% below 280 ng/ml, and 15% below 600 ng/ml. Prolonging the time of drug administration over 5 days among pregnant women would provide median concentrations of 1,374 (PI95%, 367 to 5,536) ng/ml, with 0.1%, 2%, and 16% of patients with concentrations below the cutoff value of 175 ng/ml, 280 ng/ml, and 600 ng/ml, respectively (Fig. 3).
FIG 3.
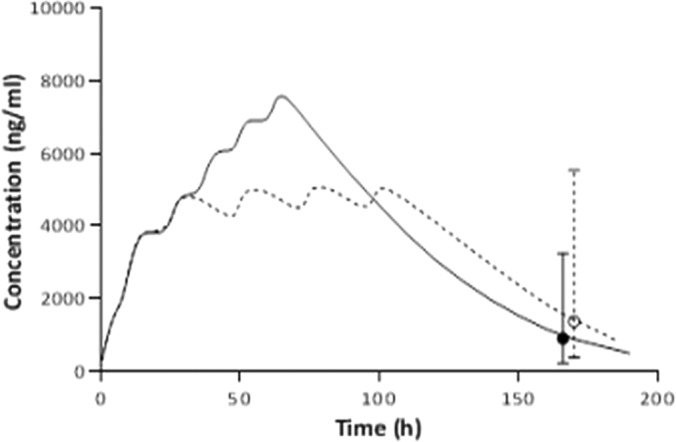
Predicted median concentration of lumefantrine after administration of six 480-mg doses over 3 (continuous line) and 5 days (dotted line) in pregnant women. The median predicted concentrations on day 7 (168 h) (circles) with their PI95% are shown for the two dosage regimens.
Pharmacodynamics.
There were a total of seven therapeutic failures in the study, six (18.2%) pregnant women and one (4.5%) nonpregnant woman (OR = 4.04; P = 0.22). Among pregnant women, one developed early treatment failure (ETF) on day 1. She presented with signs and symptoms suggestive of severe malaria, was admitted, and kept on full doses of intravenous quinine. One pregnant woman had late clinical failure (LCF), presented with fever (body temperature of 38.7°C) on day 20, and was confirmed to have parasitemia of 10,750 counts/μl (blood slide). The remaining four pregnant women had late parasitological failure (LPF), one on day 28 and three on day 42. One nonpregnant woman had LPF on day 28. Hence, the overall PCR uncorrected efficacy of AL in the study was 87%, 82% in pregnant women (6/33) and 95% in nonpregnant women (1/22). PCR investigation confirmed recrudescent infection in two women, one with ETF and the other with LCF, both pregnant; the remaining five women (71%) had new infections.
Analysis of day 7 LF concentration was done irrespective of the nature of the failure (new infection or recrudescence). The mean day 7 plasma LF concentrations were 971 (726 to 1,216) ng/ml in pregnant women and 1,261 (999 to 1,522) ng/ml in nonpregnant women (P = 0.109) (Fig. 4A). Day 7 LF concentration was significantly lower among women with therapeutic failure than those with adequate clinical and parasitological response (ACPR). The mean LF concentration among women with ACPR was 1,154 (967 to 1,341) ng/ml, whereas for the women with LCF and LPF, it was 507 (95 to 919) ng/ml (P = 0.029) (Fig. 4B). Twenty percent of study participants had day 7 LF concentrations below 600 ng/ml. Only two patients (33%) out of six patients who developed LCF and LPF had day 7 LF concentrations below 600 ng/ml, and all were pregnant. Potential predictors of treatment failure in addition to day 7 LF concentration were pregnancy status, gestational age, baseline parasite count, residual antimalarial, and BMI, and none was statistically significant.
FIG 4.
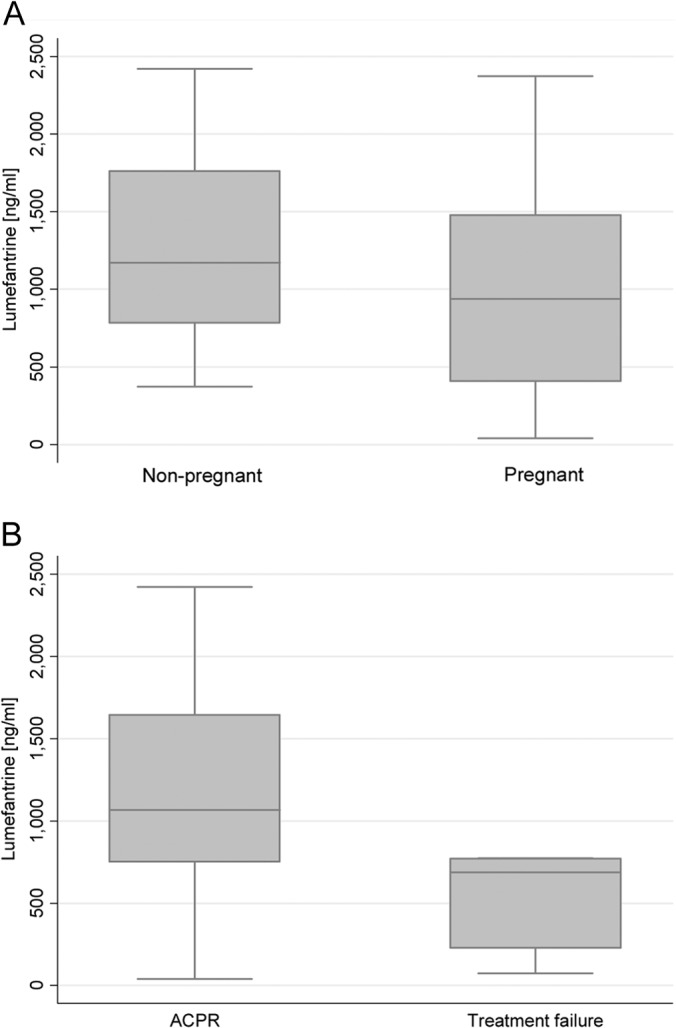
(A) Day 7 concentration of lumefantrine in plasma in pregnant (n = 32) and nonpregnant (n = 22) women. (B) Day 7 plasma lumefantrine concentration in women with ACPR (n = 48) and women with treatment failure (n = 6). The day 7 lumefantrine concentration could not be assessed in one woman with treatment failure, since a rescue treatment with quinine was given on day 1 because of early treatment failure.
DISCUSSION
This study describes the pharmacokinetic properties of AM and LF and their active metabolites, DHA and DLF, in pregnant and nonpregnant women with malaria. The roles of different covariates that could influence AL bioavailability, distribution, and clearance in the two groups were carefully analyzed. This study differs from previous reports of population pharmacokinetics of AM and LF during pregnancy (16, 18, 19) by having a comparative group of nonpregnant women with malaria from the same population with relatively similar characteristics.
Prior treatment.
Detectable residual antimalarial levels in recruited participants were unexpectedly high. This might be explained by uncontrolled prescription of AL, a first-line malaria treatment, which is highly available and easily accessible from both private and public facilities (42, 43). The prevalence of residual antimalarial among participants was higher than what was found 5 years ago from in vivo studies in Ifakara (Tanzania) and Praeh Vihear (Cambodia), which reported 74.3% and 50%, respectively (28, 29). Such high prevalence of residual antimalarial levels in this population, particularly LF, is alarming, because it can promote emergence and spread of drug-resistant parasites. Also, the high residual prevalence of LF, irrespective of pregnancy trimester suggests a considerable exposure to AL in the first trimester. There is an urgent need to monitor closely the implementation of standard malaria treatment guidelines and discourage self-treatment by not acquiring antimalarial from drug vendors without medical attention and being screened for the presence of malaria parasitemia. Significant levels of sulfadoxine detected in pregnant women were probably the result of SP received from the RCH clinic for Intermittent Preventive Treatment (IPTp).
Pharmacokinetics.
LF pharmacokinetics is known to exhibit a multicompartment disposition. The short sampling duration in the present study, however, prevented an appropriate characterization of the complete disposition of the drug. A simple one-compartment model was thus employed to describe LF concentration-time profile. The important study finding was the lower plasma LF concentration in pregnant patients compared to nonpregnant ones. This is similar to what has been observed in a Thailand study in which the concentration of LF was approximately half that of nonpregnant patients from historical data in the same population (16). The reason for the low LF concentration may be due to physiological changes related to pregnancy which accounts for reduced absorption, expanded volume of distribution, and elevated drug metabolism and clearance rate (6). The observed increase in LF metabolism rate in pregnant women is explained by hormonal changes in pregnancy which increase catalytic activity of hepatic enzymes such as CYP3A4, an important enzyme for LF metabolism (11). The design of the study did not allow displaying the effect of reduced absorption on LF bioavailability.
An altered bowel condition, such as having diarrhea, during malaria treatment has a significant effect on drug absorption and consequently lowers drug bioavailability. Increase in gastrointestinal motility due to diarrhea reduces intestinal transit time of a drug, and this time is important to maximize drug absorption (44). The latter explains why LF concentration, a high lipophilic compound, was 83% lower in women with diarrhea than in women without diarrhea. It is therefore important to assess for the presence of diarrhea in patients and correct dosage regimens accordingly.
It is important to study the concentrations of a slowly eliminated partner antimalarial drug such as LF so as to determine the minimum parasiticidal concentration (MPC) and MIC of malaria parasite (20). The observed day 7 median concentration of LF was lower in pregnant women than in nonpregnant women. However, the concentration in pregnant women was 2-fold higher than what had been observed in pregnant Thai patients (19). It is also higher than the concentrations previously reported in nonpregnant adults and pediatric patients in Tanzania Ifakara), Thailand, Cambodia, and the Lao People's Democratic Republic (22, 24, 45, 46). Higher day 7 LF levels in the present study may be due to the administration of a standard recommended adult dose of AL with food (5) to all patients regardless of the patient's body weight.
The observed higher AM clearance in pregnant women as opposed to nonpregnant women, although not statistically significant, could explain the differences in the therapeutic outcome. Little has been done on AM bioassay in relation to its specific role on therapeutic efficacy in pregnancy as opposed to LF. AM can better explain ETF, therefore, further studies with detailed assessment of AM pharmacokinetics should be done, despite its shorter half-life.
The simulations under the standard schedule of 6 doses of AL over 3 days show that a nonnegligible number of pregnant women would have LF concentrations below various proposed therapeutic threshold targets on day 7. Splitting the same recommended total dose over a 5-day regimen would greatly improve the probability of exhibiting therapeutic drug concentrations. The latter has already been shown in other pharmacokinetics studies (22, 23, 47), but the benefit might be jeopardized by poor adherence to treatment in the prolonged regimen. Hence, a formal assessment of feasibility should be performed.
Pharmacodynamics.
The observed cure rate and parasite clearance in pregnant women were lower than those of nonpregnant women despite having the same median baseline parasitemia. The observed lower LF concentration on day 7 in the patients with therapeutic failure could be one of the reasons explaining this difference. In order to improve therapeutic efficacy, it is therefore important to consider increasing the dose or modifying the treatment regimen to allow higher day 7 LF concentrations. Day 7 LF concentration above 600 ng/dl was associated with 100% efficacy in pregnant patients in Thailand (40). The latter was not observed in our study; indeed, 3 out of the 5 (60%) pregnant women with LCF or LTF had day 7 LF concentration above 600 ng/ml. This observation suggests that the proposed 600-ng/dl cutoff value better predicts parasite clearance of ongoing infection, rather than occurrence of new infection in the follow-up period. A 600-ng/dl LF concentration at day 7 is not high enough to ensure posttreatment prophylaxis effect up to day 42. Indeed, reinfections were not all prevented with a day 7 LF concentration of 600 ng/ml. Partner drugs with longer half-lives might offer better protection (20).
Baseline parasitemia was not an important factor determining the therapeutic response in study participants. Indeed, the mean baseline parasite count in patients with ACPR was 2-fold higher than in the patients with therapeutic failure. This is contrary to what has been reported in previous studies involving pregnant and nonpregnant patients in which patients with higher baseline parasitemia were more likely to fail treatment (40, 47). However, baseline peripheral parasitemia in pregnant women usually does not tell much about the actual picture of parasite level that a pregnant woman might have because of parasite sequestration in the placenta (48).
The therapeutic failure rate in pregnant women in our study was much lower than that observed in Thailand in recent AL pharmacodynamics studies where the therapeutic failure in pregnant patients was more than 30% (19, 40). We have reason to believe that AL is more efficacious in Africa than in Southeast Asia where resistance to other antimalarial drugs, such as quinine, mefloquine, and artesunate, has increased (14, 49).
Conclusion.
The current AL treatment regimen in pregnancy is challenged by having low posttreatment prophylactic effect. Pregnancy is an important factor associated with low plasma LF concentration, probably due to reduced drug absorption, elevated drug metabolism, and rapid clearance rate. It is therefore important to evaluate new treatment regimens of AL in this vulnerable group that would target higher day 7 LF concentration levels.
ACKNOWLEDGMENTS
We sincerely thank the patients for their cooperation and all staff involved in the study. Special thanks are given to Sigilbert Mrema, Athumani Mzuyu, Bakari Kissa, Fadhili Mwakitete, and Sajidu Ismail of the Rufiji Health Demographic Surveillance System (HDSS) and to Jackson Thomas and Happy Mkali of the Ifakara Health Institute (IHI) Bagamoyo Clinical Laboratory.
This work was supported by the Ifakara Health Institute and European and Developing Countries Trial Partnership (EDCTP) through Malaria in Pregnancy Preventive Alternative Drugs (MiPPAD) project.
We declare that we have no conflicts of interest.
Footnotes
Published ahead of print 27 May 2014
REFERENCES
- 1.Desai M, ter Kuile FO, Nosten F, McGready R, Asamoa K, Brabin B, Newman RD. 2007. Epidemiology and burden of malaria in pregnancy. Lancet Infect. Dis. 7:93–104. 10.1016/S1473-3099(07)70021-X [DOI] [PubMed] [Google Scholar]
- 2.Rogerson SJ, Mwapasa V, Meshnick SR. 2007. Malaria in pregnancy: linking immunity and pathogenesis to prevention. Am. J. Trop. Med. Hyg. 77(Suppl 6):14–22 [PubMed] [Google Scholar]
- 3.Steketee RW, Nahlen BL, Parise ME, Menendez C. 2001. The burden of malaria in pregnancy in malaria-endemic areas. Am. J. Trop. Med. Hyg. 64(Suppl 1-2):28–35 [DOI] [PubMed] [Google Scholar]
- 4.Piola P, Nabasumba C, Turyakira E, Dhorda M, Lindegardh N, Nyehangane D, Snounou G, Ashley EA, McGready R, Nosten F, Guerin PJ. 2010. Efficacy and safety of artemether-lumefantrine compared with quinine in pregnant women with uncomplicated Plasmodium falciparum malaria: an open-label, randomised, non-inferiority trial. Lancet Infect. Dis. 10:762–769. 10.1016/S1473-3099(10)70202-4 [DOI] [PubMed] [Google Scholar]
- 5.World Health Organization. 2010. Guidelines for the treatment of malaria, 2nd ed. World Health Organization, Geneva, Switzerland [Google Scholar]
- 6.Pang KS. 2003. Modeling of intestinal drug absorption: roles of transporters and metabolic enzymes (for the Gillette Review Series). Drug Metab. Dispos. 31:1507–1519. 10.1124/dmd.31.12.1507 [DOI] [PubMed] [Google Scholar]
- 7.Anderson GD. 2005. Pregnancy-induced changes in pharmacokinetics: a mechanistic-based approach. Clin. Pharmacokinet. 44:989–1008. 10.2165/00003088-200544100-00001 [DOI] [PubMed] [Google Scholar]
- 8.Pavek P, Ceckova M, Staud F. 2009. Variation of drug kinetics in pregnancy. Curr. Drug Metab. 10:520–529. 10.2174/138920009788897993 [DOI] [PubMed] [Google Scholar]
- 9.Ward SA, Sevene EJ, Hastings IM, Nosten F, McGready R. 2007. Antimalarial drugs and pregnancy: safety, pharmacokinetics, and pharmacovigilance. Lancet Infect. Dis. 7:136–144. 10.1016/S1473-3099(07)70025-7 [DOI] [PubMed] [Google Scholar]
- 10.Isoherranen N, Thummel KE. 2013. Drug metabolism and transport during pregnancy: how does drug disposition change during pregnancy and what are the mechanisms that cause such changes? Drug Metab. Dispos. 41:256–262. 10.1124/dmd.112.050245 [DOI] [PMC free article] [PubMed] [Google Scholar]
- 11.Jeong H. 2010. Altered drug metabolism during pregnancy: hormonal regulation of drug-metabolizing enzymes. Expert Opin. Drug Metab. Toxicol. 6:689–699. 10.1517/17425251003677755 [DOI] [PMC free article] [PubMed] [Google Scholar]
- 12.Piedade R, Gil JP. 2011. The pharmacogenetics of antimalaria artemisinin combination therapy. Expert Opin. Drug Metab. Toxicol. 7:1185–1200. 10.1517/17425255.2011.608660 [DOI] [PubMed] [Google Scholar]
- 13.Staehli Hodel EM, Csajka C, Ariey F, Guidi M, Kabanywanyi AM, Duong S, Decosterd LA, Olliaro P, Beck HP, Genton B. 2013. Effect of single nucleotide polymorphisms in cytochrome P450 isoenzyme and N-acetyltransferase 2 genes on the metabolism of artemisinin-based combination therapies in malaria patients from Cambodia and Tanzania. Antimicrob. Agents Chemother. 57:950–958. 10.1128/AAC.01700-12 [DOI] [PMC free article] [PubMed] [Google Scholar]
- 14.McGready R, Ashley EA, Moo E, Cho T, Barends M, Hutagalung R, Looareesuwan S, White NJ, Nosten F. 2005. A randomized comparison of artesunate-atovaquone-proguanil versus quinine in treatment for uncomplicated falciparum malaria during pregnancy. J. Infect. Dis. 192:846–853. 10.1086/432551 [DOI] [PubMed] [Google Scholar]
- 15.McGready R, Stepniewska K, Edstein MD, Cho T, Gilveray G, Looareesuwan S, White NJ, Nosten F. 2003. The pharmacokinetics of atovaquone and proguanil in pregnant women with acute falciparum malaria. Eur. J. Clin. Pharmacol. 59:545–552. 10.1007/s00228-003-0652-9 [DOI] [PubMed] [Google Scholar]
- 16.McGready R, Stepniewska K, Lindegardh N, Ashley EA, La Y, Singhasivanon P, White NJ, Nosten F. 2006. The pharmacokinetics of artemether and lumefantrine in pregnant women with uncomplicated falciparum malaria. Eur. J. Clin. Pharmacol. 62:1021–1031. 10.1007/s00228-006-0199-7 [DOI] [PubMed] [Google Scholar]
- 17.Onyamboko MA, Meshnick SR, Fleckenstein L, Koch MA, Atibu J, Lokomba V, Douoguih M, Hemingway-Foday J, Wesche D, Ryder RW, Bose C, Wright LL, Tshefu AK, Capparelli EV. 2011. Pharmacokinetics and pharmacodynamics of artesunate and dihydroartemisinin following oral treatment in pregnant women with asymptomatic Plasmodium falciparum infections in Kinshasa DRC. Malaria J. 10:49. 10.1186/1475-2875-10-49 [DOI] [PMC free article] [PubMed] [Google Scholar]
- 18.Tarning J, Kloprogge F, Piola P, Dhorda M, Muwanga S, Turyakira E, Nuengchamnong N, Nosten F, Day NP, White NJ, Guerin PJ, Lindegardh N. 2012. Population pharmacokinetics of artemether and dihydroartemisinin in pregnant women with uncomplicated Plasmodium falciparum malaria in Uganda. Malaria J. 11:293. 10.1186/1475-2875-11-293 [DOI] [PMC free article] [PubMed] [Google Scholar]
- 19.Tarning J, McGready R, Lindegardh N, Ashley EA, Pimanpanarak M, Kamanikom B, Annerberg A, Day NP, Stepniewska K, Singhasivanon P, White NJ, Nosten F. 2009. Population pharmacokinetics of lumefantrine in pregnant women treated with artemether-lumefantrine for uncomplicated Plasmodium falciparum malaria. Antimicrob. Agents Chemother. 53:3837–3846. 10.1128/AAC.00195-09 [DOI] [PMC free article] [PubMed] [Google Scholar]
- 20.White NJ, Stepniewska K, Barnes K, Price RN, Simpson J. 2008. Simplified antimalarial therapeutic monitoring: using the day-7 drug level? Trends Parasitol. 24:159–163. 10.1016/j.pt.2008.01.006 [DOI] [PubMed] [Google Scholar]
- 21.World Health Organization. 2011. Methods and techniques for assessing exposure to antimalarial drugs in clinical field studies. World Health Organization, Geneva, Switzerland [Google Scholar]
- 22.Staehli Hodel EM, Guidi M, Zanolari B, Mercier T, Duong S, Kabanywanyi AM, Ariey F, Buclin T, Beck HP, Decosterd LA, Olliaro P, Genton B, Csajka C. 2013. Population pharmacokinetics of mefloquine, piperaquine and artemether-lumefantrine in Cambodian and Tanzanian malaria patients. Malaria J. 12:235. 10.1186/1475-2875-12-235 [DOI] [PMC free article] [PubMed] [Google Scholar]
- 23.Ezzet F, van Vugt M, Nosten F, Looareesuwan S, White NJ. 2000. Pharmacokinetics and pharmacodynamics of lumefantrine (benflumetol) in acute falciparum malaria. Antimicrob. Agents Chemother. 44:697–704. 10.1128/AAC.44.3.697-704.2000 [DOI] [PMC free article] [PubMed] [Google Scholar]
- 24.Price RN, Uhlemann AC, van Vugt M, Brockman A, Hutagalung R, Nair S, Nash D, Singhasivanon P, Anderson TJ, Krishna S, White NJ, Nosten F. 2006. Molecular and pharmacological determinants of the therapeutic response to artemether-lumefantrine in multidrug-resistant Plasmodium falciparum malaria. Clin. Infect. Dis. 42:1570–1577. 10.1086/503423 [DOI] [PMC free article] [PubMed] [Google Scholar]
- 25.Ashley EA, Stepniewska K, Lindegardh N, McGready R, Annerberg A, Hutagalung R, Singtoroj T, Hla G, Brockman A, Proux S, Wilahphaingern J, Singhasivanon P, White NJ, Nosten F. 2007. Pharmacokinetic study of artemether-lumefantrine given once daily for the treatment of uncomplicated multidrug-resistant falciparum malaria. Trop. Med. Int. Health 12:201–208. 10.1111/j.1365-3156.2006.01785.x [DOI] [PubMed] [Google Scholar]
- 26.Khatib RA, Skarbinski J, Njau JD, Goodman CA, Elling BF, Kahigwa E, Roberts JM, MacArthur JR, Gutman JR, Kabanywanyi AM, Smith EE, Somi MF, Lyimo T, Mwita A, Genton B, Tanner M, Mills A, Mshinda H, Bloland PB, Abdulla SM, Kachur SP. 2012. Routine delivery of artemisinin-based combination treatment at fixed health facilities reduces malaria prevalence in Tanzania: an observational study. Malaria J. 11:140. 10.1186/1475-2875-11-140 [DOI] [PMC free article] [PubMed] [Google Scholar]
- 27.Ashley EA, Stepniewska K, Lindegardh N, Annerberg A, Kham A, Brockman A, Singhasivanon P, White NJ, Nosten F. 2007. How much fat is necessary to optimize lumefantrine oral bioavailability? Trop. Med. Int. Health 12:195–200. 10.1111/j.1365-3156.2006.01784.x [DOI] [PubMed] [Google Scholar]
- 28.Hodel EM, Genton B, Zanolari B, Mercier T, Duong S, Beck HP, Olliaro P, Decosterd LA, Ariey F. 2010. Residual antimalarial concentrations before treatment in patients with malaria from Cambodia: indication of drug pressure. J. Infect. Dis. 202:1088–1094. 10.1086/655779 [DOI] [PubMed] [Google Scholar]
- 29.Hodel EM, Kabanywanyi AM, Malila A, Zanolari B, Mercier T, Beck HP, Buclin T, Olliaro P, Decosterd LA, Genton B. 2009. Residual antimalarials in malaria patients from Tanzania–implications on drug efficacy assessment and spread of parasite resistance. PLoS One 4:e8184. 10.1371/journal.pone.0008184 [DOI] [PMC free article] [PubMed] [Google Scholar]
- 30.Plowe CV, Djimde A, Bouare M, Doumbo O, Wellems TE. 1995. Pyrimethamine and proguanil resistance-conferring mutations in Plasmodium falciparum dihydrofolate reductase: polymerase chain reaction methods for surveillance in Africa. Am. J. Trop. Med. Hyg. 52:565–568 [DOI] [PubMed] [Google Scholar]
- 31.Felger I, Irion A, Steiger S, Beck HP. 1999. Genotypes of merozoite surface protein 2 of Plasmodium falciparum in Tanzania. Trans. R. Soc. Trop. Med. Hyg. 93(Suppl 1):S3–S9 [DOI] [PubMed] [Google Scholar]
- 32.Hodel EM, Zanolari B, Mercier T, Biollaz J, Keiser J, Olliaro P, Genton B, Decosterd LA. 2009. A single LC-tandem mass spectrometry method for the simultaneous determination of 14 antimalarial drugs and their metabolites in human plasma. J. Chromatogr. B Analyt. Technol. Biomed. Life Sci. 877:867–886. 10.1016/j.jchromb.2009.02.006 [DOI] [PubMed] [Google Scholar]
- 33.World Health Organization. 2009. Methods for surveillance of antimalarial drug efficacy. World Health Organization, Geneva, Switzerland [Google Scholar]
- 34.Tanzania Ministry of Health and Social Welfare. 2006. National guideline for malaria diagnosis and treatment 2005. Malaria control series 11. National Malaria Control Programme. Tanzania Ministry of Health and Social Welfare, Dar es Salaam, Tanzania [Google Scholar]
- 35.Beal SL, Sheiner LB, Boeckmann A, Bauer RJ. 2009. NONMEM users guides (1989–2009). Icon Development Solutions, Ellicott City, MD [Google Scholar]
- 36.Lindbom L, Pihlgren P, Jonsson EN. 2005. PsN-Toolkit–a collection of computer intensive statistical methods for non-linear mixed effect modeling using NONMEM. Comput. Methods Programs Biomed. 79:241–257. 10.1016/j.cmpb.2005.04.005 [DOI] [PubMed] [Google Scholar]
- 37.Novartis Pharmaceuticals Corporation. 2009. What are the ingredients of Coartem? Novartis Pharmaceuticals Corporation, East Hanover, NJ [Google Scholar]
- 38.Beal SL. 2001. Ways to fit a PK model with some data below the quantification limit. J. Pharmacokinet. Pharmacodyn. 28:481–504. 10.1023/A:1012299115260 [DOI] [PubMed] [Google Scholar]
- 39.Ahn JE, Karlsson MO, Dunne A, Ludden TM. 2008. Likelihood based approaches to handling data below the quantification limit using NONMEM VI. J. Pharmacokinet. Pharmacodyn. 35:401–421. 10.1007/s10928-008-9094-4 [DOI] [PubMed] [Google Scholar]
- 40.McGready R, Tan SO, Ashley EA, Pimanpanarak M, Viladpai-Nguen J, Phaiphun L, Wustefeld K, Barends M, Laochan N, Keereecharoen L, Lindegardh N, Singhasivanon P, White NJ, Nosten F. 2008. A randomised controlled trial of artemether-lumefantrine versus artesunate for uncomplicated Plasmodium falciparum treatment in pregnancy. PLoS Med. 5:e253. 10.1371/journal.pmed.0050253 [DOI] [PMC free article] [PubMed] [Google Scholar]
- 41.Rahman MM, Dondorp AM, Day NP, Lindegardh N, Imwong M, Faiz MA, Bangali AM, Kamal AT, Karim J, Kaewkungwal J, Singhasivanon P. 2008. Adherence and efficacy of supervised versus non-supervised treatment with artemether/lumefantrine for the treatment of uncomplicated Plasmodium falciparum malaria in Bangladesh: a randomised controlled trial. Trans. R. Soc. Trop. Med. Hyg. 102:861–867. 10.1016/j.trstmh.2008.05.022 [DOI] [PubMed] [Google Scholar]
- 42.Mbwasi R, Mlaki W. 2008. Increasing access to medicines in Tanzania. Lancet 372:205–206. 10.1016/S0140-6736(08)61070-3 [DOI] [PubMed] [Google Scholar]
- 43.Rutta E, Kibassa B, McKinnon B, Liana J, Mbwasi R, Mlaki W, Embrey M, Gabra M, Shekalaghe E, Kimatta S, Sillo H. 2011. Increasing access to subsidized artemisinin-based combination therapy through accredited drug dispensing outlets in Tanzania. Health Research Policy Syst. 9:22. 10.1186/1478-4505-9-22 [DOI] [PMC free article] [PubMed] [Google Scholar]
- 44.Jamei M, Turner D, Yang J, Neuhoff S, Polak S, Rostami-Hodjegan A, Tucker G. 2009. Population-based mechanistic prediction of oral drug absorption. AAPS J. 11:225–237. 10.1208/s12248-009-9099-y [DOI] [PMC free article] [PubMed] [Google Scholar]
- 45.Denis MB, Tsuyuoka R, Lim P, Lindegardh N, Yi P, Top SN, Socheat D, Fandeur T, Annerberg A, Christophel EM, Ringwald P. 2006. Efficacy of artemether-lumefantrine for the treatment of uncomplicated falciparum malaria in northwest Cambodia. Trop. Med. Int. Health 11:1800–1807. 10.1111/j.1365-3156.2006.01739.x [DOI] [PubMed] [Google Scholar]
- 46.Stohrer JM, Dittrich S, Thongpaseuth V, Vanisaveth V, Phetsouvanh R, Phompida S, Monti F, Christophel EM, Lindegardh N, Annerberg A, Jelinek T. 2004. Therapeutic efficacy of artemether-lumefantrine and artesunate-mefloquine for treatment of uncomplicated Plasmodium falciparum malaria in Luang Namtha Province, Lao People's Democratic Republic. Trop. Med. Int. Health 9:1175–1183. 10.1111/j.1365-3156.2004.01320.x [DOI] [PubMed] [Google Scholar]
- 47.White NJ, van Vugt M, Ezzet F. 1999. Clinical pharmacokinetics and pharmacodynamics and pharmacodynamics of artemether-lumefantrine. Clin. Pharmacokinet. 37:105–125. 10.2165/00003088-199937020-00002 [DOI] [PubMed] [Google Scholar]
- 48.Takem EN, D'Alessandro U. 2013. Malaria in pregnancy. Mediterr. J. Hematol. Infect. Dis. 5:e2013010. [DOI] [PMC free article] [PubMed] [Google Scholar]
- 49.Na-Bangchang K, Ruengweerayut R, Mahamad P, Ruengweerayut K, Chaijaroenkul W. 2010. Declining in efficacy of a three-day combination regimen of mefloquine-artesunate in a multi-drug resistance area along the Thai-Myanmar border. Malaria J. 9:273. 10.1186/1475-2875-9-273 [DOI] [PMC free article] [PubMed] [Google Scholar]