

Abstract
The maintenance of a plasmid in the absence of selection for plasmid-borne genes is not guaranteed. However, plasmid persistence can evolve under selective conditions. Studying the molecular mechanisms behind the evolution of plasmid persistence is key to understanding how plasmids are maintained under nonselective conditions. Given the current crisis of rapid antibiotic resistance spread by multidrug resistance plasmids, this insight is of high medical relevance. The conventional method for monitoring plasmid persistence (i.e., the fraction of plasmid-containing cells in a population over time) is based on cultivation and involves differentiating colonies of plasmid-containing and plasmid-free cells on agar plates. However, this technique is time-consuming and does not easily lend itself to high-throughput applications. Here, we present flow cytometry (FCM) and real-time quantitative PCR (qPCR) as alternative tools for monitoring plasmid persistence. For this, we measured the persistence of a model plasmid, pB10::gfp, in three Pseudomonas hosts and in known mixtures of plasmid-containing and -free cells. We also compared three performance criteria: dynamic range, resolution, and variance. Although not without exceptions, both techniques generated estimates of overall plasmid loss rates that were rather similar to those generated by the conventional plate count (PC) method. They also were able to resolve differences in loss rates between artificial plasmid persistence assays. Finally, we briefly discuss the advantages and disadvantages for each technique and conclude that, overall, both FCM and real-time qPCR are suitable alternatives to cultivation-based methods for routine measurement of plasmid persistence, thereby opening avenues for high-throughput analyses.
INTRODUCTION
Many bacterial plasmids carry genetic information required for maintaining themselves in their prokaryotic host populations (1). The ability of a plasmid to persist in a growing bacterial population in the absence of selection typically is referred to as high plasmid stability; here, it is referred to as plasmid persistence. In addition to the replication initiator and one or more origins of replication, functions to ensure plasmid persistence can include multimer resolution, partitioning, postsegregational killing (toxin-antitoxin), and horizontal transfer systems (1, 2). In the absence of selection for the plasmid, plasmid persistence also is negatively affected by its cost to host fitness. Thus, plasmid persistence is a first indicator of how well a plasmid is adapted to that host. This can be useful to understand the natural long-term host range of a plasmid, determine its adaptation to novel hosts following experimental evolution in the laboratory, or identify useful plasmid vectors for biotechnological processes (3–7). From a human health perspective, understanding the evolution of plasmid persistence is critical if we are to manage the current crisis of rapid plasmid-mediated spread of antibiotic resistance (8, 9). Such studies are becoming increasingly demanding as we address more complex plasmid persistence questions involving multiple plasmids (10), hosts (4), and whole microbial communities (11). Therefore, efficient techniques for routine monitoring and quantification of plasmid persistence are much needed to facilitate progress in this field.
The ability of a plasmid to persist in a host typically is monitored (under laboratory conditions) by measuring the fraction of plasmid-containing cells within a bacterial population over time in serial batch cultures in the absence of positive selection for the plasmid. Conventionally this is achieved through cultivation-based methods in which diluted bacterial suspensions are spread on media with and without selection for plasmid-bearing cells or by replicating bacterial colonies (e.g., 50 or 100) from nonselective plates onto plasmid-selective and nonselective agar plates (4, 5, 12–17). However, this is labor-intensive, requires colony growth on agar, and has a built-in lag period of one or more days prior to knowing the results.
In recent years, researchers have successfully used alternative technologies, such as microscopy (cultivation dependent), FCM (flow cytometry), and real-time quantitative PCR (qPCR; both cultivation independent) to directly measure plasmid loss or to monitor the persistence of a plasmid in a bacterial population (11, 18–23). The microscopy-based techniques rely on monitoring the growth of single cells into microcolonies while directly observing the frequency with which plasmid-free cells are generated (18, 19). Although very advantageous for accurately measuring plasmid loss rates without the confounding effects of cost, this approach as currently described is not easily adapted to measuring the persistence of one or more plasmids in multiple hosts or in complex microbial communities. In contrast, Bahl et al. (20, 21) and Bonot and Merlin (11) demonstrated the versatility of FCM and real-time qPCR for this purpose by using these technologies to monitor plasmid persistence in bacteria within the gastrointestinal tract of rats and in sediment microcosms, respectively. They used the presence/absence of green fluorescence encoded by the gfp gene to distinguish plasmid-containing from plasmid-free cells by FCM or plasmid- and chromosome-specific real-time qPCR primers and probes to monitor the plasmid/chromosomal DNA ratio in microbial communities as a proxy for plasmid persistence and spread. However, specific development and demonstration of FCM and real-time qPCR for the purposes of routine quantification of plasmid persistence still is lacking.
Here, we rigorously compare and contrast the use of FCM and real-time qPCR as alternatives to conventional plating methods for routine measurement of plasmid persistence. We demonstrate the strengths and limitations of the methods by statistically comparing performance criteria, such as resolution, variance, and dynamic range, in plasmid persistence assays. This was done using a gfp-marked variant of the natural multidrug resistance plasmid pB10 and three different hosts wherein the wild-type plasmid previously has been shown to be stable, moderately unstable, and highly unstable (4).
MATERIALS AND METHODS
Bacterial strains, plasmids, and growth conditions.
Plasmid pB10 was previously tagged with mini-Tn5-PA1–04/03::gfp, a Tn5 derivative transposon encoding green fluorescent protein (GFP) to produce pB10::gfp (24). The persistence of pB10::gfp was determined in Pseudomonas putida H2 (15), P. putida UWC-1 (25), and P. veronii S34 (26). To monitor plasmid persistence in so-called plasmid stability assays, here named plasmid persistence assays, all strains were cultured in Luria-Bertani (LB) broth at 30°C with shaking. Each day for the duration of the assays, 4.9 μl of culture was transferred into 5 ml of fresh media and incubated for 24 h, yielding ∼10 generations per day. Kanamycin (50 μg/ml) and tetracycline (10 μg/ml) were added only to the precultures to try to ensure 100% plasmid retention at the start of the persistence assays (T0). The cells harvested after each 24-h growth period were examined by the three methods. To set up mixed cultures with known ratios of plasmid-containing and plasmid-free P. putida UWC-1 cells, the optical density at 600 nm (OD600) of each culture was standardized to 2.4, and the plasmid-containing cultures were diluted into the plasmid-free cultures following a 1:2, 1:3, or 1:10 dilution series, each spanning 6 dilution intervals.
General DNA techniques.
Plasmid preparation, restriction endonuclease digestion, gel electrophoresis, and cloning were carried out using standard techniques (27, 28). DNA regions for cloning were amplified by PCR using 2× PCR master mix (Thermo Scientific) per the manufacturer's instructions. The reaction parameters included an initial denaturation step of 10 min at 94°C, 30 cycles of denaturation (30 s at 94°C), a variable annealing step dependent upon the average primer annealing temperature, and an elongation step at 72°C with the extension time dependent on the amplicon size.
Plate count assays.
Each day for the duration of the persistence assays, dilutions of each culture were spread onto nonselective LB agar such that approximately 100 to 300 individual colonies were obtained per sample. The fraction of plasmid-containing colonies within each sampled population was determined by counting the fluorescent and nonfluorescent colonies during exposure to a 488-nm light source. To avoid the bias that would have been introduced due to the visible presence of GFP in plasmid-containing cells, the presence/absence of fluorescence was used as an indicator of plasmid presence/absence rather than antibiotic resistance, as is more commonly done (4, 5, 13–16).
Flow cytometry.
In preparation for FCM analysis, 1 ml of each culture was centrifuged (8,000 rpm; 2 min), the supernatant discarded, and the cells resuspended in 1 ml phosphate-buffered saline (PBS; pH 7.4). The washed cells were diluted 10-fold in PBS, and 105 events (i.e., cells) were interrogated following exposure to a 488-nm light source using a BD FACSAria flow cytometer. The forward (FSC) and side scatter (SSC) photomultiplier voltages were set each day using a positive (plasmid-containing) and negative (plasmid-free) control for each strain such that both populations were optimally counted at a flow rate of 1,000 to 2,000 events per second. The SSC, FSC, and fluorescein isothiocyanate (FITC) photomultiplier voltages used for P. putida H2, P. putida UWC-1, and P. veronii S34 were 475 nV (SSC and FSC) and 675 nV (FITC); varying over time (days) between 350 to 500 nV (SSC and FSC) and 575 to 650 nV (FITC); and 450 nV (SSC), 425 nV (FSC), and 600 nV (FITC). The bacterial populations first were gated based on their SSC and FSC profiles to eliminate background events, which were recognized by sampling a blank PBS solution in parallel. Fluorescent and nonfluorescent cells within the gated population were discriminated based on fluorescent intensity (FITC-A). The FITC-A gate was set each day such that 99.5% of the positive-control population for each strain was counted as FITC-A positive (fluorescent). The BD FACSAria software (BD FACSDiva, firmware version 1.9) was used for data acquisition, and FlowJo v10 software was used for subsequent analysis.
Real-time qPCR.
In the preparation of real-time qPCR, cell pellets collected after centrifugation (8,000 rpm for 2 min) of 0.5 ml per culture at each time point were stored at −20°C until total genomic DNA (gDNA) of all samples was extracted in a randomized order at the end of the 10-day assay using a Genelute bacterial gDNA kit (Sigma-Aldrich). The purified gDNA was quantified using a NanoDrop spectrophotometer. All real-time qPCRs were performed using a StepOnePlus real-time PCR system together with a Power SYBR green PCR master mix kit (Applied Biosystems) per the manufacturer's instructions. The amplification parameters for all real-time qPCRs were 94°C for 10 min, 40 cycles of 94°C for 15 s, and 60°C for 60 s. The melting curve parameters were 94°C for 15 s and 60°C for 30 s, followed by a temperature increase to 94°C with a ramp rate of 0.1%. The fluorescent signal was acquired after each 60°C amplification step and continuously during the melting curve analysis. Unless otherwise stated, 2 ng of template DNA was used per reaction.
For all three bacterial strains, the chromosomal DNA was quantified using the gammaproteobacterium-specific qPCR primers 1080γF (5′-TCGTCAGCTCGTGTYGTGA-3′) and γ1202R (5′-CGTAAGGGCCATGATG-3′), designed and validated for real-time qPCR by Bacchetti et al. (29). Plasmid pB10::gfp was quantified using primers GFP-Fwd (5′-GCCAACACTTGTCACTACTTTC-3′) and GFP-Rev (5′-TGTCTTGTAGTTCCCGTCATC-3′). For each primer pair, the optimal primer concentrations were determined using a 3-by-3 factorial design in which individual primer concentrations were 250, 500, or 750 nM. Except for γ1202R, which had an optimal concentration of 750 nM, all other primers functioned optimally at 250 nM.
For relative quantification of plasmid abundance, the amplification efficiency (E) for both the plasmid- and 16S rRNA gene-specific primer pairs was greater than 1.91, using the slope (m) of a standard curve (R2 > 0.99) constructed from a 10-fold serial dilution of gDNA for each of the three strains (equation 1). The gDNA concentrations in the standard curves ranged from 2 × 101 to 2 × 10⁻⁴ ng gDNA per reaction. The abundance (RA) of pB10::gfp (P) at a given time point (Tn) relative to T0 and normalized to the abundance of 16S rRNA genes (16S) at Tn and T0 was calculated as shown in equations 2 and 3, where Cp is the threshold crossing point and S is the amplicon size. The plasmid/chromosome ratio (P:16S) was calculated by multiplying the output from equation 2 by the number of 16S rRNA gene copies per chromosome. P. putida has seven (30) and P. veronii three (31) 16S rRNA gene copies per chromosome.
| (1) |
| (2) |
| (3) |
For absolute quantification of the number of chromosomes per reaction, standard curves were constructed using known quantities of pWLE005 (3,302 bp), ranging between ∼109 and 105 molecules per reaction. This vector was constructed by cloning the 16S rRNA gene from P. putida UWC-1, using the universal primers 27f (5′-AGAGTTTGATCMTGGCTCAG-3′) and 1492r (5′-TACGGYTACCTTGTTACGACTT-3′), into pJET1.2 using a CloneJET PCR cloning kit (Thermo Scientific) per the manufacturer's instructions. The number of chromosomes in each real-time qPCR was extrapolated from the standard curves using equation 4, where Cp is the threshold crossing point, y and m are the intercept and slope of the linear regression, respectively, and N16S is the number of 16S rRNA gene copies per chromosome.
| (4) |
Statistical analysis.
A logistic regression model (32) was used to estimate the rate of decline of plasmid-bearing cells in the population, in part as previously described (33). The model estimates the rate of decrease of the plasmid-bearing fraction in a population over time but does not distinguish between the effects of segregational plasmid loss at cell division, plasmid cost, or horizontal plasmid transfer. Due to the nonlinear nature of this rate, the maximum rate of decline of the plasmid-bearing fraction was used to compare the ability of the different techniques to quantitatively measure differences in plasmid persistence. This maximum rate occurs at the time where the plasmid-bearing fraction of the population is 50% and is loosely defined as the (plasmid) loss rate throughout this study. Markov chain Monte Carlo (MCMC) was used to implement the model, specifically using a Gibbs sampler (34) as implemented in JAGS (35), and convergence was assessed using the Gelman-Rubin diagnostic (36). Computation was done using R, version 2.15.0 (R Development Core Team, 2012; http://www.R-project.org/) utilizing the package rjags (M. Plummer, 2011; http://CRAN.R-project.org/package=rjags) for interface with JAGS and CODA (37) for diagnostics. A more detailed description of logistic regression models can be found in the supplemental material. Statistical comparisons were done utilizing the Welch two-sample t test (unpaired), analysis of variance (ANOVA), and variance comparison functions, where appropriate, within the R software package. The stability assay data used in the analysis are included as Data Sets S1 and S2 in the supplemental material.
RESULTS AND DISCUSSION
The natural IncP-1β plasmid pB10 previously was shown to be stable, moderately unstable, and highly unstable in P. putida UWC-1, P. veronii S34, and P. putida H2, respectively (4). Using the same three hosts and a GFP-encoding derivative of pB10, pB10::gfp, we set out to determine whether FCM and real-time qPCR can be used as alternative techniques for monitoring plasmid persistence compared to more conventional PC methods. Normally in these conventional assays, the selectable phenotype would be plasmid-encoded antibiotic resistance, and the relative proportions often are determined by replica plating. However, here we used green fluorescence of colonies on nonselective agar plates as an indicator of plasmid presence to avoid the visible bias that otherwise would be introduced in replica plating.
Effect of marker gene insertion in plasmid persistence.
To determine possibly confounding effects of plasmid marking on determining plasmid persistence, we compared the persistence of pB10::gfp to that of the wild-type (WT) unmarked plasmid pB10 using the PC method. First, just like pB10, pB10::gfp persisted extremely well in P. putida UWC-1. The difference in plasmids is the insertion of a minitransposon with antibiotic resistance and gfp genes into the kfrB gene, which may be involved in plasmid inheritance (38). Based on our results, the segregational loss rate of both plasmids must be extremely low in this strain despite the disruption of kfrB. Thanks to this apparent low loss rate, additional costly genes on the plasmid did not have a drastic effect on the overall persistence. Second, in P. veronii S34 the mean loss rate of pB10::gfp was −9.88 × 10⁻³ per generation compared to only sporadic loss (indistinguishable from 0) of pB10 during the same 10-day period (4) (see Fig. S1 and S2 in the supplemental material) (Welch two-sample t test; t = −63.6086; df = 29; P < 0.001; where t is the t statistic, df is the degrees of freedom, and the P value is the probability that the two data sets are different). It should be noted that in a previous study, the pB10-bearing fraction also rapidly decreased after 10 days, indicating an acceleration of loss for the marked plasmid (4). Lastly, in P. putida H2, the mean loss rate for pB10::gfp was lower than that for pB10 (−3.11 × 10⁻² and 9.85 × 10⁻² per generation, respectively; Welch two-sample t test; t = 79.3615; df = 35.445; P < 0.001). However, Fig. S1 in the supplemental material clearly shows that the initial fraction of pB10::gfp-containing cells was lower, and that of plasmid-containing cells decreased below detectable levels sooner. Thus, in P. veronii S34 and P. putida H2, insertion of the GFP-encoding transposon into pB10 seemed to adversely affect plasmid stability. This likely is due to an increase in the plasmid cost through the addition of expressed genes, even though a negative effect of kfrB inactivation on plasmid inheritance in these strains, in contrast to UWC-1, cannot be excluded. Insertion of any marker gene that is expressed throughout the assay likely will increase the plasmid's fitness cost, but its effect on segregational loss can be minimized by carefully choosing a suitable locus for insertion.
Plasmid persistence by flow cytometry.
We compared the results of plasmid persistence assays as measured by FCM and PC. To monitor the fraction of plasmid-containing cells in each of the three strains by FCM, samples of triplicate populations were interrogated daily for the presence or absence of a GFP phenotype in individual cells. The discriminatory gates were set based on the SSC, FSC, and FITC-A measurements of positive (plasmid-containing) and negative (plasmid-free and blank) control populations (Fig. 1). The absence of a fluorescent phenotype following plasmid loss allowed easy differentiation between plasmid-free (FITC-A−) and plasmid-containing (FITC-A+) cells (Fig. 1D to F). The loss of the fluorescent signal after plasmid loss is due to GFP degradation and dilution upon cell division; this may cause a delay between the actual plasmid loss event and complete signal extinction, possibly causing a slight overestimation of the plasmid-containing fraction. Since the plasmid-free and plasmid-bearing cells did not differ much in the SSC and FSC scatter profiles (Fig. 1A to C), these measures were used only to distinguish bacterial cells from the background.
FIG 1.

FCM scatter SSC/FSC profiles (A to C) and population count histograms (D to F) clearly showing the plasmid-bearing fluorescent (FITC-A+) (red, right side in panels D to F) and plasmid-free nonfluorescent fractions (FITC-A−) (blue, left side in panels D to F), as well as control populations of P. putida UWC-1, P. veronii S34, and P. putida H2. Initial SSC-FSC gates (black lines) were set using plasmid-containing and plasmid-free control populations as well as a blank sample (orange) to exclude background events. The populations then were further gated on FITC-A such that 99.5% of the plasmid-containing population was FITC-A positive (P. putida UWC-1 and P. veronii S34) or to best discriminate between the plasmid-containing and -free populations (P. putida H2). Thus, the SSC-FSC profiles and histograms for each strain are composites representing individual populations of plasmid-containing (red) and plasmid-free cells (blue) as well as a blank sample (orange).
For P. putida UWC-1, the persistence profiles (Fig. 2) generated by PC and FCM were very similar, as expected due to the persistent nature of pB10::gfp in this strain. As there was no net change in the fraction of plasmid-bearing cells over time when measured using either PC or FCM, the logistic regression model could not be used and the plasmid loss rates were reported as zero (Fig. 3).
FIG 2.

Plasmid persistence measured using FCM (A to C) and real-time qPCR (D to F) compared to PC for each of the three bacterial hosts. Each persistence assay was repeated in triplicate. P+, plasmid-containing; RA, relative abundance.
FIG 3.
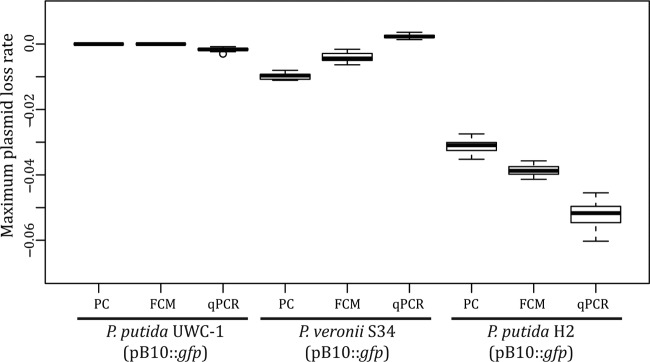
Maximum plasmid loss rates calculated based on the data obtained by the three techniques. This rate represents the average rate of change in the fraction of plasmid-containing cells (PC and FCM) or in the normalized abundance of plasmid DNA (real-time qPCR) per generation at the time point where 50% of the population was plasmid free.
In P. veronii S34, FCM estimated a slightly lower plasmid loss rate than the moderately low plasmid loss rate observed by PC (−4.01 × 10⁻³ and −9.75 × 10⁻³ per generation, respectively; Welch two sample t test; t = −20.2862; df = 48.466; P < 0.001) (Fig. 2 and 3). At the same photomultiplier voltages, the scatter profile of plasmid-containing P. veronii S34 cells had a broader distribution across both SSC and FSC, while plasmid-free cells were distributed more broadly across SSC than FSC (Fig. 1). There was also a noticeable bias toward GFP-positive cells during counting; more plasmid-containing cells were counted than plasmid-free cells in a culture with similar densities of the two respective populations. These factors, combined with the possible delay in loss of fluorescence signal, likely resulted in underestimation of the maximum plasmid loss rate in P. veronii S34. Therefore, the ability to accurately measure the frequency of plasmid-containing and -free cells within a population of cells using FCM is contingent upon the ability to discriminate between the two subpopulations without introducing a bias.
The mean rate of plasmid loss in P. putida H2, which poorly maintained pB10::gfp (Fig. 2), estimated by FCM was only slightly higher than that inferred by PC (3.91 × 10⁻² and 3.10 × 10⁻² per generation, respectively; Welch two sample t test; t = 17.0344; df = 56.257; P < 0.001) (Fig. 3). In contrast, a larger initial fraction of plasmid-containing cells was recorded by FCM than by PC (Fig. 2). Therefore, we tested the possibility that PC underestimated plasmid presence due to plasmid loss occurring within colonies during growth on the nonselective agar plate. If plasmid loss occurred early during colony growth, fluorescence might not be visible to the naked eye, and such colonies would be mistakenly recorded as plasmid free even though a small fraction still retained the plasmid. To test this, 52 nonfluorescent colonies from each of the 3 replicate P. putida H2 (pB10::gfp) populations at T0 were replicated onto plasmid-selective and nonselective media. Of these, 10% ± 2% grew on plates with plasmid-selective antibiotics and displayed the GFP phenotype. Thus, plasmid loss also occurred during colony growth on the nonselective media, resulting in nonfluorescent colonies that were founded by fluorescent plasmid-bearing cells, thereby underestimating their proportion. In conclusion, while the plasmid persistence curves obtained with the two methods did not coincide for two of the strains, they follow the same trend and confirm previous findings that plasmid pB10 can be very stable, moderately unstable, and highly unstable depending on the host (Fig. 2).
Plasmid persistence by real-time qPCR.
Real-time qPCR was used to assay plasmid persistence by determining the ratio of plasmid DNA molecules to 16S rRNA gene molecules within total DNA extractions from cells harvested over the course of the persistence assays. The normalized data then were used to determine the abundance of plasmid DNA at a given time point relative to that at the initial time point as a proxy for plasmid persistence. The persistence profiles of pB10::gfp in P. putida UWC-1 and P. veronii S34 obtained by real-time qPCR were more variable than that by PC. This resulted in a mean loss rate in P. putida UWC-1 that was slightly higher (1.163 × 10⁻³ compared to 0 per generation; Welch two-sample t test; t = 20.0979; df = 29; P < 0.001), while in P. veronii S34 it was significantly lower than the estimates based on PC (2.15 × 10⁻³ and −9.75 × 10⁻³ per generation, respectively; Welch two-sample t test; t = −66.8335; df = 52.108; P < 0.001) (Fig. 2 and 3). From the PC data it was evident that pB10::gfp-free cells were generated rarely, if ever, during the P. putida UWC-1 persistence assay. Therefore, it was possible to use the real-time qPCR data from this assay to calculate the average number of plasmids per chromosome for each day without plasmid loss being a factor. The ratio of plasmids to chromosome varied between 1.6 and 3.5 over time (Fig. 4). This was not significantly different from the variation in the plasmid/chromosome ratio within genomic DNA extracted in triplicate from the same frozen P. putida UWC-1(pB10::gfp) population on two different days (pairwise t test; df = 12; F = 1.079; P = 0.416). Thus, the fluctuation in plasmid abundance observed in P. putida UWC-1 and P. veronii S34 was likely the result of experimental error during genomic DNA extraction. Increasing the number of replicates to five per sample at the expense of sampling frequency did not make a meaningful difference (results not shown). However, due to changes in the physiological state of the culture over time, it is also possible that fluctuations in plasmid copy number have a similar effect when using real-time qPCR to measure plasmid persistence. In spite of the variation, when combined with a logistic regression model as done here, it is still possible to infer the overall ability of a plasmid to persist.
FIG 4.
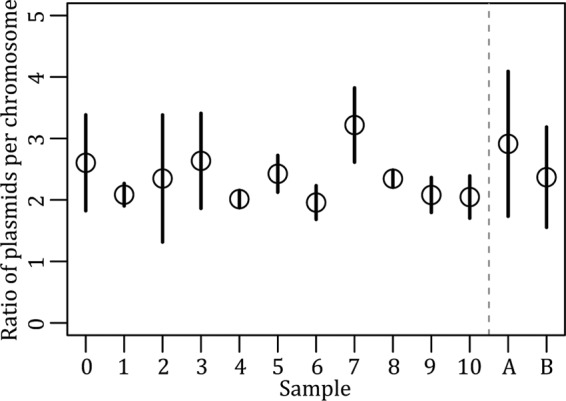
Fluctuations in the number of pB10::gfp plasmids per chromosome averaged across three replicate P. putida UWC-1 populations for each day of the persistence assay (samples 1 to 10) compared to the average ratio of plasmids per chromosome in triplicate genomic DNAs extracted on two different days from the same archived culture of UWC-1 (pB10::gfp) (samples A and B).
In a host such as P. putida H2, where plasmid persistence was poor, there was less fluctuation in the ratio of plasmid to chromosome over time. The result of the real-time qPCR measurements was a curve that indicated rapid plasmid loss (Fig. 2), and the mean loss rate was only slightly higher than that by PC (5.15 × 10⁻² and 3.11 × 10⁻² per generation, respectively; Welch two sample t test; t = 28.0541; df = 43.567; P < 0.001) (Fig. 3). A significant advantage of this technique was that pB10::gfp could be detected within the P. putida H2 population for the entire 10-day period. When measured by PC and FCM, the fraction of plasmid-containing cells decreased below detectable levels within 5 to 6 days, respectively. Each 2-ng P. putida H2 genomic DNA sample contained 4.62 × 10⁷ ± 1.54 × 10⁷ chromosomes (see Fig. S3 in the supplemental material). Assuming one chromosome per cell, the sample size screened by real-time qPCR was ∼1.86 × 10⁵- and ∼8.71 × 10²-fold greater than that screened by PC and FCM, respectively; this explains the ability to detect the plasmid even at very low abundances (Fig. 2). It should be noted, however, that stationary-phase cells often contain more than one chromosome per cell (39); thus, the sample size likely is overestimated 2- to 8-fold. Nonetheless, real-time qPCR provides a much larger dynamic range for measuring plasmid persistence than PC and FCM. Although such a high dynamic range is not required to capture plasmid loss rates in most experiments, it allows measuring the persistence of a plasmid even when it occurs in only a small fraction of a bacterial population or community.
Resolution.
The ability to resolve small differences in plasmid persistence becomes especially important when investigating the effect of specific genes, mutations, or hosts on the plasmid loss rate. To compare the resolving ability of FCM and real-time qPCR to that of the PC method, we constructed and analyzed three artificial persistence assays using P. putida UWC-1 cells with and without pB10::gfp (Fig. 5). In these assays, the plasmid-containing bacterial culture was diluted into a plasmid-free culture following either a 1:2, 1:3, or 1:10 dilution series to obtain slopes which, in theory, are equivalent to plasmid loss rates (change in fraction of plasmid-bearing cells per dilution) of −0.075, −0.119, and −0.250, respectively, and representing relative rate differences of 1.59-fold (1:3 versus 1:2), 2.10-fold (1:10 versus 1:3), and 3.32-fold (1:10 versus 1:2). The three techniques yielded mean loss rates that were similar but not identical to each other (Fig. 6; also see Table S1 in the supplemental material), yet they all were able to statistically resolve the relatively small differences in loss rates (see Table S2). The variation in the estimated maximum loss rates introduced by each technique generally was similar between the three methods (see Table S3). Thus, all three methods were capable of resolving the small differences in these artificial persistence assays.
FIG 5.
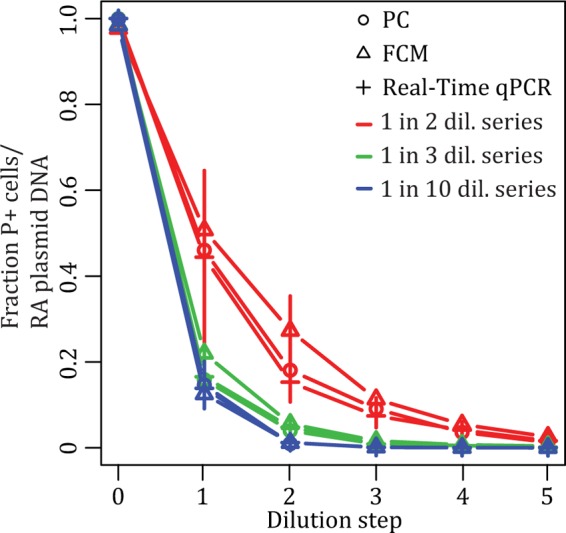
Artificial plasmid persistence assays, consisting of mixtures of plasmid-containing and -free P. putida UWC-1 cells at known ratios and measured by PC, FCM, and real-time qPCR. Different artificial plasmid loss rates were obtained by serially diluting cultures of plasmid-containing cells into cultures of plasmid-free cells 5 times following a 1:2, 1:3, and 1:10 dilution (dil.) series, performed in triplicate. P+, plasmid containing; RA, relative abundance. See Fig. S4 in the supplemental material for the same results displayed on a logarithmic scale.
FIG 6.
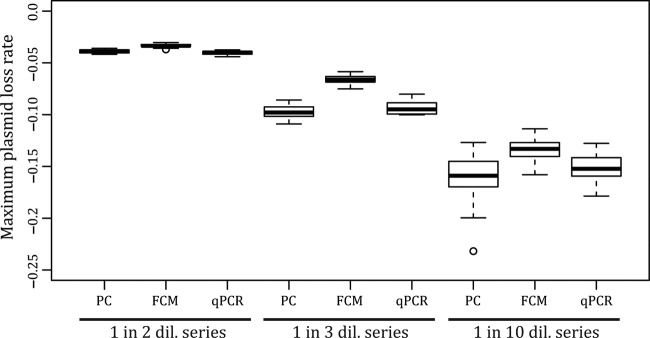
Maximum plasmid loss rate measured by PC, FCM, and real-time qPCR for the three artificial plasmid persistence assays consisting of known ratios of plasmid-containing and -free cells. Rates are expressed as per-generation values to make them comparable to the rates estimated from real persistence assays, with a dilution cycle being equivalent to 1 day, i.e., 10 generations, in the serial batch cultures.
Conclusions.
Both FCM and real-time qPCR were successfully applied to monitor the persistence of pB10::gfp in three different bacterial hosts compared to a more conventional PC assay. Although more sample processing was required (thereby also increasing the cost per sample), real-time qPCR, unlike PC and FCM, does not require any selectable markers to be present on the plasmid and provides the highest dynamic range. Thus, real-time qPCR-based measurement of plasmid persistence would allow monitoring the persistence of resistance as well as so-called cryptic plasmids even at low abundance, as long as partial DNA sequence is available. The caveat to this technique was the fluctuation in the data in cases where there was little to no plasmid loss. Current statistical models for separating the effects of segregational loss, cost, and transfer on plasmid persistence have been developed previously within our group, but currently they rely on measurements of the actual frequencies of plasmid-containing and -free cells within a population (19, 40). Adaptation of these models to use the relative abundance of plasmid DNA as measured in this study will further increase the usefulness of real-time qPCR for the purposes of quantitatively measuring and defining plasmid persistence.
In contrast to real-time qPCR, FCM interrogates individual cells within a population for the presence or absence of a plasmid-encoded phenotype, making the data more suitable for our existing models. However, FCM is not without its caveats. Differences in the SSC and FSC scatter profiles of plasmid-containing and -free cells or differences in fluorescence intensity due to GFP instability or autofluorescence within cells can result in biased counting and, therefore, under- or overestimations of plasmid stability. There is also an unavoidable metabolic cost associated with expression of the heterologous GFP and a potential gene loss or mutations during long-term cultivation. An alternative FCM-based strategy that negates the need for plasmid-encoded markers is the use of fluorescently labeled antibodies to recognize plasmid-specific antigens. This would, however, limit such assays to plasmids that express surface-located proteins and would drastically increase the sample preparation time.
The differences in loss rates measured by FCM and real-time qPCR within plasmid persistence assays with P. veronii S34 and P. putida H2 (Fig. 3) were not observed in the artificial persistence assays (Fig. 6). This suggests that these loss rate differences were not related to the methods themselves but rather were due to changes in the bacterial cells over time that affected the FCM and real-time qPCR-based measurements in different ways.
Finally, although FCM appeared to introduce slightly less variance in the estimated maximum loss rates compared to real-time qPCR, both techniques were found to be suitable for resolving small differences in plasmid stability. Thus, given the growing need for high-throughput methods, both FCM and real-time qPCR technologies are candidate methods for the routine measurement of plasmid persistence in high-throughput formats with the additional advantage of high resolution and dynamic range. Given the drawback of inserting a fluorescent marker gene for FCM, we recommend qPCR as the best high-throughput method for monitoring plasmid persistence.
Supplementary Material
ACKNOWLEDGMENTS
This work was funded by the National Institute of Allergy and Infectious Diseases (NIAID) of the National Institutes of Health (NIH grant R01 AI084918) and the United States Department of Defense (award number DM110149). Additional support was provided by the IBEST Core Facilities, funded by a Center of Biomedical Research Excellence grant (GM10332401) from the National Institute of General Medical Sciences of the National Institutes of Health.
We thank Zaid Abdo for previously developing the logistic regression model and Ranae Shrum for helpful discussions on statistical methods.
Footnotes
Published ahead of print 27 June 2014
Supplemental material for this article may be found at http://dx.doi.org/10.1128/AEM.00793-14.
REFERENCES
- 1.Thomas CM. 2000. Paradigms of plasmid organization. Mol. Microbiol. 37:485–491. 10.1046/j.1365-2958.2000.02006.x [DOI] [PubMed] [Google Scholar]
- 2.Bingle LE, Thomas CM. 2001. Regulatory circuits for plasmid survival. Curr. Opin. Microbiol. 4:194–200. 10.1016/S1369-5274(00)00188-0 [DOI] [PubMed] [Google Scholar]
- 3.Bouma JE, Lenski RE. 1988. Evolution of a bacteria/plasmid association. Nature 335:351–352. 10.1038/335351a0 [DOI] [PubMed] [Google Scholar]
- 4.De Gelder L, Ponciano JM, Joyce P, Top EM. 2007. Stability of a promiscuous plasmid in different hosts: no guarantee for a long-term relationship. Microbiology 153:452–463. 10.1099/mic.0.2006/001784-0 [DOI] [PubMed] [Google Scholar]
- 5.De Gelder L, Williams JJ, Ponciano JM, Sota M, Top EM. 2008. Adaptive plasmid evolution results in host-range expansion of a broad-host-range plasmid. Genetics 178:2179–2190. 10.1534/genetics.107.084475 [DOI] [PMC free article] [PubMed] [Google Scholar]
- 6.Friehs K, Reardon KF. 1993. Parameters influencing the productivity of recombinant E. coli cultivations. Adv. Biochem. Eng. Biotechnol. 48:53–77 [DOI] [PubMed] [Google Scholar]
- 7.Sota M, Yano HHM, Daughdrill JGW, Abdo Z, Forney LJ, Top EM. 2010. Shifts in the host range of a promiscuous plasmid through parallel evolution of its replication initiation protein. ISME J. 4:1568–1580. 10.1038/ismej.2010.72 [DOI] [PMC free article] [PubMed] [Google Scholar]
- 8.Gillings MR. 2013. Evolutionary consequences of antibiotic use for the resistome, mobilome and microbial pangenome. Front. Microbiol. 4 10.3389/fmicb.2013.00004 [DOI] [PMC free article] [PubMed] [Google Scholar]
- 9.Kåhrström CT. 2013. Entering a post-antibiotic era? Nat. Rev. Microbiol. 11:146. 10.1038/nrmicro298323411853 [DOI] [Google Scholar]
- 10.San Millan A, Heilbron K, Maclean RC. 2014. Positive epistasis between co-infecting plasmids promotes plasmid survival in bacterial populations. ISME J. 8:601–612. 10.1038/ismej.2013.182 [DOI] [PMC free article] [PubMed] [Google Scholar]
- 11.Bonot S, Merlin C. 2010. Monitoring the dissemination of the broad-host-range plasmid pB10 in sediment microcosms by quantitative PCR. Appl. Environ. Microbiol. 76:378–382. 10.1128/AEM.01125-09 [DOI] [PMC free article] [PubMed] [Google Scholar]
- 12.Cooper TF, Heinemann JA. 2000. Postsegregational killing does not increase plasmid stability but acts to mediate the exclusion of competing plasmids. Proc. Natl. Acad. Sci. U. S. A. 97:12643–12648. 10.1073/pnas.220077897 [DOI] [PMC free article] [PubMed] [Google Scholar]
- 13.Deane SM, Rawlings DE. 2004. Plasmid evolution and interaction between the plasmid addiction stability systems of two related broad-host-range IncQ-like plasmids. J. Bacteriol. 186:2123–2133. 10.1128/JB.186.7.2123-2133.2004 [DOI] [PMC free article] [PubMed] [Google Scholar]
- 14.Guynet C, Cuevas A, Moncalián G, de la Cruz F. 2011. The stb operon balances the requirements for vegetative stability and conjugative transfer of plasmid R388. PLoS Genet. 7:e1002073. 10.1128/AEM.01125-09 [DOI] [PMC free article] [PubMed] [Google Scholar]
- 15.Heuer H, Fox RE, Top EM. 2007. Frequent conjugative transfer accelerates adaptation of a broad-host-range plasmid to an unfavorable Pseudomonas putida host. FEMS Microbiol. Ecol. 59:738–748. 10.1111/j.1574-6941.2006.00223.x [DOI] [PubMed] [Google Scholar]
- 16.Popov M, Petrov S, Nacheva G, Ivanov I, Reichl U. 2011. Effects of a recombinant gene expression on ColE1-like plasmid segregation in Escherichia coli. BMC Biotechnol. 11:18. 10.1186/1472-6750-11-18 [DOI] [PMC free article] [PubMed] [Google Scholar]
- 17.Wegrzyn K, Witosinska M, Schweiger P, Bury K, Jenal U, Konieczny I. 2013. RK2 plasmid dynamics in Caulobacter crescentus cells–two modes of DNA replication initiation. Microbiology 159:1010–1022. 10.1099/mic.0.065490-0 [DOI] [PubMed] [Google Scholar]
- 18.Tal S, Paulsson J. 2012. Evaluating quantitative methods for measuring plasmid copy numbers in single cells. Plasmid 67:167–173. 10.1016/j.plasmid.2012.01.004 [DOI] [PMC free article] [PubMed] [Google Scholar]
- 19.Lau BT, Malkus P, Paulsson J. 2013. New quantitative methods for measuring plasmid loss rates reveal unexpected stability. Plasmid 70:353–361. 10.1016/j.plasmid.2013.07.007 [DOI] [PMC free article] [PubMed] [Google Scholar]
- 20.Bahl MI, Hansen LH, Licht TR, Sørensen SJ. 2007. Conjugative transfer facilitates stable maintenance of IncP-1 plasmid pKJK5 in Escherichia coli cells colonizing the gastrointestinal tract of the germfree rat. Appl. Environ. Microbiol. 73:341–343. 10.1128/AEM.01971-06 [DOI] [PMC free article] [PubMed] [Google Scholar]
- 21.Bahl MI, Sørensen SJ, Hestbjerg Hansen L. 2004. Quantification of plasmid loss in Escherichia coli cells by use of flow cytometry. FEMS Microbiol. Lett. 232:45–49. 10.1016/S0378-1097(04)00015-1 [DOI] [PubMed] [Google Scholar]
- 22.Rysz M, Mansfield WR, Fortner JD, Alvarez PJ. 2013. Tetracycline resistance gene maintenance under varying bacterial growth rate, substrate and oxygen availability, and tetracycline concentration. Environ. Sci. Technol. 47:6995–7001. 10.1021/es3035329 [DOI] [PubMed] [Google Scholar]
- 23.Shintani M, Matsui K, Inoue J, Hosoyama A, Ohji S, Yamazoe A, Nojiri H, Kimbara K, Ohkuma M. 2014. Single-cell analyses revealed transfer ranges of IncP-1, IncP-7, and IncP-9 plasmids in a soil bacterial community. Appl. Environ. Microbiol. 80:138–145. 10.1128/AEM.02571-13 [DOI] [PMC free article] [PubMed] [Google Scholar]
- 24.Van Meervenne E, Van Coillie E, Kerckhof FM, Devlieghere F, Herman L, De Gelder LS, Top EM, Boon N. 2012. Strain-specific transfer of antibiotic resistance from an environmental plasmid to foodborne pathogens. J. Biomed. Biotechnol. 2012:834598. 10.1155/2012/834598 [DOI] [PMC free article] [PubMed] [Google Scholar]
- 25.McClure NC, Weightman AJ, Fry JC. 1989. Survival of Pseudomonas putida UWC1 containing cloned catabolic genes in a model activated-sludge unit. Appl. Environ. Microbiol. 55:2627–2634 [DOI] [PMC free article] [PubMed] [Google Scholar]
- 26.De Gelder L, Vandecasteele FPJ, Brown CJ, Forney LJ, Top EM. 2005. Plasmid donor affects host range of promiscuous IncP-1beta plasmid pB10 in an activated-sludge microbial community. Appl. Environ. Microbiol. 71:5309–5317. 10.1128/AEM.71.9.5309-5317.2005 [DOI] [PMC free article] [PubMed] [Google Scholar]
- 27.Ausubel FM, Brent R, Kingston RE, Moore DD, Seidman JG, Smith JA, Struhl K. 1993. Current protocols in molecular biology. Wiley Interscience, New York, NY [Google Scholar]
- 28.Sambrook J, Fritsch EF, Maniatis T. 1989. Molecular cloning, a laboratory manual. Cold Spring Harbor Laboratory Press, Cold Spring Harbor, NY [Google Scholar]
- 29.Bacchetti De Gregori T, Aldred N, Clare AS, Burgess JG. 2011. Improvement of phylum- and class-specific primers for real-time PCR quantification of bacterial taxa. J. Microbiol. Methods 86:351–356. 10.1016/j.mimet.2011.06.010 [DOI] [PubMed] [Google Scholar]
- 30.Bodilis J, Nsigue-Meilo S, Besaury L, Quillet L. 2012. Variable copy number, intra-genomic heterogeneities and lateral transfers of the 16S rRNA gene in Pseudomonas. PLoS One 7:e35647. 10.1371/journal.pone.0035647 [DOI] [PMC free article] [PubMed] [Google Scholar]
- 31.De Lima-Morales D, Chaves-Moreno D, Jarek M, Vilchez-Vargas R, Jauregui R, Pieper DH. 2013. Draft genome sequence of Pseudomonas veronii strain 1YdBTEX2. Genome Announc. 1:e00258-13. 10.1128/genomeA.00258-13 [DOI] [PMC free article] [PubMed] [Google Scholar]
- 32.Gelman A. 2007. Data analysis using regression and multilevel/hierarchical models. Cambridge University Press, Cambridge, United Kingdom [Google Scholar]
- 33.Hughes JM, Lohman BK, Deckert GE, Nichols EP, Settles M, Abdo Z, Top EM. 2012. The role of clonal interference in the evolutionary dynamics of plasmid-host adaptation. mBio 3:e00077–12. 10.1128/mBio.00077-12 [DOI] [PMC free article] [PubMed] [Google Scholar]
- 34.Geman S, Geman D. 1984. Stochastic relaxation, Gibbs distributions, and the Bayesian restoration of images. IEEE Trans. Pattern Anal. Mach. Intell. 6:721–741 [DOI] [PubMed] [Google Scholar]
- 35.Plummer M. 2003. JAGS: a program for analysis of Bayesian graphical models using Gibbs sampling. In Hornik K, Leisch F, Zeileis A. (ed), Proceedings of the 3rd International Workshop on Distributed Statistical Computing, Vienna, Austria [Google Scholar]
- 36.Geweke J. 1992. Evaluating the accuracy of sampling-based approaches to calculating posterior moments. In Bernardo JM, Berger JO, Dawid AP, Smith AFM. (ed), Bayesian statistics 4. Oxford, University Press, Oxford, United Kingdom [Google Scholar]
- 37.Plummer M, Best N, Cowles K, Vines K. 2006. CODA: convergence diagnosis and output analysis for MCMC. R News 6:7–11 [Google Scholar]
- 38.Adamczyk M, Dolowy P, Jonczyk M, Thomas CM, Jagura-Burdzy G. 2006. The kfrA gene is the first in a tricistronic operon required for survival of IncP-1 plasmid R751. Microbiology 152:1621–1637. 10.1099/mic.0.28495-0 [DOI] [PubMed] [Google Scholar]
- 39.Åkerlund T, Nordström K, Bernander R. 1995. Analysis of cell size and DNA content in exponentially growing and stationary-phase batch cultures of Escherichia coli. J. Bacteriol. 177:6791–6797 [DOI] [PMC free article] [PubMed] [Google Scholar]
- 40.Ponciano JM, De Gelder L, Top EM, Joyce P. 2007. The population biology of bacterial plasmids: a hidden Markov model approach. Genetics 176:957–968. 10.1534/genetics.106.061937 [DOI] [PMC free article] [PubMed] [Google Scholar]
Associated Data
This section collects any data citations, data availability statements, or supplementary materials included in this article.