

Abstract
Because of their central role in muscle development and maintenance, MEF2 family members represent excellent candidate effectors of the muscle pathology in myotonic dystrophy (DM). We investigated the expression and alternative splicing of all four MEF2 genes in muscle from neuromuscular disorder (NMD) patients, including DM1 and DM2. We observed MEF2A and MEF2C overexpression in all NMD muscle, including 12 MEF2-interacting genes. Exon 4 and 5 usage in MEF2A and MEF2C was different between DM and normal muscle, with DM showing the embryonic isoform. Similar splicing differences were observed in other NMD muscle. For MEF2C, missplicing was more pronounced in DM than in other dystrophies. Our data confirm dysregulation of MEF2A and MEF2C expression and splicing in several NMD, including DM. Our findings demonstrate that aberrant splicing in NMD is independent from expression of mutant repeats, and suggests that some aberrant splicing, even in DM, may be compensatory rather than primary.
Keywords: dysregulation, MADS-domain transcription enhancer factor 2, MEF2, myotonic dystrophy, splicing
The MADS-domain transcription enhancer factor 2 genes (MEF2A, MEF2B, MEF2C, and MEF2D) constitute a family of calcium-regulated enhancer factors that play a pivotal role in the differentiation and function of skeletal, cardiac, and smooth muscle cells as well as neurons.1–3 The MEF2 proteins all share a conserved 57-amino-acid DNA-binding domain (MADS-box) at their N-terminus that, along with the adjacent MEF-box, binds to the MEF2-target DNA sequences in the regulatory regions of many muscle-specific genes. The four MEF2 genes share similar genomic structures, and complex alternative splicing leads to a multiplicity of isoforms. The genomic structure of the four genes, along with their known isoforms, is depicted in Figure 1. Some of this alternative splicing undergoes developmental switching, and some confers muscle or neuronal specificity.4,5 It has been suggested that MEF2A may be involved in early commitment to muscle differentiation, whereas MEF2C may be important in maintenance of the differentiated state.4 The role of MEF2C in maintaining sarcomere integrity has been elucidated in a recent study.3 Overexpression of MEF2A and MEF2C has been shown to induce dilated cardiomyopathy,6 a condition that sometimes occurs in myotonic dystrophy (DM) patients.7,8
FIGURE 1.
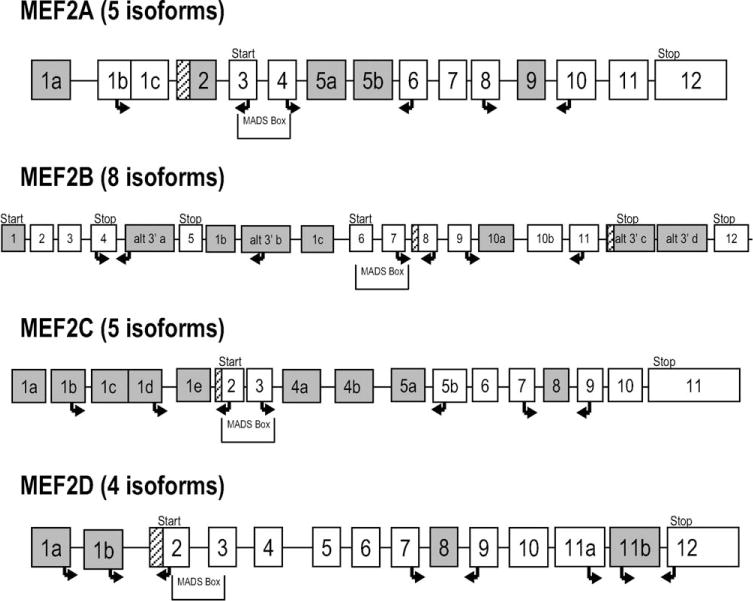
Exon/intron structure and primers for MEF2 genes. Isoforms are from the ‘Known Genes’ track of the UCSC Genome Browser (http://genome.ucsc.edu/cgi-bin/hgGateway?clade=vertebrate&org=Human&db=hg18&hgsid=77028912). White boxes: constant exons; shaded boxes: alternative exons; crosshatched boxes: alternative extensions. Arrows indicate primers for RT-PCR (right arrows: forward; left arrows: reverse). Location of MADS-box is shown with locations of translational starts/stops. To evaluate alternative 5′/3′ exons, because flanking exons are not constant, two reactions were used with one primer common to both: for MEF2A (five isoforms), three cassette exons (2, 5, 9) were interrogated; for MEF2B (eight isoforms), two cassette exons (8, 10) and one alternative 3′ (alt 3′ a); for MEF2C (five isoforms), two cassette exons (1e, 8) and one alternative 5′ exon (1d); and for MEF2D (four isoforms), two cassette exons (8, 11b) and one alternative 5′ exon (1b). For exon 11b, amplification products would be very large compared with those excluding it. This would strongly favor the smaller product. Therefore, a second reaction anchored in exon 11b was necessary to verify its presence in the product.
Myotonic dystrophy type 1 (DM1) and type 2 (DM2) are the most common adult-onset muscle diseases. They are characterized by autosomal dominant inheritance, muscle weakness and atrophy, myotonia, and multisystem organ involvement.9,10 DM is caused by unstable microsatellite repeat expansions—in DM1 a (CTG)n expansion in the 3′ UTR of DMPK in chromosome 19q13.311–13 and, in DM2, a (CCTG)n expansion in intron 1 of ZNF9 in 3q21.3.14 The principal muscle phenotypes are distal muscle weakness and atrophy in DM1, proximal muscle weakness and myalgia in DM2, and muscle stiffness and myotonia in both. In DM2 myotonia may be variable over time, to the point of being absent even on electromyography (EMG).9,10 Cardiac arrhythmias are a frequent cause of mortality in DM115 and have been associated with dilated cardiomyopathy.16 Muscle pathology in DM typically includes findings of internalized nuclei and fiber size variation. Sarcoplasmic masses, ring fibers, and atrophic type 1 fibers are characteristic of DM1, whereas early nuclear clump fibers and other highly atrophic type 2 fibers are typical for DM2.9,10 These features can also be seen to variable extents in other neuromuscular disorders.17
Because of their central role in muscle development and maintenance, the MEF2 genes represent excellent candidates as effectors of the muscle phenotype in DM. Using microarray expression analysis we previously showed overexpression of MEF2A and MEF2C in DM1 and DM2 relative to normal skeletal muscle.18 Herein we show that overexpression occurs not only in DM but also in other neuromuscular disorders (NMDs) that feature either dystrophy or myotonia. Because global splicing defects, particularly failure of the MBNL1-dependent postnatal transitions, have been reported to be a prominent feature of DM,19 we hypothesized that MEF2 genes may likewise be misspliced. We therefore conducted a comprehensive quantitative analysis of alternative splicing and preferential isoform usage in the four MEF2 genes. We show dysregulation of MEF2A and MEF2C for both expression and splicing in several NMD, including DM.
METHODS
Biological Materials
We used a panel of muscle biopsies from DM1, DM2, Becker muscular dystrophy (BMD), Duchenne muscular dystrophy (DMD), tibial muscular dystrophy (TMD), and myotonia congenita—autosomal dominant (MC-AD), DM-like, as well as normal individuals (both adult and fetal). A total of 68 samples were used for the U133 Plus2 microarray analysis, and a subset of 34 samples were used for splicing analysis by reverse transcript–polymerase chain reaction (RT-PCR). The RT-PCR panel also included myoblasts from DM1 and DM2 patients, normal myoblasts, and the fetal muscle biopsies. Samples are summarized in Table 1 and are described more fully in Table S1 (see Supplementary Material). Molecular diagnosis of all DM samples was confirmed by PCR across the repeats (both DM1 and DM2) and by repeat primed PCR (RP-PCR) as previously described.20 Non-Mendelian segregation in DM1 and DM2 families provided additional confirmation in some cases. Samples designated DM-like exhibited a progressive myotonic myopathy phenotype similar to DM but were negative for the presence of an expanded repeat in both DMPK and ZNF9. Whenever family members were available, linkage to these two loci was also ruled out. All human samples were obtained through the active collaboration and sharing of patient samples within the European Neuromuscular Centre (ENMC) Consortium on DM2 and Other Myotonic Dystrophies.21 Samples were collected after informed consent and with the appropriate oversight at the institutions of the various collaborating investigators, in accord with the Helsinki Declaration.
Table 1.
Summary of samples used for expression (U133 Plus2 microarray) and splicing (RT-PCR) analysis.
| Phenotype | U133 Plus2 (n) | RT-PCR (n) | Comments |
|---|---|---|---|
| A. Skeletal muscle biopsies | |||
| Normal adult | 6 | 5 | Purchased commercially |
| Normal fetal | 3 | 4 | Purchased commercially |
| DM1 | 10 | 3 | (CTG)n expansion in DMPK |
| DM2 | 20 | 6 | (CCTG)n expansion in ZNF9 |
| BMD | 5 | 3 | Becker muscular dystrophy |
| DMD | 3 | 3 | Duchenne muscular dystrophy |
| TMD | 4 | 2 | Tibial muscular dystrophy |
| MC-AD | 1 | 1 | Myotonia congenita—autosomal dominant |
| DM-like | 16 | 7 B. Myoblast cultures |
DM-like, no expansion in DMPK or ZNF9 |
| DM1 | 0 | 2 | (CTG)n expansion in DMPK |
| DM2 | 0 | 2 | (CCTG)n expansion in ZNF9 |
| Normal | 0 | 1 | |
| Total | 68 | 39 |
Microarray Expression Profiling
Skeletal muscle biopsies were homogenized in TriZol (Invitrogen, Carlsbad, California), and total cellular RNA was extracted according to the manufacturer’s suggestions. RNA was further purified using the RNeasy kit (Qiagen, Valencia, California). The quality and integrity of the RNA was analyzed on an Agilent BioAnalyzer using the RNA 6000 Nano LabChip (Agilent, Santa Clara, California). Only samples with an RNA integrity number (RIN) >7 were used. RNA expression profiling was performed on a U133 Plus2 GeneChip device (Affymetrix, Santa Clara, California), as previously described.22 Details of array procedures and analysis are available in the Materials and Methods section of the Supplemental Material.
Splice Variant Analysis
cDNA Synthesis
Total RNA from skeletal muscle was used to generate cDNA using standard methods. Briefly, for each sample, 5 μg of total RNA was DNaseI treated (Ambion, Austin, Texas) according to the manufacturer’s suggestions. Absence of contaminating DNA in the RNA samples was confirmed by performing PCR on total RNA using primers designed to amplify only untranscribed genomic sequence. DnaseI-treated RNA was split in half, and firststrand cDNA synthesis was performed on each half in separate reactions using random hexamer or oligo-(dT) priming according to the manufacturer’s protocol (SuperScript III First-Strand cDNA Synthesis Kit; Invitrogen, Carlsbad, California). All cDNAs were then RnaseH treated. Equal amounts of random hexamer and oligo-(dT) primed cDNA were pooled and diluted to 200 μl with molecular-grade RNAse-free H2O.
RT-PCR
Assays were designed to interrogate isoform preference for nine cassette exons, two alternative 5′ exons, and one alternative 3′ exon in the four MEF2 genes. Relative locations of the RT-PCR primers are indicated on the diagrams of the known isoforms in Figure 1. Primers are described in Table S3 (Supplementary Material). To estimate the amount of each isoform present, we performed RT-PCR in a three-primer reaction incorporating a universal primer with a fluorescent label for quantification.23 Each RT-PCR was performed in the log-linear range (28–32 cycles, determined empirically) with 2 μl of cDNA as template (12.5 ng starting total RNA equivalents). Capillary electrophoresis on a genetic analyzer (ABI-3100) allowed peak heights for each isoform to be measured. Peak heights for each sample were added together to determine the total signal. Each individual peak was then expressed as a percent of the total signal for that sample.
Data Analysis
For each of the assays, we used three tests together with dot-plot displays to assess differences in isoform percentages for the four groups (DM1, DM2, NMD including DM-like, and normal muscle). First, we used a Kruskal–Wallis test (a rank-based analysis of variance) to check whether there were significant differences between the four groups overall. Second, we used the Wilcoxon rank sum test to compare all of the disease samples (DM plus NMD) with the normal samples. Third, we used the Wilcoxon rank sum test to compare just the DM1/DM2 samples with the normal samples. Whenever appropriate, we also compared DM1/DM2 with all non-DM NMDs using the Wilcoxon tests.
RESULTS
Expression Changes in MEF2 Genes and MEF2-Interacting Genes in NMD Muscle
Expression analysis of all genes on the U133 Plus2 array showed separation of normal and diseased muscle with overexpression for MEF2A and MEF2C (Fig. 2, Table 2). We observed similar fold-change differences when normal muscle was compared with DM1 and DM2 together, or compared with all non–DM-diseased muscle (results not shown), suggesting that these results were robust. We then used Ingenuity Pathway Analysis to identify genes that interact with the MEF2 genes in molecular pathways. Table S2 (Supplementary Material) shows all 74 nonredundant MEF2-interacting genes and identifies them as regulators, targets, or binding partners of the MEF2 genes. Using these 74 MEF2-interacting genes for expression analysis, we observed separation of normal and diseased muscle similar to the analysis using all genes. Interestingly, diseased muscle samples showed no disease-specific clustering. A total of 18 probe sets, representing 12 of the 74 genes, showed coordinate upregulation. None of these 74 genes showed significant downregulation. Table 3 shows the fold change for the 12 upregulated genes in all three comparisons. The fact that similar fold changes were seen in all comparisons (all disease vs. N, DM vs. N, and non-DM disease vs. N) suggested that the data were robust. We next explored the known relationships between these coordinately upregulated genes, using Ingenuity Pathway Analysis. The highest scoring pathway involving these dysregulated genes was calcium signaling (P = 9.79E-07). All microarray data are publicly available (GEO, http://www.ncbi.nlm.nih.gov/geo/, accession nos. GSE7014 and GSE13608).
FIGURE 2.
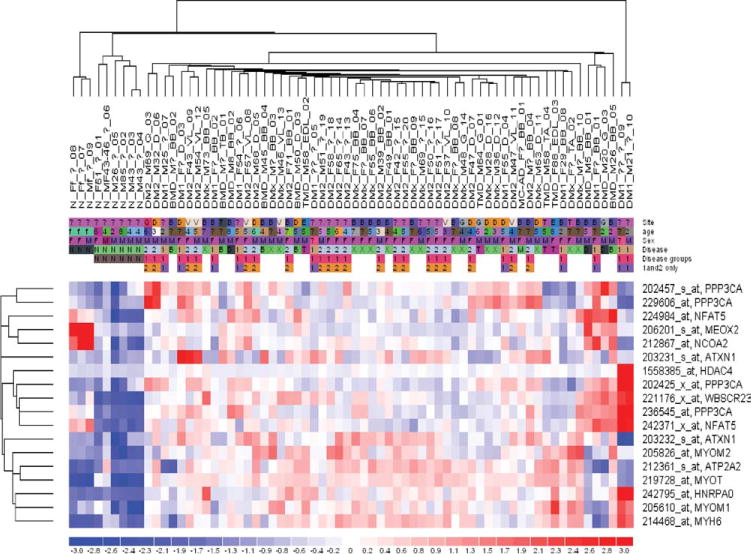
Dysregulation of MEF2-interacting genes. Heatmap and two-way hierarchical cluster analysis showing dysregulated expression of MEF2-interacting genes in all DM and non-DM NMD muscle (compared with N, normal). Blue represents underexpression, and red indicates overexpression. The normal samples cluster to the left, whereas there is no separation of the NMD samples by disease type. Sample names are in the format ‘Category_Sex_Age_Biopsy location_Identifier.’
Table 2.
Overexpression of MEF2 genes in diseased muscle.
| Probe set | Gene | Fold-change (FC) FDR (0; 0) disease vs. N |
Entrez nucleotide accession no. |
|---|---|---|---|
| 212535_at | MEF2A | 1.61 | AA142929 |
| 236395_at | MEF2C | 5.77 | AI523245 |
| 209200_at | MEF2C | 2.90 | AL536517 |
| 207968_s_at | MEF2C | 2.49 | NM_002397 |
| 209199_s_at | MEF2C | 2.33 | N22468 |
FDR, false discovery rate (median FDR; 90th percentile FDR).
Table 3.
Coordinate overexpression of probe sets representing MEF2-interacting genes.
| Gene
|
Fold-change (FC) comparison vs. normal adult
|
Relationship to MEF2
|
||||||
|---|---|---|---|---|---|---|---|---|
| FDR | All diseased (0; 0.056) |
DM-like/NMD (0; 0.015) |
DM1/DM2 (0; 0.011) |
Regulator | Target | Binding | U133 Plus probe set | Entrez nucleotide accession no. |
| ATP2A2 | 1.64 | 1.76 | 1.60 | Y | 212361_s_at | AW190070 | ||
| ATXN1 | 2.02 | 1.95 | 2.08 | Y | 203231_s_at | AW235612 | ||
| ATXN1 | 1.86 | 1.87 | 1.86 | Y | 203232_s_at | NM_000332 | ||
| MYH6 | 2.76 | 2.74 | 2.78 | Y | 214468_at | D00943 | ||
| MYOM1 | 1.91 | 2.02 | 1.81 | Y | 205610_at | NM_003803 | ||
| MYOM2 | 2.36 | 2.36 | 2.36 | Y | 205826_at | NM_003970 | ||
| MYOT | 2.12 | 2.14 | 2.11 | Y | 219728_at | NM_006790 | ||
| MYOT | 10.61 | 10.59 | 10.64 | Y | 242795_at | AA180060 | ||
| HDAC4 | 2.30 | 2.09 | 2.65 | Y | Y | 1558385_at | AL832806 | |
| NCOA2 | 1.81 | 1.83 | 1.81 | Y | Y | 212867_at | AI040324 | |
| NFAT5 | 1.69 | 1.70 | 1.69 | Y | 224984_at | W61007 | ||
| NFAT5 | 1.94 | 1.87 | 2.01 | Y | 242371_x_at | AW974747 | ||
| PPP3CA | 1.70 | NS | 1.83 | Y | 202425_x_at | NM_000944 | ||
| PPP3CA | 1.62 | NS | 1.87 | Y | 202457_s_at | AA911231 | ||
| PPP3CA | 1.73 | 1.58 | 1.68 | Y | 229606_at | AI827550 | ||
| PPP3CA | 5.23 | 5.03 | 5.42 | Y | 236545_at | AA532718 | ||
| MEOX2 | 2.27 | 2.59 | NS | Y | 206201_s_at | NM_005924 | ||
| GTF2IRD1 | 2.71 | 2.72 | 2.70 | Y | 221176_x_at | NM_025042 | ||
NS, not significant; FDR, false discovery rate (median FDR; 90th percentile FDR); Y, yes.
Aberrant Splicing of MEF2A and MEF2C in Diseased Muscle
We designed assays to specifically interrogate differential isoform usage for known splice variants of all four MEF2 genes. The primers are detailed in Table S3 (Supplementary Material), and their positions within the gene are shown in Figure 1. In all, nine cassette exons, two alternative transcription start sites, and one alternative 3′ exon were interrogated using 16 primer pairs. For MEF2C, alternative cassette exons 4 and 5 showed differential usage between normal and all diseased muscle (P = 0.00068), between DM1/DM2 and normal (P = 0.00909), and between DM1/DM2 and all other disease muscle (P = 0.00021). Primary myoblast cultures and fetal muscle showed the same splicing pattern as diseased muscle. Assay design and results are shown in Figure 3. Similar, but less striking differences were seen for alternative exon 5 of MEF2A (Fig. 4). All diseased muscle differed from normal (P = 0.00077). DM1/DM2 alone differed from normal (P = 0.01212), whereas there was no significant difference between DM1/DM2 and the other neuromuscular diseases. None of the other assays for cassette exon usage showed a statistically significant difference between groups.
FIGURE 3.
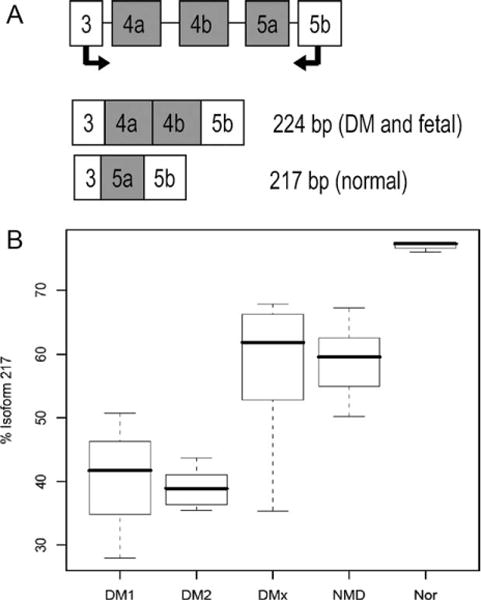
MEF2C assay 2. (A) Assay design showing intron–exon structure of the fragment assayed. The 217-bp isoform was the predominant isoform in normal samples, whereas the 224-bp isoform, predicted to contain exon 5a instead of exons 4a/4b, was predominant in DM and essentially the only isoform present in myoblasts and fetal muscle. (B) Boxplot generated by the Wilcoxon rank sum test for percentage of 217-bp isoform. Comparisons were as follows: all NMDs vs. N, P = 0.00068; DM1 and DM2 vs. N, P = 0.00909; DM1 and DM2 vs. other NMDs, P = 0.00021.
FIGURE 4.
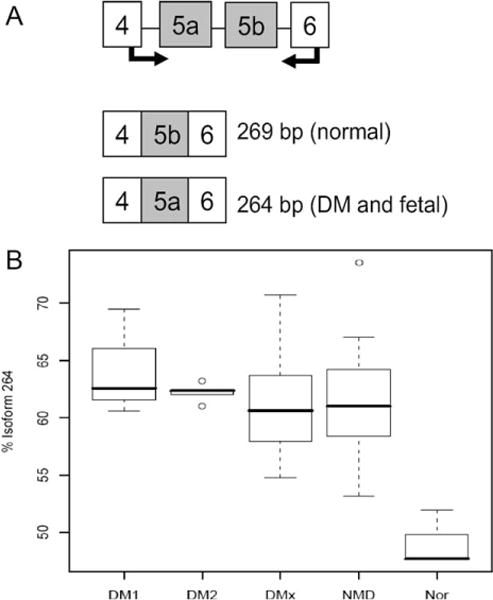
MEF2A assay 2. (A) Assay design showing the intron–exon structure of the fragment assayed. The 269-bp isoform was predominant in normal samples, whereas the 264-bp isoform, predicted to contain exon 5a instead of 5b, was predominant in DM skeletal muscle, myoblasts, and fetal muscle. (B) Boxplot generated by the Wilcoxon rank sum test for percentage of 264-bp isoform. Comparisons were as follows: all NMDs vs. N, P = 0.00077; DM1 and DM2 vs. N, P = 0.01212. However, there was no significant difference between DM1/DM2 and the other NMDs.
Use of Alternative 5′ and 3′ Exons
To evaluate the use of alternative 5′ exons in MEF2C and MEF2D, we designed assays in which the reverse primer was located in exon 2, whereas forward primers were located in each alternative exon 1. The total amount of PCR product from each reaction was used to calculate percent of total for each isoform. For MEF2B we investigated the alternative 3′ exons of isoforms 7 and 8 using a common forward primer anchored in exon 4 and reverse primers in each of the two alternative 3′ exons (Fig. 1). No assay for alternative 5′ and 3′ exon usage showed a statistically significant difference between any of the groups.
We found that MEF2A and MEF2C were upregulated in all diseased muscle, along with 12 genes with which they interact. These included five MEF2 targets (ATP2A2, MYH6, MYOM1, MYOM2, and MYOT), four MEF2 regulators (HDAC4, NCOA2, NFAT5, and PPP3CA), and three MEF2 binding partners (ATXN1, MEOX2, and GTF2IRD1). Pathway analysis revealed significant association of these 12 genes with calcium-signaling pathways. We found that preferential isoform usage in MEF2C and MEF2A was shifted toward an embryonic isoform pattern for exon 4/5 in all diseased muscle, both DM and non-DM. There was no significant difference in the preferential incorporation of other cassette exons or alternative 5′ or 3′ exons.
DISCUSSION
MEF2 genes are important regulators in myogenesis, cardiogenesis, and neurogenesis. Their multiplicity of isoforms allows for tissue specificity, complex temporal regulation, and subtle response to changing conditions. It has been established that the MADS/MEF2 domain, encoded by amino acids (aa) 1–86, is critical for DNA binding.4 However, little is known about the specific functions of the other protein domains and the specialized roles of the many alternatively spliced isoforms. Zhu and colleagues24 reported an acidic trans-activation domain in the carboxy terminus of the MEF2C protein that is included during myocyte differentiation and results in significantly more robust activity. One alternatively spliced exon that codes for MEF2C aa 271–278 has been shown to determine tissue specificity. Inclusion of this exon is seen in neurons, but never in muscle.5 A comprehensive study of MEF2C functional domains was conducted by Janson et al.25 using a series of deletion mutants. They found that preservation of the first alternatively spliced exon (aa 86–133) resulted in a 20% increase of transcriptional activity, although only one of the two alternates was tested. They concluded that this region has a subtle role in modulating gene expression. This is the same region of MEF2C that we have shown to be differentially included in fetal and diseased muscle and to be excluded in normal adult muscle. A similar region of MEF2A is also included in fetal and diseased muscle. It would be reasonable to predict that the use of this isoform increases the efficiency of MEF2A and MEF2C trans-activational activity during development and in response to injury or disease.
Slow-twitch (type 1) and fast-twitch (type 2) muscle fibers have different characteristics with respect to oxidative capacity, force production, resistance to fatigue, contraction time, and other key features.26 Transitions between the two fiber types can occur under a number of circumstances. Slow-to-fast fiber transitions can occur as a consequence of inactivity, which results in decreased motor nerve stimulation. Fast-to-slow transitions can occur as a result of extended periods of tonic motor nerve activity.27 Slow (type 1) fibers, although they produce less force, have enhanced resistance to fatigue. It has been shown that the functional activity of MEF2 transcription factors is stimulated by sustained periods of endurance exercise or motor nerve pacing28 and is dramatically enhanced in myotonic muscles.29 Therefore, one would predict that MEF2 factors would be upregulated in type 1 fibers, especially in myotonic muscles. Our observation of upregulation of MEF2A and MEF2C in DM skeletal muscle compared with normal is consistent with this prediction.
In the nucleus, nuclear factor of activated T-cell (NFAT) proteins bind DNA in conjunction with other transcriptional regulators, including MEF2. MEF2 binding sites are clustered in the promoter and enhancer regions of target genes that encode proteins of the slow-fiber program. In addition, activation of calcineurin in skeletal myocytes selectively upregulates slow-fiber–specific gene promoters.27 Along with upregulation of MEF2A and MEF2C, we also observed upregulation of NFAT5 and, especially, strong upregulation of calcineurin (PPP3CA) in all the neuromuscular disorders we studied. This observation leads us to predict that the slow fiber program should be activated in these muscles, but no such transitions have as yet been reported.
Xin is another MEF2 target gene.30 Xin encodes an actin binding protein whose mRNA is localized to the muscle satellite cell population and is robustly upregulated during muscle regeneration in response to injury. Thus, upregulation of the MEF2 genes may be a key step in a generalized response to muscle stress or injury, which results in repair or replacement of damaged cells from a satellite cell pool. In some diseases, such as DMD, the muscle satellite cell pool becomes depleted and muscles lose the capacity for repair.31 It has been suggested that a strategy to promote fast-to-slow transformation in DMD patients could reduce morbidity and prolong life.27 The upregulation of MEF2C along with increased use of the embryonic isoform, as seen in our samples, suggests that such repair processes are perhaps being initiated in these diseased muscles. In the case of DM1, where myotonia is a prominent feature, the myotonia itself could serve as the primary stimulus for MEF2 upregulation. What this stimulus might be in the non-myotonic neuromuscular disorders or in DM2, where myotonia is less severe or only an occasional feature, remains to be determined. In spite of upregulation of genes associated with these regenerative programs, fiber type switching has not been observed in any of these diseases. This suggests that the process may be blocked downstream of the initiation step.
In DM1 and DM2, it has been shown that expression of the mutant (CUG)n- or (CCUG)n-containing transcripts causes the failure of a splicing switch from embryonic to adult isoforms that normally occurs postnatally. Deficiency of MBNL1 protein reproduces this failure, preventing postnatal remodeling.19 Therefore, it has been repeatedly suggested that aberrant splicing of muscle-specific genes, such as TNNT3, RYR1, TTN, LDB3, or ATP2A1, is the primary effector of the muscle phenotype in DM.19,32,33 However, there are numerous examples of genes that revert to the fetal splicing pattern for remodeling under pathological conditions in many tissue types.34–39 Therefore, we would argue that abnormal splicing in DM, especially splicing that reverts to the embryonic isoform, is not due solely to the sequestration of MBNL1 by expanded mutant RNA, but that such splicing switches are also common mechanisms to restore and remodel damaged tissues.
Although some changes in expression and splicing patterns may be DM specific due to the expression of mutant (CUG)DM1/(CCUG)DM2 RNAs, others may be secondary to the loss of MBNL function. Mutations in other genes that cause neuromuscular disorders may also induce reversion to embryonic expression or splice patterns due to other mechanisms. However, distinguishing between these alternative mechanisms presents a challenge. Other investigators have explored this question using various mouse models. HSALR transgenic mice40 have been used in combination with Mbnl1 knockout41 and Clcn1adr mutant mice in gene expression and splicing experiments to determine which effects of (CUG)DM1 expression are due to the interaction of expanded (CUG)n with MBNL1 and which are a result of the myotonia.42 They concluded that most of the changes induced by (CUG)DM1 RNA in skeletal muscle can be attributed to reduced MBNL1 function. The pathway most affected comprised genes involved in calcium signaling and homeostasis. Similarly, Du and colleagues compared HSALR transgenic and Mbnl1 knockout mice to identify which aberrant splicing events and expression changes in their DM1 models were related to loss of MBNL1 function and which were MBNL1-independent.43 They found that only about half the expression changes, but over 80% of the aberrant splicing events, were MBNL1-dependent. They concluded that loss of MBNL1 function accounts for most of the splicing changes, but that (CTG)DM1/(CUG)DM1 expansion disrupts other functions as well, with undiscovered similarities to other muscular dystrophies. These findings are consistent with our conclusions indicating that some expression and alternative splicing changes in disease muscle are not directly related to the presence of mutant repeats. In the case of skeletal muscle, many of the changes observed in DM1 and DM2 may be shared with other neuromuscular disorders. Herein we have demonstrated such shared splicing changes for MEF2A and MEF2C, along with dysregulation of MEF2A and MEF2C and a number of MEF2-interacting genes, particularly those involved in calcium signaling.
Supplementary Material
Acknowledgments
M.B. was a scholar of the Friedrich-Alexander University Erlangen–Nuremberg/University of Texas M.D. Anderson Cancer Center Undergraduate Research Exchange Program and was supported by the University of Texas M.D. Anderson Cancer Center’s University Cancer Foundation. R.K. was supported by grants from the NIH (AR48171), Muscular Dystrophy Association USA, and the Kleberg Foundation. B.U. was supported by funding from the Folkhälsan Research Foundation, and grants from the Liv and Hälsa Foundation, the Vasa Central Hospital District medical research funds, and the Kung Gustav V Adolfs och Drottning Victorias Minnesfond Foundation. This study was accomplished through the active collaboration and sharing of patient samples within the European Neuromuscular Centre (ENMC) Consortium on DM2 and Other Myotonic Dystrophies by the following members: Josep Gamez, Jerry Mendell, Guillaume Bassez, Bruno Eymard, and Tetsuo Ashizawa. The authors are grateful to the participating patients for their cooperation. We also thank Valerie L. Neubauer and Tamara J. Nixon for expert assistance with the generation of microarray expression data and Tamer Ahmed for the RT-PCR.
Abbreviations
- aa
amino acids
- BMD
Becker muscular dystrophy
- DMD
Duchenne muscular dystrophy
- DM-like
idiopathic myotonic myopathy
- DM1
myotonic dystrophy type 1
- DM2
myotonic dystrophy type 2
- EMG
electromyography
- ENMC
European Neuro-Muscular Centre
- MC-AD
myotonia congenita—autosomal dominant
- MEF2
MADS-domain transcription enhancer factor 2 genes (MEF2A, MEF2B, MEF2C, and MEF2D)
- NFAT
nuclear factor of activated T cells
- NMD
neuromuscular disorder
- PCR
polymerase chain reaction
- RP-PCR
repeat primed polymerase chain reaction
- RT-PCR
reverse transcript–polymerase chain reaction
- TMD
tibial muscular dystrophy
References
- 1.Olson EN, Perry M, Schulz RA. Regulation of muscle differentiation by the MEF2 family of MADS box transcription factors. Dev Biol. 1995;172:2–14. doi: 10.1006/dbio.1995.0002. [DOI] [PubMed] [Google Scholar]
- 2.McKinsey TA, Zhang CL, Olson EN. MEF2: a calcium-dependent regulator of cell division, differentiation and death. Trends Biochem Sci. 2002;27:40–47. doi: 10.1016/s0968-0004(01)02031-x. [DOI] [PubMed] [Google Scholar]
- 3.Potthoff MJ, Olson EN. MEF2: a central regulator of diverse developmental programs. Development. 2007;134:4131–4140. doi: 10.1242/dev.008367. [DOI] [PubMed] [Google Scholar]
- 4.Black BL, Olson EN. Transcriptional control of muscle development by myocyte enhancer factor-2 (MEF2) proteins. Annu Rev Cell Dev Biol. 1998;14:167–196. doi: 10.1146/annurev.cellbio.14.1.167. [DOI] [PubMed] [Google Scholar]
- 5.Leifer D, Krainc D, Yu YT, McDermott J, Breitbart RE, Heng J, et al. MEF2C, a MADS/MEF2-family transcription factor expressed in a laminar distribution in cerebral cortex. Proc Natl Acad Sci USA. 1993;90:1546–1550. doi: 10.1073/pnas.90.4.1546. [DOI] [PMC free article] [PubMed] [Google Scholar]
- 6.Xu J, Gong NL, Bodi I, Aronow BJ, Backx PH, Molkentin JD. Myocyte enhancer factors 2A and 2C induce dilated cardiomyopathy in transgenic mice. J Biol Chem. 2006;281:9152–9162. doi: 10.1074/jbc.M510217200. [DOI] [PubMed] [Google Scholar]
- 7.Shul’man VA, Shnaider NA, Kozulina EA, But’ianov RA, Sviderskaia LA. Peculiarities of cardiac involvement in patients with dystrophic myotonia [in Russian] Kardiologiia. 2008;48:89–92. [PubMed] [Google Scholar]
- 8.Schara U, Schoser BG. Myotonic dystrophies type 1 and 2: a summary on current aspects. Semin Pediatr Neurol. 2006;13:71–79. doi: 10.1016/j.spen.2006.06.002. [DOI] [PubMed] [Google Scholar]
- 9.Harper PS. Myotonic dystrophy. London: W.B. Saunders; 2001. [Google Scholar]
- 10.Krahe R, Bachinski LL, Udd B. Myotonic dystrophy type 2: clinical and genetic aspects. In: Wells RD, Ashizawa T, editors. Genetic instabilities and neurological diseases. Academic Press/Elsevier; 2006. pp. 131–150. [Google Scholar]
- 11.Brook JD, McCurrach ME, Harley HG, Buckler AJ, Church D, Aburatani H, et al. Molecular basis of myotonic dystrophy: expansion of a trinucleotide (CTG) repeat at the 3′ end of a transcript encoding a protein kinase family member. Cell. 1992;68:799–808. doi: 10.1016/0092-8674(92)90154-5. [DOI] [PubMed] [Google Scholar]
- 12.Fu YH, Pizzuti A, Fenwick RG, Jr, King J, Rajnarayan S, Dunne PW, et al. An unstable triplet repeat in a gene related to myotonic muscular dystrophy. Science. 1992;255:1256–1258. doi: 10.1126/science.1546326. [DOI] [PubMed] [Google Scholar]
- 13.Mahadevan M, Tsilfidis C, Sabourin L, Shutler G, Amemiya C, Jansen G, et al. Myotonic dystrophy mutation: an unstable CTG repeat in the 3′ untranslated region of the gene. Science. 1992;255:1253–1255. doi: 10.1126/science.1546325. [DOI] [PubMed] [Google Scholar]
- 14.Liquori CL, Ricker K, Moseley ML, Jacobsen JF, Kress W, Naylor SL, et al. Myotonic dystrophy type 2 caused by a CCTG expansion in intron 1 of ZNF9. Science. 2001;293:864–867. doi: 10.1126/science.1062125. [DOI] [PubMed] [Google Scholar]
- 15.Groh WJ, Groh MR, Saha C, Kincaid JC, Simmons Z, Ciafaloni E, et al. Electrocardiographic abnormalities and sudden death in myotonic dystrophy type 1. N Engl J Med. 2008;358:2688–2697. doi: 10.1056/NEJMoa062800. [DOI] [PubMed] [Google Scholar]
- 16.Akar FG, Tomaselli GF. Conduction abnormalities in nonischemic dilated cardiomyopathy: basic mechanisms and arrhythmic consequences. Trends Cardiovasc Med. 2005;15:259–264. doi: 10.1016/j.tcm.2005.08.002. [DOI] [PubMed] [Google Scholar]
- 17.Carpenter S, Karpati G. Pathology of skeletal muscle. New York: Oxford University Press; 2001. [Google Scholar]
- 18.Vihola A, Bachinski LL, Sirito M, Olufemi SE, Hajibashi S, Baggerly KA, et al. Differences in aberrant expression and splicing of sarcomeric proteins in the myotonic dystrophies DM1 and DM2. Acta Neuropathol. 2010;119:465–479. doi: 10.1007/s00401-010-0637-6. [DOI] [PMC free article] [PubMed] [Google Scholar]
- 19.Lin X, Miller JW, Mankodi A, Kanadia RN, Yuan Y, Moxley RT, et al. Failure of MBNL1-dependent post-natal splicing transitions in myotonic dystrophy. Hum Mol Genet. 2006;15:2087–2097. doi: 10.1093/hmg/ddl132. [DOI] [PubMed] [Google Scholar]
- 20.Bachinski LL, Udd B, Meola G, Sansone V, Bassez G, Eymard B, et al. Confirmation of the type 2 myotonic dystrophy (CCTG)n expansion mutation in patients with proximal myotonic myopathy/proximal myotonic dystrophy of different European origins: a single shared haplotype indicates an ancestral founder effect. Am J Hum Genet. 2003;73:835–848. doi: 10.1086/378566. [DOI] [PMC free article] [PubMed] [Google Scholar]
- 21.Udd B, Meola G, Krahe R, Thornton C, Ranum LP, Bassez G, et al. 140th ENMC International Workshop: Myotonic dystrophy DM2/PROMM and other myotonic dystrophies with guidelines on management. Neuromuscul Disord. 2006;16:403–413. doi: 10.1016/j.nmd.2006.03.010. [DOI] [PubMed] [Google Scholar]
- 22.Cheung HC, Baggerly KA, Tsavachidis S, Bachinski LL, Neubauer VL, Nixon TJ, et al. Global analysis of aberrant pre-mRNA splicing in glioblastoma using exon expression arrays. BMC Genomics. 2008;9:216. doi: 10.1186/1471-2164-9-216. [DOI] [PMC free article] [PubMed] [Google Scholar]
- 23.Sallinen R, Vihola A, Bachinski LL, Huoponen K, Haapasalo H, Hackman P, et al. New methods for molecular diagnosis and demonstration of the (CCTG)n mutation in myotonic dystrophy type 2 (DM2) Neuromuscul Disord. 2004;14:274–283. doi: 10.1016/j.nmd.2004.01.002. [DOI] [PubMed] [Google Scholar]
- 24.Zhu B, Ramachandran B, Gulick T. Alternative pre-mRNA splicing governs expression of a conserved acidic transactivation domain in myocyte enhancer factor 2 factors of striated muscle and brain. J Biol Chem. 2005;280:28749–28760. doi: 10.1074/jbc.M502491200. [DOI] [PubMed] [Google Scholar]
- 25.Janson CG, Chen Y, Li Y, Leifer D. Functional regulatory regions of human transcription factor MEF2C. Brain Res Mol Brain Res. 2001;97:70–82. doi: 10.1016/s0169-328x(01)00187-5. [DOI] [PubMed] [Google Scholar]
- 26.Spangenburg EE, Booth FW. Molecular regulation of individual skeletal muscle fibre types. Acta Physiol Scand. 2003;178:413–424. doi: 10.1046/j.1365-201X.2003.01158.x. [DOI] [PubMed] [Google Scholar]
- 27.Chin ER, Olson EN, Richardson JA, Yang Q, Humphries C, Shelton JM, et al. A calcineurin-dependent transcriptional pathway controls skeletal muscle fiber type. Genes Dev. 1998;12:2499–2509. doi: 10.1101/gad.12.16.2499. [DOI] [PMC free article] [PubMed] [Google Scholar]
- 28.Wu H, Rothermel B, Kanatous S, Rosenberg P, Naya FJ, Shelton JM, et al. Activation of MEF2 by muscle activity is mediated through a calcineurin-dependent pathway. EMBO J. 2001;20:6414–6423. doi: 10.1093/emboj/20.22.6414. [DOI] [PMC free article] [PubMed] [Google Scholar]
- 29.Wu H, Olson EN. Activation of the MEF2 transcription factor in skeletal muscles from myotonic mice. J Clin Invest. 2002;109:1327–1333. doi: 10.1172/JCI15417. [DOI] [PMC free article] [PubMed] [Google Scholar]
- 30.Hawke TJ, Atkinson DJ, Kanatous SB, Van der Ven PF, Goetsch SC, Garry DJ. Xin, an actin binding protein, is expressed within muscle satellite cells and newly regenerated skeletal muscle fibers. Am J Physiol Cell Physiol. 2007;293:C1636–1644. doi: 10.1152/ajpcell.00124.2007. [DOI] [PubMed] [Google Scholar]
- 31.Peault B, Rudnicki M, Torrente Y, Cossu G, Tremblay JP, Partridge T, et al. Stem and progenitor cells in skeletal muscle development, maintenance, and therapy. Mol Ther. 2007;15:867–877. doi: 10.1038/mt.sj.6300145. [DOI] [PubMed] [Google Scholar]
- 32.Osborne RJ, Thornton CA. RNA-dominant diseases. Hum Mol Genet. 2006;15((Spec No)2):R162–R169. doi: 10.1093/hmg/ddl181. [DOI] [PubMed] [Google Scholar]
- 33.Wheeler TM, Thornton CA. Myotonic dystrophy: RNA-mediated muscle disease. Curr Opin Neurol. 2007;20:572–576. doi: 10.1097/WCO.0b013e3282ef6064. [DOI] [PubMed] [Google Scholar]
- 34.Tiwari S, Zhang Y, Heller J, Abernethy DR, Soldatov NM. Atherosclerosis-related molecular alteration of the human CaV1.2 calcium channel alpha1C subunit. Proc Natl Acad Sci USA. 2006;103:17024–17029. doi: 10.1073/pnas.0606539103. [DOI] [PMC free article] [PubMed] [Google Scholar]
- 35.Barnes JL, Torres ES, Mitchell RJ, Peters JH. Expression of alternatively spliced fibronectin variants during remodeling in proliferative glomerulonephritis. Am J Pathol. 1995;147:1361–1371. [PMC free article] [PubMed] [Google Scholar]
- 36.Gidh-Jain M, Huang B, Jain P, Battula V, el-Sherif N. Reemergence of the fetal pattern of L-type calcium channel gene expression in non infarcted myocardium during left ventricular remodeling. Biochem Biophys Res Commun. 1995;216:892–897. doi: 10.1006/bbrc.1995.2705. [DOI] [PubMed] [Google Scholar]
- 37.Huang B, El-Sherif T, Gidh-Jain M, Qin D, El-Sherif N. Alterations of sodium channel kinetics and gene expression in the postinfarction remodeled myocardium. J Cardiovasc Electrophysiol. 2001;12:218–225. doi: 10.1046/j.1540-8167.2001.00218.x. [DOI] [PubMed] [Google Scholar]
- 38.Karosi T, Szalmas A, Csomor P, Konya J, Petko M, Sziklai I. Disease-associated novel CD46 splicing variants and pathologic bone remodeling in otosclerosis. Laryngoscope. 2008;29:1043–1044. doi: 10.1097/MLG.0b013e31817c133d. [DOI] [PubMed] [Google Scholar]
- 39.Keller KE, Kelley MJ, Acott TS. Extracellular matrix gene alternative splicing by trabecular meshwork cells in response to mechanical stretching. Invest Ophthalmol Vis Sci. 2007;48:1164–1172. doi: 10.1167/iovs.06-0875. [DOI] [PubMed] [Google Scholar]
- 40.Mankodi A, Logigian E, Callahan L, McClain C, White R, Henderson D, et al. Myotonic dystrophy in transgenic mice expressing an expanded CUG repeat. Science. 2000;289:1769–1773. doi: 10.1126/science.289.5485.1769. [DOI] [PubMed] [Google Scholar]
- 41.Kanadia RN, Johnstone KA, Mankodi A, Lungu C, Thornton CA, Esson D, et al. A muscleblind knockout model for myotonic dystrophy. Science. 2003;302:1978–1980. doi: 10.1126/science.1088583. [DOI] [PubMed] [Google Scholar]
- 42.Osborne RJ, Lin X, Welle S, Sobczak K, O’Rourke JR, Swanson MS, et al. Transcriptional and post-transcriptional impact of toxic RNA in myotonic dystrophy. Hum Mol Genet. 2009;18:1471–1481. doi: 10.1093/hmg/ddp058. [DOI] [PMC free article] [PubMed] [Google Scholar]
- 43.Du H, Cline MS, Osborne RJ, Tuttle DL, Clark TA, Donohue JP, et al. Aberrant alternative splicing and extracellular matrix gene expression in mouse models of myotonic dystrophy. Nat Struct Mol Biol. 17:187–193. doi: 10.1038/nsmb.1720. [DOI] [PMC free article] [PubMed] [Google Scholar]
Associated Data
This section collects any data citations, data availability statements, or supplementary materials included in this article.