Abstract
Zero-echo Time (ZTE) imaging is a promising technique for magnetic resonance imaging (MRI) of short-T2 tissue nuclei in tissues. A problem inherent to the method currently hindering its translation to the clinic is the presence of a spatial encoding gradient during excitation, which causes the hard pulse to become spatially selective, resulting in blurring and shadow artifacts in the image. While shortening radiofrequency (RF) pulse duration alleviates this problem the resulting elevated RF peak power and specific absorption rate (SAR) in practice impede such a solution. In this work, an approach is described to correct the artifacts by applying quadratic phase-modulated RF excitation and iteratively solving an inverse problem formulated from the signal model of ZTE imaging. A simple pulse sequence is also developed to measure the excitation profile of the RF pulse. Results from simulations, phantom and in vivo studies, demonstrate the effectiveness of the method in correcting image artifacts caused by inhomogeneous excitation. The proposed method may contribute toward establishing ZTE MRI as a routine 3D pulse sequence for imaging protons and other nuclei with quasi solid-state behavior on clinical scanners.
Index Terms: Excitation profile, inverse problem, image reconstruction, quadratic phase pulse, short T2 imaging, ultra-short echo time, zero echo time
I. Introduction
Mri detection and quantification of short-T2 species in the human body is of considerable clinical and scientific importance [1]. Exemplary tissue constituents of interest with short T2 ranging from tens to hundreds of microseconds are myelin in white matter [2], cortical bone water [3, 4], lung tissue [5], sodium in brain and connective tissues [6] and phosphorus in bone mineral [7, 8]. Advances in MRI technology and hardware have enabled development of a number of short-T2 imaging techniques, key among which are ultra-short echo time (UTE) imaging [9], zero echo time (ZTE) imaging [10–13], and sweep imaging with Fourier transform (SWIFT) [14].
The unique feature of ZTE imaging is the presence of the spatial encoding gradient during non-selective excitation. The sequence variants currently in practice include SPRITE (single-point ramped imaging with T1 enhancement) [10], WASPI (water- and fat-suppressed proton projection MRI) [11] and PETRA (pointwise encoding time reduction with radial acquisition) [13]. Compared to UTE, ZTE traverses k-space faster, resulting in higher SNR and reduced blurring due to less T2 decay within the data acquisition window [15]. Since data sampling occurs during the plateau period of the readout gradient in ZTE, the image distortion artifact associated with ramp sampling in UTE imaging is avoided.
However, problems can arise in ZTE due to the imaging gradient being on during hard pulse excitation. First, the central portion of k-space is missed resulting from the time delay between the end of RF transmission and the start of data acquisition. Several approaches have been proposed to solve this problem, including algebraic reconstruction [12, 16], acquisition of additional radial projections with lower gradient strength as in WASPI [11], and single point imaging as in PETRA [13] following the radial encoding portion of the sequence.
Another well-known problem resulting from the presence of the imaging gradient is that the hard pulse becomes spatially selective. In the low flip-angle regime, the excitation profile of the hard pulse as a function of frequency is sinc-shaped as given by the Fourier transform of a rectangular waveform. The problem is negligible on laboratory imaging systems allowing for high peak power and thus very short pulse duration. However, B1 peak power and SAR limitations impose practical limits for in vivo scanning of humans [17]. As elaborated upon in the following section, both blurring and shadow artifacts near the object’s boundary can arise in the reconstructed image without correction of the spatially dependent excitation profile.
Recently, Grodzki et al. investigated the effects of the sinc-shaped excitation profile in PETRA and proposed an approach to correct for the resulting image artifacts [18]. However, their correction algorithm requires that the imaged object fit into the sphere defined by the main lobe of the sinc-shaped excitation profile. If these conditions are not met the amplified noise resulting from inversion of the ill-conditioned matrix rooted from the zero crossings of the sinc function would corrupt the resulting image. Thus, the problem of spatially dependent excitation in ZTE imaging of humans in clinical scanners has yet to be solved.
In this work, we model the ZTE sequence signal to include the excitation profile effect, and formulate a correction algorithm as a solution to an inverse problem. In order to eliminate the zero crossings in the sinc excitation profile and to condition the inverse problem, we propose to modulate the hard RF pulse with quadratic phase, which produces a flatter excitation profile. A simple pulse sequence is also developed to measure the excitation profile of the RF pulse. Without loss of generality, we apply our method to one variant of ZTE imaging sequences, namely PETRA. By combining phase-modulated RF excitation and iteratively solving the inverse problem, results from simulations, phantom and in vivo studies demonstrate the effectiveness of our method for correcting image artifacts caused by inhomogeneous excitation, even when the extent of the imaged object exceeds the main lobe of the sinc function.
The paper is organized as follows. In Section II, we introduce the signal model of ZTE imaging and analyze the resulting artifacts. In Section III, we describe an algorithm to correct the image artifacts by means of excitation with a quadratic phase-modulated RF pulse and iteratively solving an inverse problem formulated from the signal model of ZTE imaging. Also described in this Section is a pulse sequence for measuring the excitation profile of the RF pulse. The remainder follows with Methods (Section IV) and Results (Section V) demonstrating the effectiveness of the new method with simulated and experimental data.
II. Signal Model Of ZTE Imaging
In standard MRI, the signal model is given by:
| (1) |
where s(k) is the complex signal at the spatial frequency-space (k-space) location k, m(r) denotes the spatial distribution of the imaged object’s transverse magnetization at spatial coordinate r, <G,r> denotes the vector inner product, and ε is additive complex Gaussian noise. The k-space location k at a particular point in time depends on the sampling pattern of the pulse sequence. For example, for PETRA, as shown in Fig. 1, the k-space sampling is divided into two parts: the outside portion is acquired with radial trajectories, while the center is filled on a Cartesian grid by single point imaging [13].
Fig. 1.
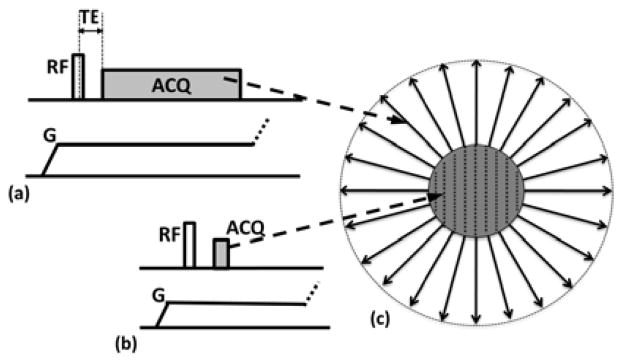
Pulse sequence diagram of PETRA, consisting of, a) radial acquisition, b) Cartesian portion. The latter uses single point encoding to fill the missing k-space points; c) corresponding k-space trajectory [13].
As pointed out above, the presence of the spatial encoding gradient during RF pulse excitation makes the non-selective pulse in ZTE frequency selective. As a result, an excitation profile is superimposed onto m(r):
| (2) |
For a given RF pulse waveform, p(f) is the excitation profile expressed as a function of resonance frequency f which is given by f = γ<G, r>, with γ being the gyromagnetic ratio and G the imaging gradient. The goal is to reconstruct m(r). In conventional image reconstruction a uniform excitation profile p(f) is assumed. A gridding algorithm is usually employed to accomplish image reconstruction [19].
However, in practice p(f) is not homogeneous due to the finite pulse duration imposed by the peak RF power and SAR constraints (particularly restrictive with clinical imaging hardware). The profile must therefore be included in the image reconstruction in order to avoid artifacts that would degrade image quality. A rectangular hard pulse is typically used for excitation in ZTE:
| (3) |
where τ is the pulse duration, and the reference time of the hard pulse is at the center of the pulse, i.e. the k-space center. The pulse amplitude b1 is determined by the desired flip angle θ and the pulse duration τ according to θ = 2πγb1 τ.
Based on the small-tip-angle approximation theory, which is valid for flip angles less than 30 degrees [20, 30], the excitation profile p(f) is calculated as the Fourier transform of rectangular hard RF pulse waveform:
| (4) |
Substituting f = γ<G, r> into Eq.4:
| (5) |
we see that the excitation profile is a function of both the imaging gradient and the spatial location thereby resulting in image artifacts. During acquisition of the outer (i.e. radial) portion in PETRA, the imaging gradient amplitude |G| is kept constant for each projection. As r increases from the center to the edge of the field-of-view (FOV), p(G, r) decreases and signal variation is introduced across the FOV causing a shadow artifact at the object’s boundary. We note that the artifacts are less severe in the center FOV region because of smaller r, and in fact the FOV center should be relatively free of artifacts. On the other hand, in the central Cartesian portion of k-space, a lower gradient amplitude |G| is used, resulting in higher p(G, r) values. From a signal processing perspective, p(G, r) acts like low spatial frequency filter and the reconstructed image without correction suffers from blurring.
The severity of the image artifacts depends on the relative length of the pulse duration τ compared to the readout sampling time gap d (termed dwell time). To see this, the maximum distance from the FOV center, rmax, is given by:
| (6) |
Inserting Eq.6 into Eq.5, we obtain the profile at the FOV boundary:
| (7) |
As is evident from Eq.7, the excitation profile is relatively uniform and no image as long as the pulse duration τ is much shorter than the dwell time d, in which case no artifacts are apparent. However, for longer pulse durations, the profile becomes increasingly heterogeneous and image artifacts become noticeable. In practical imaging experiments, a typical value of d is 5 μs, therefore the pulse duration should be less than 5 μs in order to make the image artifacts negligible. In practice, this condition is difficult to achieve as the B1 peak power to allow a desired flip angle may exceed SAR limits when scanning humans.
III. Proposed Algorithm For Excitation Profile Correction
A. Model as an Inverse Problem
In order to eliminate image artifacts, the effect of the non-uniform excitation profile needs to be considered in image reconstruction. The discretization of Eq.2 yields
| (8) |
where N is the number of pixels of the reconstructed image, and M is the number of k-space samples. In matrix form, Eq.8 becomes:
| (9) |
where A is the system matrix with its elements Ai,j = p (Gj, ri)e−i2π<kj,ri.
Image reconstruction can now be formulated as an optimization problem with an optional regularization term. As pointed out in [21], a small total variation (TV) regularization term is helpful to alleviate the streaking artifact in radial imaging. The final form of the reconstruction problem can be written as:
| (10) |
where D is the finite difference operator. ||·||1 denotes the vector’s L1-norm and λ is the regularization parameter. Several algorithms can be used to solve Eq.10, among which the Split-Bregman method (or Augmented Lagrangian method) [22] has been proven to be efficient. During the iteration, a Conjugate Gradient algorithm is employed as a subroutine to solve a quadratic optimization problem, in which the matrix-vector multiplication is the most computationally intensive (~O(N2)). For example, assuming the reconstructed image matrix size (or N) is 1283, each matrix-vector multiplication takes O(1286)~O(1012) computations. Therefore, the enormous size of the system matrix A prevents explicit matrix-vector multiplication during the iterations.
Instead, the matrix-vector multiplication is implicitly computed as a series of operators on a vector. Here we define s as the coordinate along the imaging gradient direction. According to the central slice theorem, the k-space signal along the gradient direction in Eq.2 is rewritten as:
| (11) |
where
 denotes the Radon transform. The noise term is dropped for simplicity. Noting that s = <G, r>, p is a function of s and thus can be moved out of the Radon transform:
| (12) |
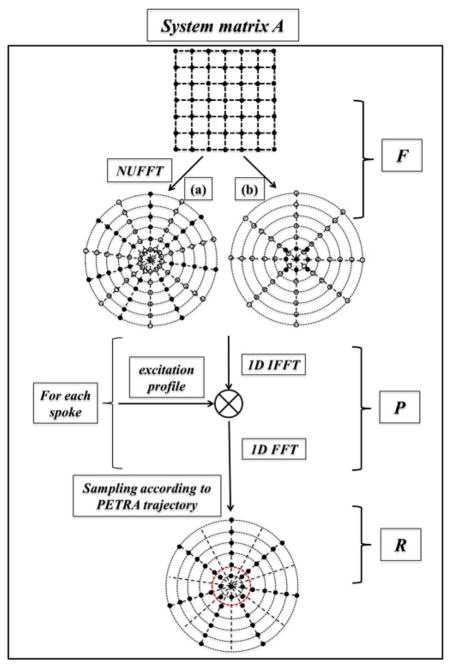
Therefore, the k-space signal of each projection in ZTE imaging can be interpreted as the 1D Fourier transform of the Radon transform of the magnetization modulated by the excitation profile. The Radon transform can be approximated by the non-uniform fast Fourier transform (NUFFT) [23] with sufficient accuracy and fast computation, which reduces to ~O(NlogN) per the matrix-vector multiplication. From Eq.12, the system matrix is decomposed into three operators:
| (13) |
where F is the NUFFT operator that maps the (Cartesian) image to k-space (full) radial spokes, with one spoke for each radial trajectory, and additionally one spoke for each Cartesian point. The P operator acts on each projection separately by zero-padding (by a factor of 2), 1D IFFT, multiplication with the excitation profile, 1D FFT, and finally restoration of the original vector length. The sampling operator, denoted R, masks out the fraction of the radial signal that was not acquired (recall that less than half of each radial spoke is acquired) and performs Dirichlet interpolation in the Cartesian portion (since the coordinates of the single points may not coincide with those in the radial spokes) [24]. Application of the operator F is the most time-consuming process, requiring ~O(NlogN) computations. The adjoint operator AH is the reverse process of the above steps. A flow chart describing the algorithm is shown in Fig. 2. The image reconstruction algorithm was implemented in Matlab (Mathworks, Natick, MA, USA) with NUFFT algorithm as a mex function written in C.
Fig. 2.
Diagram of the implementation of the system matrix A, composed of three sequential operators: the NUFFT operator F, the excitation profile modulation operator P and the sampling operator R. The solid dots in a) and b) represent the acquired samples in k-space and the hollow circles denote the locations which are interpolated by NUFFT but not acquired by the sequence.
B. Quadratic Phase-Modulated Hard RF Pulse
As shown in Eq.7, when the RF pulse duration is twice the dwell time, the profile’s zero crossings are within the FOV, causing the system matrix A to be singular and the inverse problem to be ill conditioned. In order to eliminate the zero crossings of the rectangular pulse excitation profile, a quadratic phase is modulated to the RF pulse waveform:
| (14) |
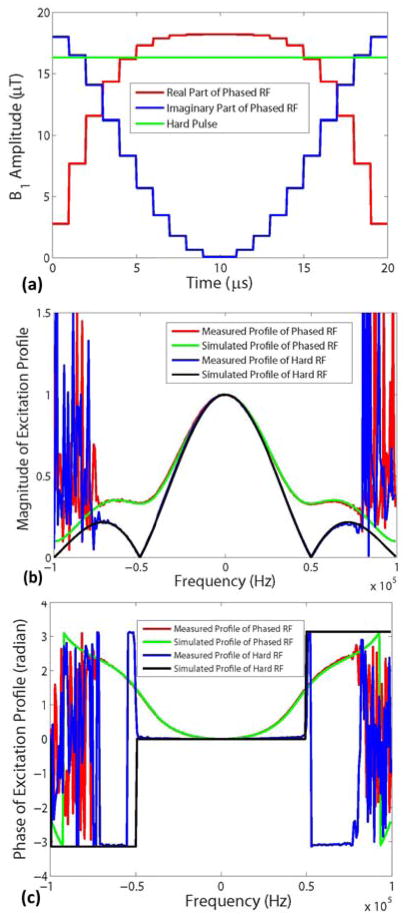
where β controls the amount of quadratic phase applied to the RF pulse. In all of the following applications, β is set to 1. The corresponding excitation profile can be computed by numerical Bloch equation simulation. The quadratic phase-modulated pulse has a flatter excitation profile than does a simple hard pulse. More importantly, no zero-crossing point occurs in the profile even when the pulse duration is four times that of the dwell time (see Fig. 4).
Fig. 4.
a) Waveforms of hard and quadratic phase-modulated RF pulses with 20 μs duration and flip angle of 5°; b) Magnitude and c) the phase of the excitation profiles of both pulses obtained by Bloch equation simulations and measurements with the pulse sequence in Fig. 3 with dwell time of 5 μs. The experimental data are in good agreement with simulations. The noisy oscillations in b) and c) occur in the region outside the imaged object.
C. Excitation Profile Measurement
In order to confirm that we indeed achieve the theoretical excitation profile, we propose a simple pulse sequence for its measurement, which can be inserted as a pre-scan into the ZTE sequence. A sketch of this pulse sequence is shown in Figure 4(a, b). Suppose the signals acquired by the first and second acquisitions are S1 and S2, respectively. The excitation profile p(f) is calculated as:
| (15) |
A flow diagram illustrating the data acquisition and processing procedures is shown in Fig. 3.
Fig. 3.
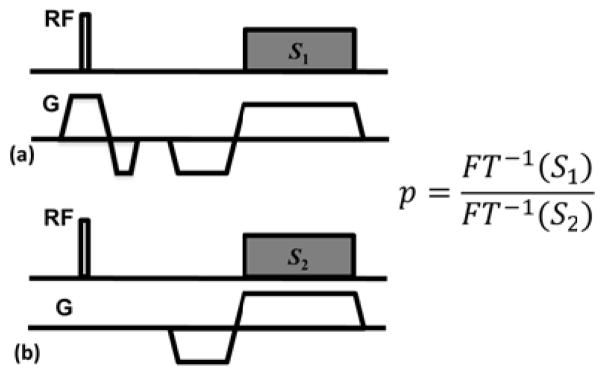
Pulse sequence diagram for RF pulse excitation profile measurement. The signals from acquisitions a) and b) are first transformed into image space by inverse Fourier transform, generating projections with and without modulation excitation profile. The profile is then obtained by taking ratio between the projections.
IV. Methods
A. Simulations
A 2D Shepp-Logan phantom was used to generate the simulated data by applying the operators described in Eq.13. The excitation profile effects of both the rectangular and quadratic phase-modulated RF pulse were simulated. The pulse duration τ was varied from one to four times the dwell time d of 5 μs. Other parameters of the sequence used in the simulation were: T/R switch dead time = 70 μs, 300 half radial projections, and reconstructed image matrix size = 128×128. Complex Gaussian noise was then added to the simulated k-space data, yielding SNR ~50. The images were reconstructed with and without the correction algorithm from the simulated noisy k-space data.
B. Experiments
A doped-water phantom was imaged at 3T (SIEMENS Tim Trio, Erlangen, Germany) using the PETRA sequence with a four-channel receive-only head coil and body coil RF transmission and the following scan parameters: 1.30 mm isotropic voxel size, matrix size = 1923, number of half-projections = 30,000, flip angle = 6°, TE = 100 μs, TR =10 ms. To investigate the effect of inhomogeneous excitation profile a series of scans were performed with dwell times of 5, 10 and 20 μs while fixing the pulse duration at 20 μs. The excitation profiles of both rectangular (Eq.3) and phase-modulated (Eq.14) RF pulses were measured by the proposed pulse sequence and compared with those obtained by Bloch equation simulations. A product spoiled gradient-echo (GRE) sequence with TE of 2.5 ms was also run with the same image resolution for comparison.
The head of a 40 year-old healthy male volunteer was scanned with the PETRA sequence with the same coil as previously used in the phantom experiments. The protocol for this study was approved by the Institutional Review Board and written informed consent was obtained from the subject. Scan parameters were: 1.17 mm isotropic voxel size, matrix size = 2563, number of half-projections = 50,000, flip angle = 5°, TE = 85 μs, TR = 10 ms, readout bandwidth = ±62.5 kHz (corresponding to 5 μs dwell time). Both rectangular and phase-modulated excitation pulses were used as excitation pulses with 20 μs duration. Images from a GRE sequence with TE of 2.5 ms obtained at the same image resolution were used for comparison.
To ensure that all reconstructions were performed under identical conditions, we used the same regularization parameter λ = 0.0001 after automatically scaling the raw data for consistency. While it is possible that the image quality could be improved slightly with a different choice of the total variation weight, this type of optimization is beyond the scope of the present analysis. We note that k-space was not significantly undersampled, and therefore modest L1 regularization is not expected to appreciably impact image quality. For the sake of simplicity, the multiple-coil data are treated separately. All images were first reconstructed channel-by-channel and then combined as square root of the sum of squares (SoS).
V. Results
A. Excitation Profile Measurement
The rectangular and quadratic phase-modulated pulse waveforms with 20 μs duration are shown in Fig. 4a. Figs. 4b, c compare the magnitude and phase of the excitation profiles of both RF pulses as a function of frequency, obtained by numerical Bloch equation simulations, with measurements by the proposed pulse sequence, respectively. The simulation results are in good agreement with those obtained experimentally. As seen from Fig. 4b, the phase-modulated pulse eliminates the zero crossings in the sinc-shaped profile of the hard pulse excitation, which improves the condition number of the system matrix of the inverse problem.
B. Simulations
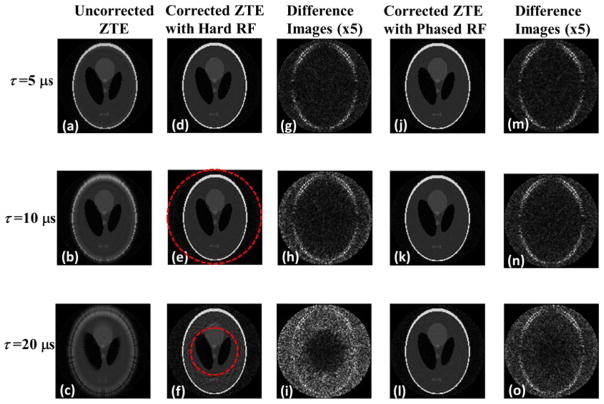
The simulated uncorrected images with varying pulse durations and constant dwell time are shown in Figs. 5a–c. Figs. 5d–f and j–l shows the corresponding corrected images with hard and phase-modulated pulse excitation, respectively, along with the difference images from the true image in Figs. 5g–i and m–o. No visible artifacts are present in the uncorrected image (Fig. 5a) with the same pulse duration and dwell time since the excitation bandwidth covers the spin resonance frequencies created by the spatial encoding gradient and the excitation profile inside the phantom is relatively uniform. However, as the pulse duration increases, the excitation bandwidth becomes narrower, resulting in a less homogeneous excitation profile and a more severe image artifact, as predicted by the theoretical analysis. The corrected images with hard pulse excitation eliminate the artifacts within the main lobe of the sinc-shaped profile, indicated by the dashed circle. However, residual artifacts are visible in the region outside the circle (Fig. 5f) since the spins in this area resonate at frequencies where the excitation profile is close to zero. The reconstructed images with phase-modulated pulse excitation in Figs. 5j–l effectively correct the artifacts even in the region outside the first zero crossing of the sinc function.
Fig. 5.
Simulated 2D phantom images with various pulse durations and constant dwell time of 5 μs. As the pulse duration increases image artifacts become more severe in the uncorrected image (a–c). The proposed algorithm and hard pulse excitation (d–f) removes the artifacts inside the sinc main lobe indicated by the dashed circle. However, residual artifacts are still visible outside the circle (f), which is also evident in the difference images (g–i). Combination of our algorithm and quadratic-phase modulated pulse effectively correct the artifact even when the pulse duration is four times of dwell time (j–o).
C. Experiments
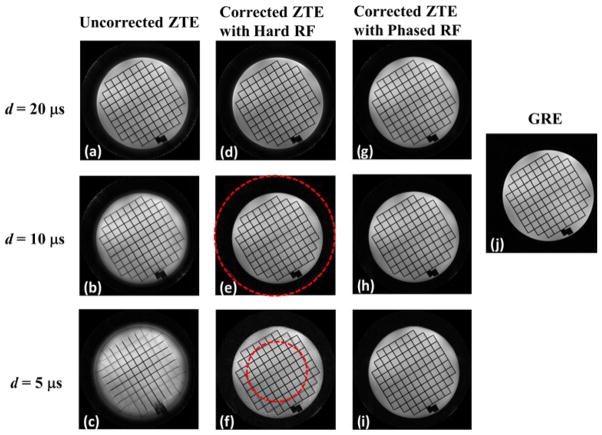
Similar results as simulations are observed in phantom images with different dwell times in Figs. 6. As the dwell time gets shorter, the blurring and shadow artifacts become more apparent. The algorithm presented based on quadratic phase-modulated pulse excitation successfully removes the image artifacts in all cases and the images compare favorably with the reference gradient-echo image (Fig. 6j).
Fig. 6.
Axial ZTE phantom images obtained with constant pulse duration but varying dwell time. As the dwell time gets shorter, blurring and shadow artifacts become more apparent in (a–c). Although artifacts in images with hard pulse excitation are corrected inside the main lobe of the sinc-shaped excitation profile indicated by the dashed circle, the outside region still suffers from artifacts (d–f). The new algorithm, along with phase-modulated RF pulse excitation (g–i) removes the artifacts
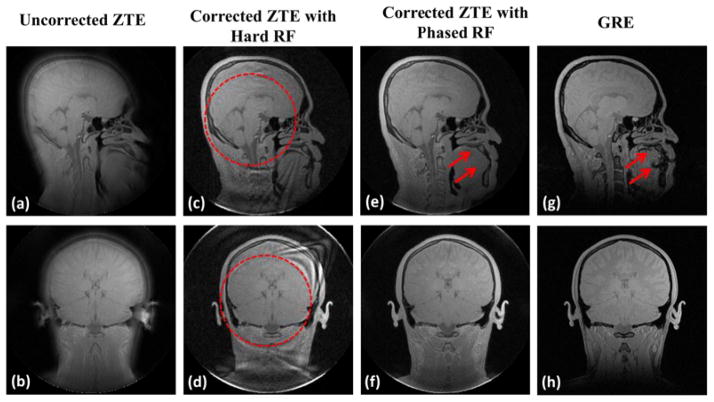
Fig. 7 compares in vivo ZTE brain images on the sagittal and coronal planes with and without correction, along with images from a reference GRE sequence. The dashed circles in the second column images (Figs. c&d) indicate the locations of the zero crossing of sinc-shaped profile with hard pulse excitation. While no residual artifact appears in the regions inside these circles, the noise amplification due to the inversion of a singular system matrix creates artifacts in the corrected images with hard pulse excitation. In contrast, the artifacts are effectively corrected with quadratic-phase pulse excitation yielding image quality comparable to the GRE sequence. Lastly, we note that the ZTE images are free from the susceptibility artifact due to the air-tissue interface in GRE images as indicated by the arrows in Fig. 7g.
Fig. 7.
In vivo ZTE brain images with 20 μs pulse duration and 5 μs dwell time showing the sagittal and coronal planes. Results are in good agreement with those from simulations and phantom experiments. We note that the ZTE images corresponding to TE = 85 μs eliminate the susceptibility artifact due to the air-tissue interface noticeable in GRE images (TE = 2.5 ms) as indicated by arrows (g).
VI. Discussion
In ZTE imaging, the presence of the spatial encoding gradient during non-selective RF excitation offers advantages over UTE imaging in terms of faster k-space traversal and elimination of artifact from ramp sampling. However, the imaging gradient also causes a non-uniform excitation profile across the FOV. Therefore, as pointed out in [18] and section III, the measured ZTE signal turns out to be the Fourier transform of the Radon transform of the magnetization modulated by the excitation profile according to the central slice theorem. As a result, blurring and shadow artifacts appear in the uncorrected images. Although extremely short RF pulse durations compared to the dwell time can be used to alleviate such artifacts, high peak power is needed to achieve the optimal Ernst angle and SAR could be an issue for human scans. Also higher power RF transmission requires a stronger RF amplifier and a dedicated transmit coil. In [18], the effect of the inhomogeneous excitation profile was simulated and an algorithm was proposed to correct the artifacts. This algorithm works under the condition that the object is inside the main lobe of the sinc-shaped excitation profile of the rectangular pulse. However, once this condition is violated, the elevated noise level corrupts the reconstructed image.
Here we have presented an effective algorithm for correcting the artifacts in ZTE imaging within the limits of current clinical scanner hardware and SAR constraints without any modification of coil hardware, and more importantly, allowing the imaged object to extend beyond the main lobe of the hard pulse excitation profile. The proposed method is readily adapted to other ZTE sequences, e.g. SPRITE [10], WASPI [11].
There are several innovations in our method. First, the signal model in ZTE imaging was derived to include the effect of non-uniform excitation profile, from which the origins of the artifacts can be analyzed. An inverse problem was formulated from the signal model. By taking advantage of the central slice theorem and computationally efficient NUFFT, an iterative algorithm was designed and implemented to solve the inverse problem with an optional regularization term. Since the noise effect is included in our correction algorithm, the reconstructed image quality is superior to the corrected images shown in [18].
Second, a quadratic phase-modulated rectangular (chirped) pulse was designed for excitation instead. As shown in both simulations and experiments, the corrected image with hard RF pulse excitation shows residual artifact outside the spherical region defined by the main lobe of the sinc-shaped profile. This is because the null points in the excitation profile cause the system matrix to be singular and make the inverse problem ill-conditioned. When a quadratic phase modulation is applied to the RF pulse, the excitation profile becomes flatter and lacks a null point, as shown in the Bloch equation simulation results. This improved excitation profile can be understood as a type of regularization to physically reduce the condition number of the inverse problem. The sinc-shaped hard pulse excitation profile is pure real. As a way to remove the null point, an imaginary part is added into the profile to make it complex. Hence the magnitude of the profile is no longer singular. The improvement in the reconstructed images is evident. The amount of phase modulation applied to the RF pulse constitutes a trade-off between the flip angle and the minimum value of the absolute magnetization profile within the field of view. Application of too much phase yields low flip angle for a given peak B1 amplitude and pulse duration. On the other hand, inadequate quadratic phase causes the magnetization profile to approach a sinc profile, and the noise will be amplified due to a close-to-singular system matrix. Here, we chose a relatively small amount of quadratic phase in order achieve minimal flip-angle loss while maintaining a relatively flat excitation profile.
Third, a pulse sequence was proposed to measure the excitation profile. In [18], the profile was obtained by measuring the actual pulse shape with an oscilloscope followed by taking the Fourier transform of the pulse shape. Our approach does not require additional hardware and can be inserted as an optional component into the ZTE pulse sequence. The spectral profile measured by the new sequence shows good agreement with that obtained from the Bloch equation simulation. Therefore, we conclude that the profile from the numerical simulation is sufficiently accurate as an input for the correction algorithm.
As pointed out in [17], a general drawback of ZTE imaging in humans is the need for high power RF transmission with large-bandwidth excitation and the associated increase in SAR. With the proposed approach, ZTE imaging operated at lower peak power, longer pulse duration, larger flip angle or higher readout bandwidth becomes practical on clinical imagers, thus providing new opportunities for short-T2 imaging. While the majority of short-T2 imaging reported so far in the literature [1–3] has been by UTE MRI, there is both theoretical and experimental evidence that ZTE achieves superior SNR [7, 25]. The need for prolonged RF pulses is particularly stringent when the method is combined with soft-tissue suppression preparation pulses. In order to optimize short-T2 contrast, inversion recovery (IR)-based long-T2 suppression is usually employed to highlight short-T2 tissue components [26, 27]. However, the optimal excitation flip angle of IR-based sequences is close to 90 degrees, therefore, requiring relatively long RF pulses to achieve the desired flip angle that optimizes SNR of the short-T2 tissue without incurring image artifacts. Lastly, the proposed method allows for higher readout bandwidth thus shortening sampling time, which in turn reduces blurring due to T2 decay within the acquisition window [15].
Besides its capability to image extremely short-T2 species, ZTE imaging has also been shown to have potential applications in routine clinical scans due to its low acoustic noise from smoothly varying gradients that reduce the slew rate requirements [17]. Therefore, the proposed method may be helpful to broaden the clinical utility of the ZTE imaging sequence.
Currently, the running time of our algorithm to reconstruct a 2563 image matrix is on the order of 3–4 hours on a PC with 3.16 GHz Intel Xeon CPU and 16 GB RAM. However, the computation of the operators in the system matrix is highly parallelizable, which we project to significantly accelerate reconstruction speed (our implementation used a single processing thread). GPU implementation of the NUFFT operator has shown more than two orders of magnitude acceleration [28, 29]. The P operator processes each projection independently and can be parallelized trivially. Devising an accelerated version of our algorithm will be investigated in future work. Another minor limitation is that the B1 peak power increases ~10% for a phase-modulated pulse to achieve the same flip angle as the hard pulse, which is a slight trade-off in return for the significant improvement in image quality.
VII. Conclusion
In conclusion, an effective approach integrating quadratic-phase modulated RF excitation and iterative reconstruction for correcting artifacts caused by the heterogeneous excitation in ZTE imaging is presented. The new method has potential to establish ZTE imaging as a routine pulse sequence for visualization and quantification of short-T2 tissue constituents.
Acknowledgments
This work was supported by NIH grants RO1-AR50068, R21-NS082953, K25-EB007646, F31- AG042289. C. Li is a Howard Hughes Medical Institute (HHMI) International Student Research Fellow.
Contributor Information
Cheng Li, Email: licheng6@seas.upenn.edu, Laboratory for Structural NMR Imaging (LSNI), Department of Radiology, Department of Bioengineering, University of Pennsylvania, 1 Founders Pavilion, 3400 Spruce Street, Philadelphia, PA 19104 USA.
Jeremy F. Magland, Email: jeremy.magland@gmail.com, Laboratory for Structural NMR Imaging (LSNI), Department of Radiology, University of Pennsylvania, 1 Founders Pavilion, 3400 Spruce Street, Philadelphia, PA 19104 USA
Alan C. Seifert, Email: aseifert@seas.upenn.edu, Laboratory for Structural NMR Imaging (LSNI), Department of Radiology, Department of Bioengineering, University of Pennsylvania, 1 Founders Pavilion, 3400 Spruce Street, Philadelphia, PA 19104 USA
Felix W. Wehrli, Email: wehrli@mail.med.upenn.edu, Laboratory for Structural NMR Imaging (LSNI), Department of Radiology, University of Pennsylvania, 1 Founders Pavilion, 3400 Spruce Street, Philadelphia, PA 19104 USA
References
- 1.Gatehouse PD, Bydder GM. Magnetic resonance imaging of short T2 components in tissue. Clin Radiol. 2003;58(1):1–19. doi: 10.1053/crad.2003.1157. [DOI] [PubMed] [Google Scholar]
- 2.Wilhelm MJ, et al. Direct magnetic resonance detection of myelin and prospects for quantitative imaging of myelin density. Proc Natl Acad Sci U S A. 2012;109(24):9605–10. doi: 10.1073/pnas.1115107109. [DOI] [PMC free article] [PubMed] [Google Scholar]
- 3.Rad HS, et al. Quantifying cortical bone water in vivo by three-dimensional ultra-short echo-time MRI. NMR Biomed. 2011;24(7):855–64. doi: 10.1002/nbm.1631. [DOI] [PMC free article] [PubMed] [Google Scholar]
- 4.Techawiboonwong A, et al. Cortical bone water: In vivo quantification with ultrashort echo-time MR imaging. Radiology. 2008;248(3):824–833. doi: 10.1148/radiol.2482071995. [DOI] [PMC free article] [PubMed] [Google Scholar]
- 5.Bergin CJ, Pauly JM, Macovski A. Lung parenchyma: projection reconstruction MR imaging. Radiology. 1991;179(3):777–81. doi: 10.1148/radiology.179.3.2027991. [DOI] [PubMed] [Google Scholar]
- 6.Nielles-Vallespin S, et al. 3D radial projection technique with ultrashort echo times for sodium MRI: clinical applications in human brain and skeletal muscle. Magn Reson Med. 2007;57(1):74–81. doi: 10.1002/mrm.21104. [DOI] [PubMed] [Google Scholar]
- 7.Seifert AC, et al. P NMR relaxation of cortical bone mineral at multiple magnetic field strengths and levels of demineralization. NMR Biomed. 2013 doi: 10.1002/nbm.2930. [DOI] [PMC free article] [PubMed] [Google Scholar]
- 8.Anumula S, et al. Measurement of phosphorus content in normal and osteomalacic rabbit bone by solid-state 3D radial imaging. Magnetic Resonance in Medicine. 2006;56(5):946–952. doi: 10.1002/mrm.21050. [DOI] [PubMed] [Google Scholar]
- 9.Robson MD, et al. Magnetic resonance: an introduction to ultrashort TE (UTE) imaging. J Comput Assist Tomogr. 2003;27(6):825–46. doi: 10.1097/00004728-200311000-00001. [DOI] [PubMed] [Google Scholar]
- 10.Balcom BJ, et al. Single-Point Ramped Imaging with T1 Enhancement (SPRITE) J Magn Reson A. 1996;123(1):131–4. doi: 10.1006/jmra.1996.0225. [DOI] [PubMed] [Google Scholar]
- 11.Wu Y, et al. Water- and fat-suppressed proton projection MRI (WASPI) of rat femur bone. Magn Reson Med. 2007;57(3):554–67. doi: 10.1002/mrm.21174. [DOI] [PubMed] [Google Scholar]
- 12.Weiger M, Pruessmann KP, Hennel F. MRI with zero echo time: hard versus sweep pulse excitation. Magn Reson Med. 2011;66(2):379–89. doi: 10.1002/mrm.22799. [DOI] [PubMed] [Google Scholar]
- 13.Grodzki DM, Jakob PM, Heismann B. Ultrashort echo time imaging using pointwise encoding time reduction with radial acquisition (PETRA) Magnetic Resonance in Medicine. 2012;67(2):510–518. doi: 10.1002/mrm.23017. [DOI] [PubMed] [Google Scholar]
- 14.Idiyatullin D, et al. Fast and quiet MRI using a swept radiofrequency. Journal of Magnetic Resonance. 2006;181(2):342–349. doi: 10.1016/j.jmr.2006.05.014. [DOI] [PubMed] [Google Scholar]
- 15.Rahmer J, et al. Three-dimensional radial ultrashort echo-time imaging with T2 adapted sampling. Magn Reson Med. 2006;55(5):1075–82. doi: 10.1002/mrm.20868. [DOI] [PubMed] [Google Scholar]
- 16.Kuethe DO, et al. Transforming NMR data despite missing points. Journal of Magnetic Resonance. 1999;139(1):18–25. doi: 10.1006/jmre.1999.1767. [DOI] [PubMed] [Google Scholar]
- 17.Weiger M, et al. ZTE imaging in humans. Magn Reson Med. 2013;70(2):328–32. doi: 10.1002/mrm.24816. [DOI] [PubMed] [Google Scholar]
- 18.Grodzki DM, Jakob PM, Heismann B. Correcting slice selectivity in hard pulse sequences. Journal of Magnetic Resonance. 2012;214(1):61–7. doi: 10.1016/j.jmr.2011.10.005. [DOI] [PubMed] [Google Scholar]
- 19.Jackson JI, et al. Selection of a Convolution Function for Fourier Inversion Using Gridding. Ieee Transactions on Medical Imaging. 1991;10(3):473–478. doi: 10.1109/42.97598. [DOI] [PubMed] [Google Scholar]
- 20.Pauly J, Nishimura D, Macovski A. A K-Space Analysis of Small-Tip-Angle Excitation. Journal of Magnetic Resonance. 1989;81(1):43–56. doi: 10.1016/j.jmr.2011.09.023. [DOI] [PubMed] [Google Scholar]
- 21.Block KT, Uecker M, Frahm J. Undersampled radial MRI with multiple coils. Iterative image reconstruction using a total variation constraint. Magnetic Resonance in Medicine. 2007;57(6):1086–1098. doi: 10.1002/mrm.21236. [DOI] [PubMed] [Google Scholar]
- 22.Goldstein T, Osher S. The Split Bregman Method for L1-Regularized Problems. Siam Journal on Imaging Sciences. 2009;2(2):323–343. [Google Scholar]
- 23.Keiner J, Kunis S, Potts D. Using NFFT 3-A Software Library for Various Nonequispaced Fast Fourier Transforms. Acm Transactions on Mathematical Software. 2009;36(4) [Google Scholar]
- 24.Fraser D. Interpolation by the Fft Revisited - an Experimental Investigation. Ieee Transactions on Acoustics Speech and Signal Processing. 1989;37(5):665–675. [Google Scholar]
- 25.Weiger M, et al. High-resolution ZTE imaging of human teeth. NMR Biomed. 2012;25(10):1144–51. doi: 10.1002/nbm.2783. [DOI] [PubMed] [Google Scholar]
- 26.Li C, et al. Comparison of optimized soft-tissue suppression schemes for ultrashort echo time MRI. Magn Reson Med. 2012;68(3):680–9. doi: 10.1002/mrm.23267. [DOI] [PMC free article] [PubMed] [Google Scholar]
- 27.Du J, et al. Short T2 contrast with three-dimensional ultrashort echo time imaging. Magn Reson Imaging. 2011;29(4):470–82. doi: 10.1016/j.mri.2010.11.003. [DOI] [PMC free article] [PubMed] [Google Scholar]
- 28.Sorensen TS, et al. Accelerating the nonequispaced fast Fourier transform on commodity graphics hardware. Ieee Transactions on Medical Imaging. 2008;27(4):538–547. doi: 10.1109/TMI.2007.909834. [DOI] [PubMed] [Google Scholar]
- 29.Gai JD, et al. More IMPATIENT: A gridding-accelerated Toeplitz-based strategy for non-Cartesian high-resolution 3D MRI on GPUs. Journal of Parallel and Distributed Computing. 2013;73(5):686–697. doi: 10.1016/j.jpdc.2013.01.001. [DOI] [PMC free article] [PubMed] [Google Scholar]
- 30.Hinshaw WS, Lent AH. An Introduction to Nmr Imaging - from the Bloch Equation to the Imaging Equation. Proceedings of the Ieee. 1983;71(3):338–350. [Google Scholar]


