

Abstract
The delicate balance between protective immunity and inflammatory disease is challenged during sepsis, a pathologic state characterized by aspects of both a hyper-active immune response and immunosuppression. The events driven by systemic infection by bacterial pathogens on the T cell signaling network that likely control these responses have not been illustrated in great detail. We characterized how intracellular signaling within the immune compartment is reprogrammed at the single cell level when the host is challenged with a high levels of pathogen. To accomplish this, we applied flow cytometry to measure the phosphorylation potential of key signal transduction proteins during acute bacterial challenge. We modeled the onset of sepsis by intravenous administration of avirulent strains of Listeria and E. coli to mice. Within six hours of bacterial challenge, T cells were globally restricted in their ability to respond to specific cytokine stimulations as determined by assessing the extent of STAT protein phosphorylation. Mechanisms by which this negative feedback response occurred included SOCS1 and SOCS3 gene up regulation and IL-6 induced endocystosis of the IL-6 receptor. In addition, macrophages were partially tolerized in their ability to respond to TLR agonists. Thus, in contrast to the view that there is a wholesale immune activation during sepsis, one immediate host response to blood borne bacteria was induction of a refractory period during which leukocyte activation by specific stimulations was attenuated.
Keywords: Bacteria, T cell, macrophage, cytokine, signal transduction
Introduction
Immune responses to bacteremia and sepsis have been studied in a wide variety of models revealing the significance of specific cells and cytokines in the complex host response to the presence of bacteria in the blood (reviewed in (1). Historically, sepsis has been viewed as a hyper-active immune response to blood borne bacteria that induces a “cytokine storm” leading to septic shock, but a new paradigm has arisen proposing that immune activation causes subsequent down regulation of signaling and that sepsis is in large part a disease of immunosuppression (reviewed in (1, 2). To resolve this apparent contradiction, understanding the signaling competence of cells within the immune system during the onset of sepsis is of critical importance. While fulminant infection of blood is life threatening and must be abated, an untempered immune response may lead to organ failure and death. It is this balance that the physician faces in the treatment of sepsis, which can be fatal within hours and is estimated to kill 200,000 people in the U.S. annually (2). Therefore, it is important to determine which leukocyte subsets exhibit enhanced or repressed abilities to transduce signals initiated by environmental stimulation. By administering non-pathogenic bacteria into the blood of mice, it is possible to model the conditions at the onset of sepsis without the confounding factors produced by the use of virulent organisms, nor the stress following invasive surgical procedures.
Detection of microbial insults by mammalian hosts often begins with antigen presenting cells (APCs) expressing toll-like receptors (TLRs) that recognize pathogen-associated molecular patterns (PAMPs)4 (reviewed in (3)). This recognition induces a maturation process accompanied by secretion of inflammatory cytokines, including IL-1β, TNFα, IL-6, IFNα, and IL-12. Autocrine and paracrine actions of these cytokines turn on JAK/STAT pathways, driving transcription of STAT inducible genes. Negative feedback mechanisms are also induced, including internalization of cytokine receptors and up regulation of suppressor of cytokine signaling (SOCS) (reviewed in (4)). Engagement of different TLRs results in secretion of distinct inflammatory cytokines with differential effects on adaptive immunity (5, 6). Thus, the character of the adaptive immune response is shaped by signaling that occurs within a few hours of infection.
The host secondary signals elicited by bacteria may either promote or hinder immune activation depending on the experimental model and there is need to understand the signaling network and the possible reprogramming that underlies these disparate outcomes. Evaluating the modulation of cell signaling in disease states is complicated by the fact that the immune system is composed of many different cell types, each with a potentially unique signaling signature that temporally arises and changes during an immune response. Flow cytometry can now merge intracellular phospho-specific detection and cell lineage determinations (based on expression of surface markers) to quantify the activation of signaling networks within specific cell types with greater throughput and breadth than are achievable with more traditional methods (7). Importantly, ex vivo cytokine stimulation of immune cells derived from experimental subjects can reveal and amplify subtle changes or biases in cell signaling potential that are instigated by pathogenic activities (8).
Herein, we demonstrate that intracellular signaling networks are rapidly reprogrammed when mice are challenged with bacteria through the blood stream. By measuring the phosphorylation status of key signal transduction components within specific cell types, we demonstrate that mice challenged with gram-positive Listeria deficient for listeriolysin O (LLO), with gram-negative non-pathogenic E. coli, or with the bacterial membrane component lipopolysaccharide (LPS), exhibit specific dampening of STAT signaling potential. Cytokines secreted by macrophages were sufficient to rewire the signaling network in bystander lymphocytes, which then exhibited SOCS gene induction and reduced cytokine receptor expression. In addition, macrophages exhibited diminished signaling capacity through the MAPK and NFκB pathways in response to TLR activation. Thus, the early immune response to bacteria was characterized by a refractory period as negative feedback shut down select signaling pathways. This is the first reported broad measurement of bacteremia-induced modulation of signal transduction status across multiple cell types, including APC and lymphocyte subsets, and as such unravels the underlying signaling network that controls mammalian responses to acute systemic infections and, in part, determines outcome.
Materials and Methods
Mice
Male BALB/c mice were obtained from the in-house colony at the Stanford Animal Facility. C57BL/6 and IL-6 -/- on the C57BL/6 background were obtained from Jackson Laboratories and female mice were used. All mice were handled in accordance with APLAC and Stanford University animal care guidelines. Mice were used for experiments at between 8 and 10 weeks of age.
Bacterial strains and infection
The Listeria monocytogenes strain DP-L2161 is an in-frame deletion of strain 10403S kindly provided by Daniel Portnoy. TOP10 E. coli was purchased from Invitrogen. Injections were given via the lateral tail vein and consisted of either PBS, E. coli, LLO- Listeria, or LPS in a 200 μl volume. TOP10 E. coli was grown overnight in Luria broth, washed in PBS and injected at a dose of 2×10⁸ colony forming units (CFU) obtained at stationary phase. DP-L2161 was grown to log phase in BHI media and 2×10⁸ CFU injected. LPS was injected at 0.5 μg or 5 μg per mouse.
Stimulation of splenocytes and blood
Six hours post-injection, spleens were harvested and mechanically dissociated into single-cell suspensions at a concentration of 1 × 10⁷ cells/mL in RPMI-1640 containing 10% FBS and PSQ (RPMI-10). Dissociated splenocytes were allowed to recover for 15 minutes at 37°C. Cells were then left unstimulated or stimulated with IFNα (PBL Biomedical) at 400 U/mL; IFNγ, IL-4, IL-6, IL-7, IL12, GM-CSF (all from BD Biosciences), or IL-21 (R&D) at 40 ng/mL; IL-10 (BD Biosciences) at 80 ng/mL; LPS (Sigma) or PAM3CysSK4 (EMC Microcollections) at 10 μg/ml, and compared to untreated cells. Exposure to cytokines was performed at 37°C for 15 minutes, and for TLR agonists we used 30 minutes at 37°C. Cells were then fixed with 1.6% paraformaldehyde at room temperature for 10 minutes, washed with MEM, resuspended in methanol at 4°C and stored at -80°C. In the experiments where mice were injected with LPS or bone marrow-derived macrophages (BMDM), the recovery period was extended to 2 hours at 37°C.
Blood was collected by cardiac puncture using needles pre-loaded with heparin (Sigma-Aldrich) and either directly stimulated with IL-6 (40 ng/mL) or left unstimulated for 15 minutes. Cells were then fixed with Lyse/Fix Buffer (BD Phosflow) according to manufacturer’s guidelines. Next, cells were washed and resuspended in cold methanol and stored at -80°C.
Flow cytometry
Cells stored in methanol were washed twice with staining media (PBS containing 0.5% BSA and 0.05% sodium azide). Cells were stained for 30 minutes in staining media with a surface marker panel of CD8 PacBlu, CD11c PE, B220 TR-PE, F4/80 Cy7-PE, CD11b Cy5.5-PerCP, CD4 Ax700, and Gr1 Cy7-APC (BD Biosciences). Phospho-specific antibodies were used alone or in pairs: pStat1 Ax488 and pStat3 Ax647; pStat5 Ax647; pStat4 Ax488 and pStat6 Ax647; pErk Ax488 and pIKK with Ax647 secondary; pNFκB with Ax488 secondary and p_p38 Ax647; and pMAPKAPK-2 Ax647. All pSTAT antibodies and p_p38 were from BD Biosciences; the rest were from Cell Signaling Technologies. After staining, cells were washed with staining media and analyzed on an LSRII flow cytometer equipped with 407, 488, and 633 nm lasers. Digital data was acquired with BD Diva software with >50,000 size-gated cells collected per sample. Data was analyzed with FlowJo software (Tree Star). Median fluorescence intensity (MFI) was used to calculate the fold change between stimulated and unstimulated cells: fold change = MFIstim/MFIunstim. In some cases, the log10 fold change was used such that samples showing no response to stimulation had a value of zero and those that showed increases in phospho-protein levels were positive.
In vitro stimulations
Bone marrow-derived dendritic cells (BMDCs) were prepared by culturing bone marrow in RPMI-10 with 50 μM 2-mercaptoethanol and GM-CSF at 10 μg/mL. Cells were plated at 2 × 10⁵ cells/mL on polystyrene plates and cultured for 13 days (9). BMDCs were matured with LPS (1 μg/mL) overnight or left untreated and then cells were stimulated for flow cytometry analysis. BMDMs were prepared by culturing bone marrow in RPMI-10 with 10 mM HEPES and 10 ng/mL M-CSF. Cells were plated at 1 × 10⁵ cells/cm2 in a polystyrene dish. Media was changed on day 4 and cells were used on day 6-8. To remove adherent macrophages, plates were incubated with PBS at 4°C then gently rinsed 20 times until cells became loose. T cells were purified from splenocytes by IMAG magnetic bead negative selection (BD Biosciences) according to manufacturer’s guidelines.
BMDM and T cells at 2 × 10⁶ cells/mL were treated with PBS, LPS (10 μg/mL), or PAM (10 μg/mL) for 6 hours. Cells were then stimulated and flow cytometry performed as described above. To generate TLR treated macrophage conditioned media, BMDMs were treated with LPS or PAM for 1 hour, washed three times, and cultured in RPMI-10 for 5 hours. This media was collected and added to T cells at an 80:20 ratio of conditioned media to normal media. T cells were subsequently cultured for 3 hours and cells were stimulated for flow cytometry analysis.
Ex vivo BMDM infection
BMDMs were infected with Listeria strain 10403S or hly- Listeria in rotating suspension at an MOI of 30 for 30 minutes at 37°C. Cells were washed and resuspended in RPMI-10 with 5 μg/mL gentamycin at 37°C for 30 minutes. Cells were washed twice and 1 × 10⁶ cells were injected into each mouse.
Real-time RT-PCR and IL-6R staining
Cells for surface staining and for RNA preparations were obtained from a fraction of each spleen immediately after harvesting to determine basal expression levels. CD4+ cells were purified from splenocytes by positive selection with IMAG magnetic bead cell separation according to the manufacturer’s guidelines (BD Biosciences). CD4+ cells and total splenocytes were pelleted and then lysed in Trizol for 15 min at room temperature. Samples were stored at -80°C in Trizol prior to RNA isolation. After extraction from Trizol and isopropanol precipitation, the RNA was purified using RNAeasy columns (Qiagen) and resuspended in water. Transcript quantitation was normalized to β-actin internal controls. Fold induction was calculated as the ratio of transcript abundance after bacterial challenge to abundance from control mice.
Splenocytes isolated from challenged mice were stained with IL-6Rα PE (BD Biosciences) and cell lineage markers to determine IL-6 receptor surface receptor expression and then analyzed on an LSRII flow cytometer.
Immunoblotting analysis
CD4+ cells were isolated from the spleen by positive selection with IMAG magnetic bead cell separation. Cells were incubated on ice for 1 hour with lysate buffer containing 20 mM Tris-HCl (pH 7.5), 200 mM NaCl, 10 mM EDTA (pH 8.0), 2% Triton X-100, 77 mM Na3VO4 and one protease inhibitor tablet (Roche). Protein lysate was then mixed with sample buffer containing 2% SDS, 10% glycerol, 5% 2-ME, and 0.01% bromophenol blue. Sample proteins were separated on a NuPAGE 10% Bis-Tris gel (Invitrogen) and transferred to Immobilon-P Transfer Membrane (Millipore) for immunoblotting with anti-pStat1 (Y701) or anti-Stat1 clone 42 (both BD Biosciences) and anti-β-actin (Abcam). To quantify protein, the band intensity was determined with NIH ImageJ software.
Statistics
Data were analyzed with a one-way ANOVA test to determine significant differences between groups, with p < 0.05 considered significant.
Results
Bacterial challenge modulates phospho-protein responses across multiple signaling network elements
BALB/c mice were challenged via tail vein injection of avirulent hly- Listeria monocytogenes (2 × 10⁸ CFU, 0.1 LD50) or TOP10 E. coli (2 × 10⁸ CFU). The use of avirulent bacteria allows proximal studies of host recognition processes to be separated from the confounding effects of replication and associated bacterial toxin production or host cell necrosis. The hly- Listeria strain is avirulent due to deletion of the gene encoding for the protein LLO, a protein required for bacterial escape from host cell phagosomes into the cytoplasm and subsequent cell-to-cell spread (10, 11). TOP10 E. coli is a non-pathogenic lab-adapted strain. Splenocytes were harvested from infected mice 6 hours after intravenous injection of bacteria and then prepared for stimulation with cytokines or TLR agonists (Fig. 1A). Cells were fixed at 15 min post-cytokine stimulation or 30 min post-TLR stimulation to arrest signaling events, then stained with antibodies against surface markers and intracellular phospho-proteins.
Figure 1. Cytokine-induced phosphorylation of Stat1 is repressed post-bacteremia.

(A) Mice were injected intravenously with 2 × 10⁸ CFU of LLO- Listeria, 2 × 10⁸ CFU of E. coli, or PBS control. After 6 hours, spleens were removed and cells stimulated with cytokines for 15 minutes or TLR agonist for 30 minutes. Cells were fixed and permeabilized for antibody staining. (B) Splenocytes were stained with antibodies against each of seven cell surface markers to define multiple, distinct cell types. Cells were first gated on size to remove red blood cells and debris and then a hierarchical gating structure was used to distinguish B cells, CD4 and CD8 T cells, macrophages, cDC, and pDC. Each stain also included two antibodies against phospho-epitopes of certain signaling proteins. For each cell type, the level of specific protein phosphorylation was determined. Stat1 phosphorylation levels in (C) CD4 cells and (D) B cells from each infection condition are shown as histograms. The MFI from each stain was used to quantify phospho-Stat1 levels. Infection-induced changes in MFI are represented in yellow beneath the histograms of unstimulated samples. The fold change in response to cytokine is indicated in heat map format.
Signaling was determined in six distinct cell types: B220+ B cells, CD4+ and CD8+ T cells, CD11b+ F4/80+ macrophages, CD11c+B220- conventional dendritic cells (cDC), and CD11c+B220+ plasmacytoid dendritic cells (pDC) (see gating in Fig. 1B). Macrophages from bacteremic mice exhibited slightly reduced levels of CD11b staining. For each of these cell types, the level of phosphorylation of a given phospho-protein was calculated from the median fluorescence intensity (MFI). Flow cytometry has previously been shown to be a highly sensitive platform for quantifying phosphorylation of intracellular proteins with changes in MFI tightly correlating with Western Blots performed in parallel (12, 13). To quantify the inducibility of a given phosphorylation event in response to a stimulation, we calculated the fold change, [MFI stimulated]/[MFI unstimulated], and presented this in heat map format. Example stimulations are shown in Figures 1C and 1D with the fold-changes indicated in heat map format and the quantification presented in Table I. Both flow cytometry and Western blotting techniques yielded similar results when used to quantify Stat1 phosphorylation (data not shown). By using this approach we were able to detect alterations to immune activation potential in response to bacterial challenge or infection.
Table I. Quantification of MFI and fold change of Stat1 induction in CD4 cells and B cells.a.
| CD4 cells No Stimb | CD4 cells IL-6 Stim | CD4 cells Fold Changec | B cells No Stim | B cells IFNγ Stim | B cells Fold Change | |
|---|---|---|---|---|---|---|
| PBS 1 | 46.6 | 1134 | 24.3 | 41.3 | 170 | 4.1 |
| PBS 2 | 47 | 1200 | 25.5 | 44.3 | 142 | 3.2 |
| PBS 3 | 46.1 | 1116 | 24.2 | 42.1 | 128 | 3.0 |
| PBS Averaged | 46.5 ± 0.5 | 1150 ± 44.2 | 24.7 ± 0.7 | 42.6 ± 1.6 | 147 ± 21.4 | 3.5 ± 0.6 |
| LLO- 1 | 103 | 394 | 3.8 | 109 | 123 | 1.1 |
| LLO- 2 | 87.7 | 311 | 3.5 | 99.3 | 123 | 1.2 |
| LLO- 3 | 92.8 | 475 | 5.1 | 91.6 | 124 | 1.4 |
| LLO- Average | 94.5 ± 7.8 | 393 ± 82.0 | 4.2 ± 0.8 | 100 ± 8.7 | 123 ± 0.6 | 1.2 ± 0.1 |
| E. coli 1 | 122 | 192 | 1.6 | 109 | 112 | 1.0 |
| E. coli 2 | 120 | 188 | 1.6 | 107 | 98.7 | 0.9 |
| E. coli 3 | 149 | 190 | 1.3 | 126 | 129 | 1.0 |
| E. coli Average | 130 ± 16.2 | 190 ± 2.0 | 1.5 ± 0.2 | 114 ± 10.4 | 113 ± 15.2 | 1.0 + 0.1 |
Cells were prepared as described for Figures 1C and 1D.
The median fluorescence intensity (MFI) for the given cell type and stimulation condition.
The fold change is calculated as [MFI stimulated]/[MFI unstimulated].
The average and standard deviation of three experimental replicates per condition.
We applied a large panel of cell stimulations and assayed phospho-activation events to generate a view of signaling modulation at the single cell level after bacterial challenge. Cytokines (IFNα, IFNγ, IL-4, IL-6, IL-7, IL-10, IL-21, GM-CSF) were used to activate STAT transcription factors and the TLR4 agonist LPS and TLR2 agonist PAM3CysSK4 (PAM3) were used to induce MAPK and NFκB pathway signaling proteins. The ability of cytokines to induce protein phosphorylation is presented in heat map form in Figure 2.
Figure 2. Phospho-protein responsiveness reveals that bacterial challenge reduces potentiation of multiple signaling pathways.
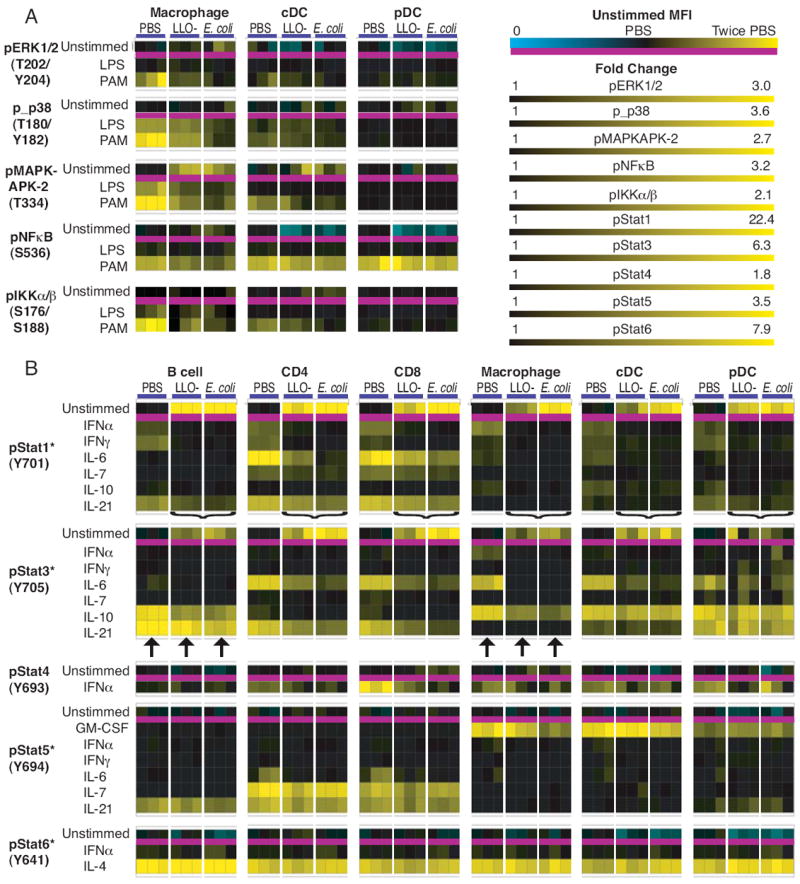
Six hours after challenge with 2 × 10⁸ CFU of LLO- Listeria or 2 × 10⁸ CFU of E. coli, cells were isolated from these mice and from controls treated with PBS and were analyzed by flow cytometry, as outlined in Figure 1. Splenocytes from three mice per condition were stimulated (A) for 30 minutes with LPS or PAM3CysSK4 at 10 μg/mL, or (B) 15 minutes with IFNα (400 U/mL), or IFNγ, IL-4, IL-6, IL-7, IL12, GM-CSF, or IL-21 (40 ng/mL), or IL-10 (80 ng/mL) with a total of 1,809 measurements of protein phosphorylation represented in the heat map form. Each point represents the response of a specific signaling protein to a specific stimulation in a distinct cell type during different infection conditions. For each phospho-protein, the MFI from unstimulated cells is across the top and the fold change in response to stimulation is underneath. The scaling for MFI in the unstimulated state is specific to each phospho-protein in each cell type, with the average MFI from PBS mice set to black, twice that value scaled to yellow, and 0 scaled to cyan. The scaling for fold change is specific to each phospho-protein and consistent across cell types. An asterisk indicates that the color scale is for log10 of fold change. The brackets indicate bacteria induced pertubations of Stat1 activation, and the arrows point to Stat3 responses to IL-10 and IL-21.
TLR signaling in macrophages is modulated by bacteremia
Initial detection of bacterial pathogens is mediated in part by TLRs that induce activation of both the MAPK and NFκB pathways. We therefore quantified the activation of these pathways after bacterial challenge and determined if changes in regulatory responses could be observed. TLR stimulation induced protein phosphorylation in professional APCs, but not in B cells or T cells (Fig. 2A and data not shown). Macrophages from bacterially challenged mice had elevated levels of phospho-MAPKAPK2 compared to control mice (Fig. 3A), demonstrating activation of the MAPK pathway. In turn, MAPK responses to stimulation with the TLR agonists LPS and PAM3 were inhibited in bacterially challenged macrophages, as there was reduced activation of ERK, p38, and the p38 target MAPKAPK-2 (Fig. 2A, Fig. 3A). This shows that during bacteremia the MAPK pathway becomes partially activated, though subsequently the potential to reach maximal activation is inhibited.
Figure 3. Bacterial challenge modulates macrophage TLR responses.
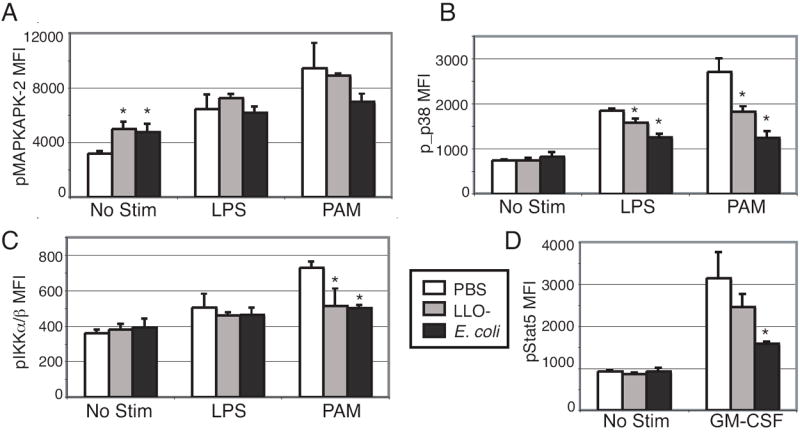
Cells from mice that had received LLO- Listeria, E. coli or PBS 6 hours earlier were analyzed by flow cytometry, as outlined in Figure 1. The bar graphs show the average macrophage MFIs from splenocytes of bacteremic mice after 30 minute treatment with LPS (10 μg/mL) or PAM3CysSK4 (10 μg/mL) for (A) pMAPKAPK-2, (B) p_p38, (C) pIKKα/β, and (D) pStat5 after GM-CSF (40 ng/mL) stimulation. Data are the mean (± SD) values from three mice per group. An asterisk signifies p < 0.05 compared to PBS control. Data are representative of at least two separate experiments.
Residue S536 in the trans-activational domain of NFκB p65 is phosphorylated during protein activation by a broad spectrum of stimuli (14) and is indispensable for full transcriptional activity following TLR stimulation (15). In macrophages, the ability of PAM3 to activate NFκB p65 at this residue was slightly reduced following bacterial challenge compared to activation in control mice, though this signaling modulation was only significant with LLO- Listeria (p < 0.05) (Fig. 2A). Although macrophages from control mice responded to PAM3 with IKKα/β phosphorylation (fold change: 2.0 ± 0.08), E. coli strongly inhibited TLR2-induced IKKα/β phosphorylation (fold change: 1.3 ± 0.1) and LLO- Listeria slightly inhibited this phosphorylation (fold change: 1.4 ± 0.4) (Fig. 3C). Therefore, during bacteremia the potential to activate the NFκB pathway was restricted.
Bacterial challenge reduces potentiation of specific JAK/STAT signaling nodes
Both E. coli and LLO- Listeria induced phosphorylation of Stat1 in all splenic cell types examined (Fig. 2B). In turn, Stat1 showed reduced competence to respond to cytokine stimulation. Across cell types, the level of Stat1 induction from IFNα, IFNγ, IL-6, IL-7, and IL-21 was attenuated by pre-exposure to bacteria (Fig. 2B, indicated by brackets). In some instances, the magnitude of Stat1 phosphorylation after these stimulations was not significantly different in bacteremic vs. control cells, as Stat1 phosphorylation was already highly induced. However, treatment with either bacteria inhibited maximal IFNγ activation of Stat1 in B cells (PBS MFI: 147 ± 21, LLO MFI: 123 ± 1, E. coli MFI: 113 ± 15), demonstrating active suppression of this signaling pathway (Fig. 1D). Thus, Stat1 is activated during bacteremia and is unable to further respond to stimulation by multiple cytokines.
IL-6 is an inflammatory cytokine associated with sepsis in humans and in murine models (1, 16). IL-6 strongly induced Stat1 phosphorylation in CD4 T cells from control mice (MFI: 1150 ± 44; fold change: 24.7 ± 0.7); challenge with LLO- Listeria partially inhibited this response (MFI: 393 ± 82; fold change: 4.2 ± 0.8) and E. coli challenge strongly blocked it (MFI: 190 ± 2; fold change: 1.5 ± 0.2) (Fig. 1C and Fig 4A). The response of Stat3 and Stat5 to IL-6 was also inhibited by both bacteria (Fig. 4B). E. coli more strongly inhibited IL-6 phosphorylation of Stat5 than did LLO- Listeria (PBS MFI: 1099 ± 142, LLO MFI: 818 ± 41, E. coli MFI: 688 ± 35) and E. coli challenge strongly curtailed Stat3 phosphorylation (PBS MFI: 1016 ± 48, LLO MFI: 841 ± 116, E. coli MFI: 692 ± 52) (Fig. 3B). Therefore, IL-6 signaling was abrogated in T cells to different degrees by different bacteria.
Figure 4. Specific STAT signaling nodes are inhibited during bacteremia.
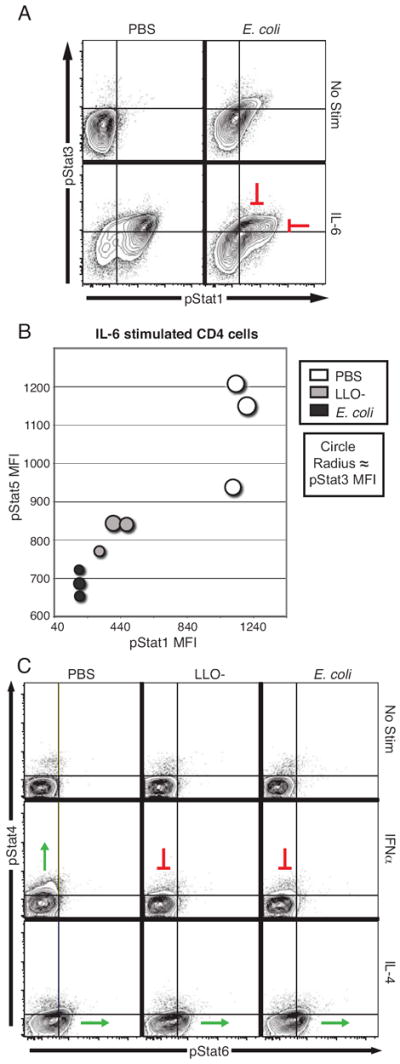
Six hours after challenge with LLO- Listeria (2 × 10⁸ CFU) or E. coli (2 × 10⁸ CFU), the splenocytes from these mice and from controls treated with PBS were analyzed by flow cytometry, as outline in Figure 1. (A) Spleens stimulated with IL-6 (40 ng/mL) were gated on CD4 cells; pStat1 and pStat3 levels were determined and are shown in contour plots. (B) The MFIs for pStat1, pStat3, and pStat5 in IL-6-stimulated CD4 cells were determined. The 2D bubble-plot shows these MFIs, with the pStat3 MFI proportional to the dot size. The origin of the axis is the average value of pStat1 and pStat5 MFIs in unstimulated cells from uninfected mice and the dots are scaled such that the minimal size is the average pStat3 MFI in unstimulated cells from uninfected mice. (C) Splenocytes from challenged mice were unstimulated or IFNα 400 U/mL) or IL-4 (40 ng/mL) treated. Contour plots of phospho-STAT levels from CD8 cells are shown from representative mice.
IL-10 has anti-inflammatory properties that are dependent on Stat3, such as the ability to inhibit macrophage activation and cytokine secretion (17). As with Stat1, phosphorylation of Stat3 was induced in all cell types by both E. coli and LLO- Listeria (Fig. 2). The Stat3 response to IL-10 was reduced by bacteremia (Fig. 2B, indicated by arrows). In macrophages from uninfected mice, IL-10 induced phosphorylation of Stat3 (MFI: 2380 ± 93) to higher levels than in those from LLO- Listeria-challenged mice (MFI: 1577 ± 120) or E. coli-challenged mice (MFI: 1486 ± 59). Likewise, Stat3 in B cells from bacteremic mice was less responsive to IL-10 than from control mice (PBS MFI: 751 ± 61, LLO MFI: 524 ± 39, E. coli MFI: 538 ± 27). In contrast, there was no effect on the response of Stat3 to IL-21 in B cells (Fig. 2B, indicated by arrows). This indicates that the IL-10/Stat3 signaling node was specifically dampened by bacterial challenge.
Stat5 also showed signal-specific modulation by bacteria. While the IL-6 response was inhibited (Fig. 4B), the robust response of Stat5 to IL-7 in T cells was maintained in bacteremic mice (Fig. 2B). Stat5 phosphorylation in response to IL-21 was slightly curtailed in CD4 T cells from E. coli-challenged mice, but was unaffected by LLO- Listeria challenge (PBS MFI: 1723 ± 55, LLO MFI: 1698 ± 153, E. coli MFI: 1515 ± 113). It was previously reported that Stat5 phosphorylation induced by GM-CSF was curtailed in bone marrow-derived macrophages infected with Listeria (18). In our experiments, the Stat5 response to GM-CSF in macrophages was inhibited by E. coli (Fig. 3D), though it was maintained in both dendritic cell subsets (Fig. 2). Thus, the nature of down regulation of Stat5 signaling during bacteremia appears to be dependent on the pathogen and is both pathway and cell type specific.
Stat4 and Stat6 have been implicated in Th1 and Th2 biasing, respectively. Neither bacterial species affected basal phosphorylation levels of Stat4 or Stat6 (Fig. 2B and Fig 4C). T cells did not respond with Stat4 phosphorylation to IL-12 (data not shown), as naïve T cells do not express the IL-12 receptor (19). In mice, Stat4 is activated by IFNα in CD8+ T cells (20), and this response was inhibited by bacteria (Fig. 4C). However, in all cell types evaluated, Stat6 responsiveness to IL-4 was maintained after infection (Fig. 2B and Fig. 4C). Thus, six hours after the onset of bacteremia, the type I interferon response was curtailed and the response to classic Th biasing cytokines was unaffected.
T cell modulation is mediated by a macrophage secreted factor
Taken together, the results demonstrate that within six hours of bacterial challenge, immune signaling networks are modulated across a broad spectrum of leukocyte cell types and focused upon a subclass of cell-type specific, evoked, signaling events. APCs directly detect bacteria via pathogen pattern recognition receptors such as TLRs, so it was not surprising that altered signaling of multiple pathways was observed in these cells. However, we had not expected to observe rapid modulation of STAT signaling across all CD4 and CD8 T cells. T cells are not thought to directly detect the presence of microorganisms. Therefore, we hypothesized that the perturbations of signaling in T cells were mediated through APCs and set out to determine the mechanism that rapidly propagated signaling alterations throughout the entire immune compartment.
We first asked if TLR activation alone was sufficient to recapitulate the STAT signaling inhibition we observed with pathogen challenge. Mice were treated with LPS and splenocytes were subsequently assayed for Stat1 responsiveness to cytokines, because we had found that reduction of Stat1 signaling is a signature of bacterial challenge. Like live bacteria, LPS inhibited the ability of Stat1 to respond to multiple stimuli in T cells and macrophages in a dose-dependent manner (Fig. 5A). This demonstrated that TLR activation alone is sufficient to recapitulate part of the signaling profile observed after bacterial challenge.
Figure 5. T cell signaling modulation is mediated via a secreted factor from macrophages.

(A) Mice were treated i.v. with 0.5 μg LPS (light grey), 5 μg LPS (dark grey), or PBS as a control (white). After 6 hours, splenocytes were harvested and stimulated with IFNα (400 U/mL), IFNγ (40 ng/mL), IL-6 (40 ng/mL) or were left unstimulated. The mean (± SD) in fold change of pStat1 MFI post-stimulation was determined from B cells and CD4 T cells from two mice per group and is representative of at least two separate experiments. (B) BMDCs were cultured overnight without or with LPS (1 μg/mL), stimulated with either IFNα, IFNγ, IL-6, IL-10, or GM-CSF for 15 minutes, and then fixed and analyzed. The gating for MHCII+ cells is shown in the upper left contour plots. Also shown are contour plots of CD11c compared to pStat1, pStat3, and pStat5. (C) BMDMs and primary T cells were cultured with LPS (10 μg/mL) or PAM3CysSK4 (10 μg/mL) for 6 hours, then stimulated 15 minutes with either IFNα, IFNγ, or IL-6 and assayed by flow cytometry for pStat1 levels. (D) The media from BMDMs treated with LPS or PAM3CysSK4 was collected and applied to T cells for 3 hours. T cells were then stimulated with IFNα, IFNγ, or IL-6 and assayed by flow cytometry for pStat1 levels. (E) BMDMs were infected ex vivo with wild-type Listeria or LLO- Listeria and then treated with gentamycin. Three mice each were intravenously injected with PBS control, BMDMs, Listeria-infected BMDMs, LLO- Listeria-infected BMDMs, or Listeria-cleared media to control for media exposure to bacteria. Six hours later, splenocytes were harvested and stimulated with IFNα, IFNγ or IL-6 and then assayed by flow cytometry for pStat1 levels. An asterisk signifies p < 0.05 compared to PBS control. Data are representative of at least two separate experiments.
Next, we examined whether APCs treated in vitro with LPS would recapitulate the signaling modulation observed in vivo during bacterial challenge. BMDCs were treated overnight with LPS then briefly stimulated with cytokines and the responses of Stat1, Stat3, and Stat5 were determined (Fig. 5B). We found that, as with pathogen challenge in vivo, LPS inhibited IFNα and IL-6 induction of Stat1 phosphorylation. However, the IFNγ signaling response was maintained after LPS treatment, suggesting that IFNγ signaling modulation is dependent on an environmental factor (e.g., a secondary cell type) lacking under these in vitro conditions. Stat3 activation by IL-6 and IL-10 was also inhibited by LPS, as was observed after in vivo challenge with bacteria. The Stat5 response to GM-CSF was unaffected by LPS, which coordinates with our finding that during in vivo E. coli challenge dendritic cells maintained this signaling axis. Thus, in vitro TLR activation recapitulated much of the signaling profile observed with whole bacteria in vivo, though some differences existed.
As T cells are not known to directly detect LPS, we theorized that the dampened Stat1 response observed in vivo was mediated through a second cell type that expresses TLR4. BMDMs and purified splenic T cells were each treated with LPS or PAM3 for 6 hours then stimulated with a panel of Stat1-inducing cytokines. As observed when BMDCs were treated with LPS, LPS pre-treatment of BMDMs inhibited the Stat1 response to IFNα and IL-6, but not IFNγ (Fig. 5C). In addition, PAM3 completely blocked IL-6 induced Stat1 phosphorylation. However, unlike the response in APCs, purified T cells maintained virtually complete Stat1 signaling in response to cytokines even when pre-treated with the TLR agonists (Fig. 5C). To test the hypothesis that a secreted factor from macrophages modulated T cell signaling, we treated BMDMs with LPS or PAM3 and applied the conditioned media to purified T cells. T cells treated with macrophage supernatant were then assayed for Stat1 signaling modulation. In these cells, basal phospho-Stat1 levels were increased such that subsequent IFNα or IFNγ stimulation had negligible effects and the robust IL-6 response was ablated (Fig. 5D). These responses were virtually identical to those of T cells isolated from mice treated with either LPS or live bacteria. These results suggest that T cell immune-modulation by TLR agonists is mediated through secreted factor(s) from a secondary cell type rather than through direct detection of PAMPs.
To confirm that infected macrophages alone are sufficient to modulate signaling in bystander cells in vivo, we infected BMDMs with Listeria or LLO- Listeria ex vivo, and introduced these infected cells into recipient mice. LLO- Listeria is unable to escape the phagosome of the cell it infects; therefore, host leukocytes should not directly recognize the avirulent bacteria in this experiment. Six hours after introducing infected macrophages into mice, splenocytes were recovered and the Stat1 response to IFNα, IFNγ, and IL-6 was measured. Macrophages infected by either Listeria strain inhibited the IL-6 response in T cells (Fig. 5E). In addition, Stat1 activation by IFNγ in B and T cells was curtailed, though this inhibition was significant only with the LLO- Listeria-infected macrophages in B cells. However, the IFNα response was maintained and phospho-Stat1 levels in unstimulated cells were not elevated, differing from the results of intravenous administration of either Listeria strain (Fig. 2 and data not shown). These differences may be because fewer macrophages are exposed to bacteria when infected BMDMs are introduced into mice than when mice are directly challenged with bacteria, as we found that immune-modulation is dose dependent (Fig. 5A and data not shown). Alternatively, other cell types may also be required.
Bacteremia-induced signaling modulation is partially dependent on IL-6
Upon detecting bacteria or their PAMPs, macrophages secrete a multitude of cytokines with a distinct temporal pattern (reviewed in (3) and data not shown). Therefore, it is unlikely that a single element could exert the multifaceted modulation of signaling observed in bystander T cells. Given that IL-6 is a potent constituent of the cytokine milieu produced by activated macrophages and that we found IL-6 signaling to be globally down regulated during bacteremia, we sought to elucidate the role of IL-6 in the signaling profile observed.
Mice with an IL-6 gene deletion and wild-type C57Bl/6 were administered PBS, LLO- Listeria, or E. coli as described above. T cells from bacteremic wild-type mice were unresponsive to IL-6 as measured by phosphorylation of Stat1, Stat3, and Stat5. However, in the IL-6-/- mice, these three STAT proteins were responsive to IL-6 after bacterial challenge (Fig. 6A and Fig. 6B). This indicates that down regulation of IL-6 signaling in T cells during bacteremia is a form of negative feedback that requires IL-6 secretion. Macrophages from both bacteremic wild-type and IL-6-/- mice showed elevated phospho-Stat3 levels that did not change in response to IL-6 treatment (Fig. 6C). Therefore, dampened IL-6 signaling is IL-6 dependent in T cells, but is induced through an alternative means in macrophages. The Stat5 response to IL-21 in T cells from both C57Bl/6 and IL-6-/- mice was inhibited by E. coli challenge (Figure 6B), demonstrating that down regulation of IL-21 signaling does not require IL-6.
Figure 6. IL-6 attenuates subsequent IL-6 responses in CD4 T cells but not in macrophages during bacteremia.
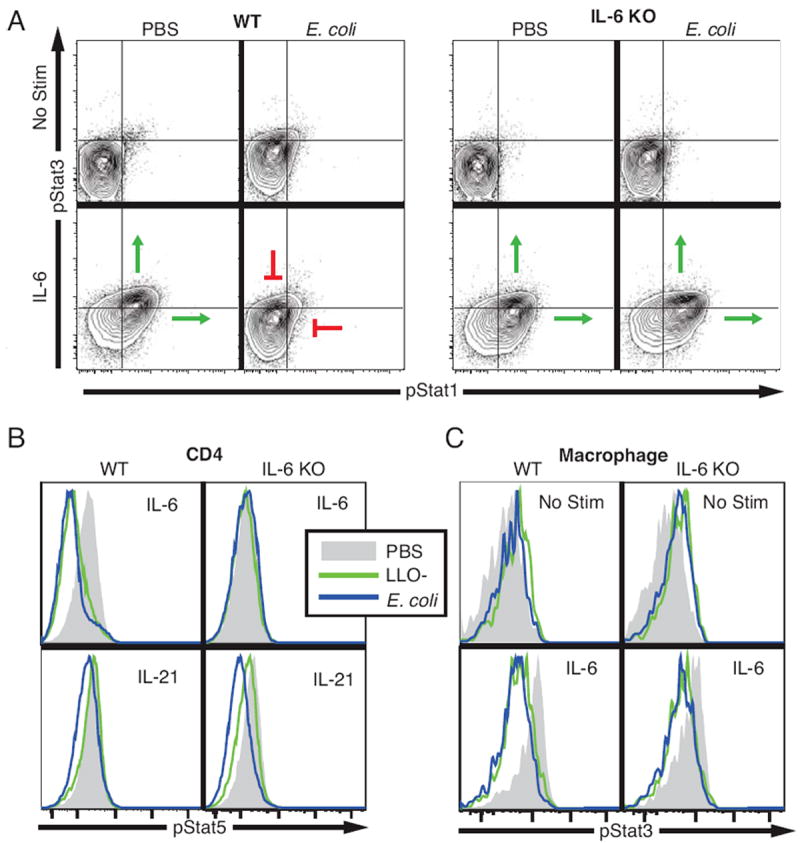
Two wild-type C57BL/6 and two IL-6-/- mice were intravenously injected with E. coli (2 × 10⁸ CFU), LLO- Listeria (2 × 10⁸ CFU), or PBS control. After six hours, splenocytes were harvested and stimulated with either IL-6 (40 ng/mL) or IL-21 (40 ng/mL) and the levels of pStat1, pStat3, and pStat5 determined in multiple cell types. (A) Contour plots of pStat1 and pStat3 in CD4 T cells from representative E. coli-challenged and control mice are shown in the unstimulated state and after IL-6 stimulation. Histograms of (B) pStat5 levels in CD4 T cells stimulated with IL-6 and L-21 and (C) pStat3 in unstimulated and IL-6-treated macrophages are shown. Each plot is representative of data from three independent experiments.
Negative feedback mechanisms are induced by bacteria
Several mechanisms are known by which cells decrease their potential for activation by cytokines. Among these are up-regulation of SOCS proteins and decreased expression of cytokine receptors at the cell surface. RT-PCR was used to assess SOCS transcript levels. RNA was extracted from total splenocytes and from CD4 T cells purified from the spleen six hours following bacterial challenge. In CD4 T cells, SOCS1 transcript was induced approximately 5-fold by both LLO- Listeria and E. coli compared to levels in cells isolated from control mice, while SOCS3 levels were increased 4-fold and 3-fold by E. coli and LLO- Listeria, respectively (Fig. 7A). Quantitatively similar SOCS transcript inductions were observed in the total splenic lysates, suggesting that up-regulation of SOCS gene levels during bacteremia is not restricted to CD4 T cells (which make up only ~30% of the spleen). This shows that a direct consequence of bacteremia is induction of negative regulation of cytokine signaling.
Figure 7. CD4 T cells from challenged mice have increased SOCS levels and reduced IL-6 receptor expression.
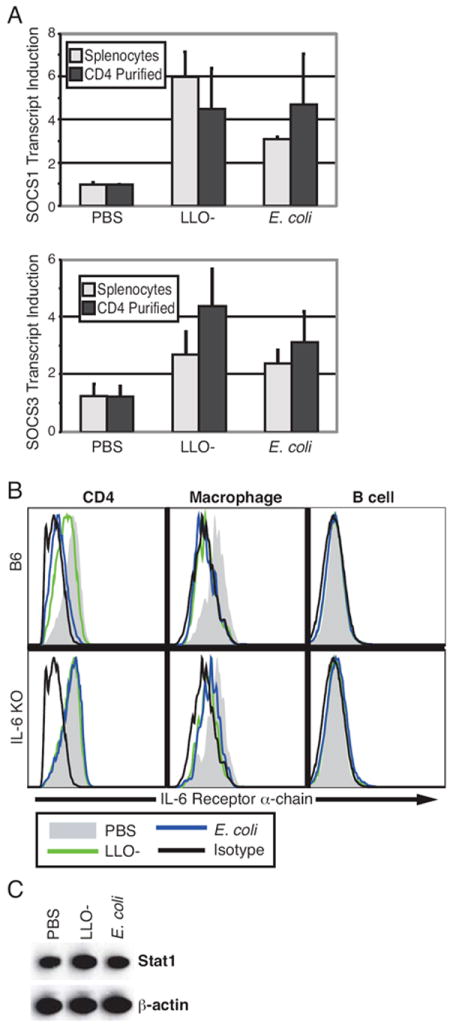
Six hours after challenge with E. coli (2 × 10⁸ CFU), LLO- Listeria (2 × 10⁸ CFU), or PBS control, splenocytes were collected from mice and CD4 T cells isolated by magnetic bead separation. (A) Real-time RT-PCR was used to quantify SOCS1 and SOCS3 transcript levels from either the entire splenocyte population or from CD4 T cells. Measurements were normalized to β-actin internal controls and fold induction compared to a control mouse was determined. The mean (± SD) from two mice per condition is presented as a bar graph; data is representative of three separate experiments. (B) Cells from wild-type C57BL/6 and IL-6-/- mice were stained with surface markers and IL-6Rα antibody and analyzed by flow cytometry. IL-6R levels from CD4 T cells, macrophages, and B cells from representative mice are shown. (C) Western blot analysis was performed on protein lysate from CD4+ cells isolated from the spleens of mice treated six hours with E. coli, LLO- Listeria, or PBS control. The expression of Stat1 and β-actin is representative of separate three mice.
The IL-6 receptor complex is composed of two subunits: IL-6Rα (CD126), which specifically recognizes IL-6 ligand, and the common signaling chain gp130 (21). Both E. coli and LLO- Listeria challenge decreased surface expression of IL-6Rα on CD4+ cells and macrophages from wild-type mice relative to that on cells from control mice (Fig. 7B). However, receptor levels were unchanged by bacteremia in CD4 T cells from IL-6-/- mice, providing additional evidence that attenuation of IL-6 signal transduction in T cells is primarily negative feedback regulation that is dependent on IL-6 secretion. In contrast to CD4 cells, macrophages from IL-6-/- mice and wild-type mice demonstrated similar responses to bacteria: IL-6Rα expression was reduced in both cases (Fig. 7B). B cells express very little IL-6Rα, thus statistically significant down regulation was not observed. These results correlate with the signaling data and show that, unlike that in T cells, modulation of IL-6 receptor levels in macrophages is independent of IL-6.
Another mechanism by which STAT signaling could be curtailed during bacteremia is by reduction in total protein levels. Protein was isolated from splenic CD4 T cells of mice challenged with LLO- Listeria or E. coli for Western blot analysis of Stat1. Stat1 expression in cells from bacteremic mice was not reduced in comparison to control mice (Fig. 7C). This indicates that the observed modulation in Stat1 signaling responsiveness is not regulated by protein degradation. Taken together, this data supports a model where bacteremia restricts Stat1 signaling potential in bystander T cells through induction of SOCS and cytokine receptor down regulation, but not Stat1 degradation (Fig. 8).
Figure 8. A model for signaling modulation in bystander T cells during bacteremia.

Macrophages exposed to bacteria (1) activate MAPK and NFκB signaling pathways and in turn exhibit restricted competence in subsequently activating these pathways. In addition, (2) surface expression of IL-6Rα is reduced and (3) macrophages secrete cytokines that (4) act on bystander T cells to induce STAT phosphorylation. In turn, (5) SOCS is up regulated and (6) IL-6 bound with its cognate receptor is endocytosed, as forms of negative feedback.
Signaling modulation is detectable in peripheral lymphocytes
Our in vivo experiments demonstrated that bacteremia inhibits STAT responsiveness to IL-6 in splenic T cells. To determine if this signaling phenotype was present systemically, peripheral blood was isolated by cardiac puncture from mice challenged with E. coli. As was observed with splenocytes, IL-6 stimulation induced Stat1 phosphorylation in circulating T cells from control mice but not E. coli challenged mice (Fig. 9). Therefore, bacteremia induced T cell signaling modulation is not restricted to the spleen, but can be detected systemically.
Figure 9. The Stat1 response to IL-6 was reduced in peripheral blood T cells from E. coli-challenged mice.

Mice were intravenously administered 2 × 10⁸ CFU of E. coli or PBS control. Blood was collected after six hours by cardiac puncture and the Stat1 response to IL-6 (40 ng/mL) determined. The contour plots are representative of two experiments with 2 or 3 mice each.
Discussion
It has long been understood that endotoxic shock in mice treated with an overwhelming influx of bacteria or bacterial components is the consequence of a detrimentally cascading immune reaction. The classical observation of endotoxin tolerance, whereby pre-challenge with small doses of endotoxin curtails the effects of subsequent pyrogenic and lethal doses (22-24), demonstrates that the immune response during endotoxemia features elements of negative regulation. In vitro experiments have revealed that macrophages pre-treated with bacteria or LPS have reduced signaling capabilities through MAPK, NFκB, and specific JAK/STAT pathways (25-27). These events have rapid transcriptional consequences that can be monitored by analysis of phosphorylation surrogates. For example, Listeria-infected macrophages produce IFNβ, which leads to Stat1 phosphorylation within 30 minutes (28); in turn, SOCS3 is up regulated resulting in abrogated Stat1 Y701 phosphorylation in response to stimulation with exogenous IFNγ (18).
One prominent finding from analysis of this profile of signaling in bacteremic mice is that immuno-signaling was rapidly attenuated. Macrophage responses to TLR agonists through the MAPK and NFκB pathways were also rapidly curtailed. Notably, the ability of a specific subset of cytokines to activate Stat1, Stat3, and Stat5 was reduced across cell types. We interpret these results to mean that an important outcome of the initiation of the immune response is rapid activation of negative feedback. This negative regulation likely maintains balance within the immune system, preventing a cytokine storm during a normal infection that could be detrimental to the host while generating pro-inflammatory cytokines to combat infection (29). For example, SOCS1 knockout mice, which exhibit hindered negative feedback, are more susceptible to endotoxic shock than wild-type mice and their macrophages respond to in vitro LPS with stronger MAPK and NFκB pathway activation (30). Our single cell signaling results are in accord with those findings in that we show that splenic macrophages directly isolated from mice intravenously challenged with bacteria display reduced MAPK and NFκB pathway signaling upon TLR activation compared to macrophages isolated from control mice.
The reduced signaling potential of various STATs to IL-6 was particularly profound. IL-6 signaling is initiated when the cytokine binds its cognate receptor, IL-6Rα. Ligand-bound IL-6Rα associates with gp130, causing gp130 dimerization that results in JAK/STAT pathway phosphorylation and activation (21). After ligand binding, the IL-6 receptor complex undergoes endocytosis, thus reducing surface expression of IL-6Rα (21, 31). However, it has been suggested that receptor endocytosis is not the predominant cause of negative feedback of IL-6 signaling (32). We observed a tight correlation between IL-6Rα down regulation and dampened STAT responses to IL-6, with E. coli initiating both of these effects more robustly than LLO- Listeria. This finding does not rule out other mechanisms for IL-6 signaling regulation. For example, SOCS3 is known to inhibit IL-6 signaling by binding pY759 of gp130 (33) and we found that SOCS3 transcript levels were increased in splenocytes of bacteremic mice compared to those of control mice.
Experiments with IL-6-/- mice provided further insight into IL-6 signaling regulation. We found that T cell signaling modulation was dependent on secreted factors from APCs and that in IL-6-/- mice IL-6 signaling was unaffected. Thus, we conclude that during bacteremia activated APCs secrete IL-6 that acts on bystander cells to inhibit IL-6 responsiveness. In contrast, macrophages from bacteremic IL-6-/- mice were less responsive than uninfected mice to IL-6. This shows that upon in vivo detection of bacteria, the macrophage signaling network is reprogrammed to lose IL-6 responsiveness independent of IL-6 autocrine signaling. It was previously shown that in vitro Stat3 activation by IL-6 is abolished in primary human macrophages concurrently treated with LPS, independent of gene transcription (26). These authors speculated that this signaling inhibition was mediated by the phosphatase SHP2; TLR activation is also known to directly induce SOCS3 expression (34). We propose that IL-6 signaling is also directly down regulated when macrophages detect bacterial threat, because macrophages from bacteremic mice exhibited reduced IL-6Rα expression independent of IL-6 treatment. This finding also demonstrates that there is a mechanism for IL-6Rα receptor regulation independent of ligand-mediated endocytosis that is induced when macrophages encounter bacteria in vivo.
Both IL-6 and IL-10 primarily activate Stat3 in macrophages, but with different biological outcomes; IL-6 is primarily pro-inflammatory whereas IL-10 is generally characterized as anti-inflammatory (35). The IL-10 receptor is not known to be inhibited by SOCS3 (26). We therefore predicted that IL-10 signaling would be unchanged during bacteremia. However, macrophage Stat3 responsiveness to IL-10 was dampened significantly compared to that of controls (LLO- Listeria: 66% of control, E. coli: 62% of control), albeit much less than the inhibition of IL-6 (LLO- Listeria: 32% of control, E. coli: 34% of control). Therefore, during bacteremia Stat3 retains partial potential to respond to IL-10 whereas the response to IL-6 is completely inhibited.
It was previously demonstrated that the IFNγ signaling through Stat1 is inhibited in antigen specific cytotoxic T cells during avirulent ActA- Listeria infection (13). Here we show that rapid inhibition of Stat1 signaling in response to bacteria does not depend on antigen-specific activation of the T cell receptor, because the intracellular signaling network of all bystander T cells is reprogrammed. This reprogramming may influence the outcome of the adaptive immune response. For example, SOCS1 has been implicated in inhibiting TCR signaling by targeting ZAP70 (36), whereas SOCS3 and SOCS5 are associated with Th2 and Th1 differentiation, respectively (37). We found that SOCS1 and SOCS3 were globally induced in CD4 T cells during bacterial challenge; this may be a mechanism for the determination of the fate of T cell activation prior to TCR stimulation. Similarly, IL-6 signaling is required for Th17 biasing (38) and drives helper T cell function to promote B cell antibody secretion (39, 40), so the lack of IL-6 responsiveness in CD4 T cells during bacteremia may affect these processes. Additional study will be needed to determine the functional consequences of bacteria-induced modulation of T cell signaling networks on adaptive immunity.
In addition to adaptive immunity, T cells also contribute towards innate defenses. In murine studies, T cell apoptosis during infection hinders innate immunity (41). In contrast, CD8 and non-regulatory CD4 T cells appear to play a role in curtailing a TLR3-mediated cytokine storm independent of antigen specificity (42). It is known that LPS injection induces global T cell activation as measured by up-regulation of multiple surface markers, including CD69 and Ly6A/E (43, 44). In addition, LPS and bacteria trigger memory CD8+ T cells to proliferate and produce IFNγ (44-46). These effects are not mediated via direct detection of LPS by T cells, but rather through secondary signaling molecules such as type I IFN, IL-12, IL-18, and IFNγ (43, 45). Recently it was reported that CD4 T cells secrete TNFα and IFNγ independent of antigen presentation during bacterial infection when given a secondary challenge (47). Thus, evidence suggests that, despite the fact that T cells do not directly detect bacteria, reprogramming of the T cell intracellular signaling network during bacteremia may have important functional consequences.
By examining the effect of different bacterial species on multiple signaling pathways, we mapped Gram positive Listeria and Gram negative E. coli to unique regions in phospho-space—a multi-dimensional representation of key signaling events consisting of all phospho-protein responses to stimulations across all cell types. For example, Gram negative E. coli attenuated CD4 T cell IL-6 signaling and inhibited the GM-CSF response in macrophages to a larger degree than did the Gram positive organism. This demonstrates that the outcome of rapid immune system signaling modulation depends on the pathogenic insult, and as such clinical responses might need to be designed and adjusted accordingly. In addition, individual pathways are differentially modulated in the different cell types. This reflects not only the coordinated regulation of effector mechanisms, but that some pathways may have differential clinical relevance that could be specifically targeted as part of intervention. As such, this data suggests that a rapid assay for the status of immune system signal transduction may ultimately be used to indicate the stage of sepsis and whether the infection is due to a Gram positive or a Gram negative organism. Since the effects of bacteria on immune cell signaling are readily detectable in peripheral blood, this suggests that rapid methods are at hand that hold promise for patient management as well as treatment.
Supplementary Material
Acknowledgments
We thank Peter Krutzik for guidance in conducting experiments, and Adrian Piliponsky for critical reading of the manuscript.
Footnotes
This work was supported by National Heart, Lung, and Blood Institute Contract N01-HV-28183 and National Institutes of Health Grant HHSN272200700038C. M.B.H. was supported by a National Science Foundation predoctoral fellowship.
Abbreviations used in this paper:
PAMP, pathogen associated molecular pattern; SOCS, suppressor of cytokine signaling; LLO, listeriolysin O; DC, dendritic cell; cDC, conventional DC; pDC, plasmacytoid DC; MFI, median fluorescence intensity; FSC, forward light scatter; SSC, side light scatter; Ax, Alexa fluorophore; PAM3, PAM3CysSK4; MAPKAPK-2, MAPK activated protein kinase-2; IKK; IκB kinase; BMDC, bone marrow-derived dendritic cells; BMDM, bone marrow-derived macrophages
References
- 1.Wang TS, Deng JC. Molecular and cellular aspects of sepsis-induced immunosuppression. J Mol Med. 2008;86:495–506. doi: 10.1007/s00109-007-0300-4. [DOI] [PubMed] [Google Scholar]
- 2.Sriskandan S, Altmann DM. The immunology of sepsis. J Pathol. 2008;214:211–223. doi: 10.1002/path.2274. [DOI] [PubMed] [Google Scholar]
- 3.Kawai T, Akira S. TLR signaling. Semin Immunol. 2007;19:24–32. doi: 10.1016/j.smim.2006.12.004. [DOI] [PubMed] [Google Scholar]
- 4.Heeg K, Dalpke A. TLR-induced negative regulatory circuits: role of suppressor of cytokine signaling (SOCS) proteins in innate immunity. Vaccine. 2003;21(Suppl 2):S61–67. doi: 10.1016/s0264-410x(03)00202-0. [DOI] [PubMed] [Google Scholar]
- 5.Agrawal S, Agrawal A, Doughty B, Gerwitz A, Blenis J, Van Dyke T, Pulendran B. Cutting edge: different Toll-like receptor agonists instruct dendritic cells to induce distinct Th responses via differential modulation of extracellular signal-regulated kinase-mitogen-activated protein kinase and c-Fos. J Immunol. 2003;171:4984–4989. doi: 10.4049/jimmunol.171.10.4984. [DOI] [PubMed] [Google Scholar]
- 6.Durand V, Wong SY, Tough DF, Le Bon A. Shaping of adaptive immune responses to soluble proteins by TLR agonists: a role for IFN-alpha/beta. Immunol Cell Biol. 2004;82:596–602. doi: 10.1111/j.0818-9641.2004.01285.x. [DOI] [PubMed] [Google Scholar]
- 7.Krutzik PO, Irish JM, Nolan GP, Perez OD. Analysis of protein phosphorylation and cellular signaling events by flow cytometry: techniques and clinical applications. Clin Immunol. 2004;110:206–221. doi: 10.1016/j.clim.2003.11.009. [DOI] [PubMed] [Google Scholar]
- 8.Irish JM, Hovland R, Krutzik PO, Perez OD, Bruserud O, Gjertsen BT, Nolan GP. Single cell profiling of potentiated phospho-protein networks in cancer cells. Cell. 2004;118:217–228. doi: 10.1016/j.cell.2004.06.028. [DOI] [PubMed] [Google Scholar]
- 9.Lutz MB, Kukutsch N, Ogilvie AL, Rossner S, Koch F, Romani N, Schuler G. An advanced culture method for generating large quantities of highly pure dendritic cells from mouse bone marrow. J Immunol Methods. 1999;223:77–92. doi: 10.1016/s0022-1759(98)00204-x. [DOI] [PubMed] [Google Scholar]
- 10.Portnoy DA, Jacks PS, Hinrichs DJ. Role of hemolysin for the intracellular growth of Listeria monocytogenes. J Exp Med. 1988;167:1459–1471. doi: 10.1084/jem.167.4.1459. [DOI] [PMC free article] [PubMed] [Google Scholar]
- 11.Portnoy DA, Auerbuch V, Glomski IJ. The cell biology of Listeria monocytogenes infection: the intersection of bacterial pathogenesis and cell-mediated immunity. J Cell Biol. 2002;158:409–414. doi: 10.1083/jcb.200205009. [DOI] [PMC free article] [PubMed] [Google Scholar]
- 12.Krutzik PO, Nolan GP. Intracellular phospho-protein staining techniques for flow cytometry: monitoring single cell signaling events. Cytometry A. 2003;55:61–70. doi: 10.1002/cyto.a.10072. [DOI] [PubMed] [Google Scholar]
- 13.Haring JS, Corbin GA, Harty JT. Dynamic regulation of IFN-gamma signaling in antigen-specific CD8+ T cells responding to infection. J Immunol. 2005;174:6791–6802. doi: 10.4049/jimmunol.174.11.6791. [DOI] [PubMed] [Google Scholar]
- 14.Viatour P, Merville MP, Bours V, Chariot A. Phosphorylation of NF-kappaB and IkappaB proteins: implications in cancer and inflammation. Trends Biochem Sci. 2005;30:43–52. doi: 10.1016/j.tibs.2004.11.009. [DOI] [PubMed] [Google Scholar]
- 15.Yang F, Tang E, Guan K, Wang CY. IKK beta plays an essential role in the phosphorylation of RelA/p65 on serine 536 induced by lipopolysaccharide. J Immunol. 2003;170:5630–5635. doi: 10.4049/jimmunol.170.11.5630. [DOI] [PubMed] [Google Scholar]
- 16.Gogos CA, Drosou E, Bassaris HP, Skoutelis A. Pro- versus anti-inflammatory cytokine profile in patients with severe sepsis: a marker for prognosis and future therapeutic options. J Infect Dis. 2000;181:176–180. doi: 10.1086/315214. [DOI] [PubMed] [Google Scholar]
- 17.Riley JK, Takeda K, Akira S, Schreiber RD. Interleukin-10 receptor signaling through the JAK-STAT pathway. Requirement for two distinct receptor-derived signals for anti-inflammatory action. J Biol Chem. 1999;274:16513–16521. doi: 10.1074/jbc.274.23.16513. [DOI] [PubMed] [Google Scholar]
- 18.Stoiber D, Stockinger S, Steinlein P, Kovarik J, Decker T. Listeria monocytogenes modulates macrophage cytokine responses through STAT serine phosphorylation and the induction of suppressor of cytokine signaling 3. J Immunol. 2001;166:466–472. doi: 10.4049/jimmunol.166.1.466. [DOI] [PubMed] [Google Scholar]
- 19.Szabo SJ, Dighe AS, Gubler U, Murphy KM. Regulation of the interleukin (IL)-12R beta 2 subunit expression in developing T helper 1 (Th1) and Th2 cells. J Exp Med. 1997;185:817–824. doi: 10.1084/jem.185.5.817. [DOI] [PMC free article] [PubMed] [Google Scholar]
- 20.Nguyen KB, Watford WT, Salomon R, Hofmann SR, Pien GC, Morinobu A, Gadina M, O’Shea JJ, Biron CA. Critical role for STAT4 activation by type 1 interferons in the interferon-gamma response to viral infection. Science. 2002;297:2063–2066. doi: 10.1126/science.1074900. [DOI] [PubMed] [Google Scholar]
- 21.Vardam TD, Zhou L, Appenheimer MM, Chen Q, Wang WC, Baumann H, Evans SS. Regulation of a lymphocyte-endothelial-IL-6 trans-signaling axis by fever-range thermal stress: hot spot of immune surveillance. Cytokine. 2007;39:84–96. doi: 10.1016/j.cyto.2007.07.184. [DOI] [PMC free article] [PubMed] [Google Scholar]
- 22.Beeson P. Tolerance to bacterial pyrogens. I. Factors influencing its development. J Exp Med. 1947;86:29–38. doi: 10.1084/jem.86.1.29. [DOI] [PMC free article] [PubMed] [Google Scholar]
- 23.Berry LJ, Smythe DS. Some metabolic aspects of tolerance to bacterial endotoxin. J Bacteriol. 1965;90:970–977. doi: 10.1128/jb.90.4.970-977.1965. [DOI] [PMC free article] [PubMed] [Google Scholar]
- 24.Mathison JC, Wolfson E, Ulevitch RJ. Participation of tumor necrosis factor in the mediation of gram negative bacterial lipopolysaccharide-induced injury in rabbits. J Clin Invest. 1988;81:1925–1937. doi: 10.1172/JCI113540. [DOI] [PMC free article] [PubMed] [Google Scholar]
- 25.Medvedev AE, Sabroe I, Hasday JD, Vogel SN. Tolerance to microbial TLR ligands: molecular mechanisms and relevance to disease. J Endotoxin Res. 2006;12:133–150. doi: 10.1179/096805106X102255. [DOI] [PubMed] [Google Scholar]
- 26.Niemand C, Nimmesgern A, Haan S, Fischer P, Schaper F, Rossaint R, Heinrich PC, Muller-Newen G. Activation of STAT3 by IL-6 and IL-10 in primary human macrophages is differentially modulated by suppressor of cytokine signaling 3. J Immunol. 2003;170:3263–3272. doi: 10.4049/jimmunol.170.6.3263. [DOI] [PubMed] [Google Scholar]
- 27.Nakagawa R, Naka T, Tsutsui H, Fujimoto M, Kimura A, Abe T, Seki E, Sato S, Takeuchi O, Takeda K, Akira S, Yamanishi K, Kawase I, Nakanishi K, Kishimoto T. SOCS-1 participates in negative regulation of LPS responses. Immunity. 2002;17:677–687. doi: 10.1016/s1074-7613(02)00449-1. [DOI] [PubMed] [Google Scholar]
- 28.Stockinger S, Reutterer B, Schaljo B, Schellack C, Brunner S, Materna T, Yamamoto M, Akira S, Taniguchi T, Murray PJ, Muller M, Decker T. IFN regulatory factor 3-dependent induction of type I IFNs by intracellular bacteria is mediated by a TLR- and Nod2-independent mechanism. J Immunol. 2004;173:7416–7425. doi: 10.4049/jimmunol.173.12.7416. [DOI] [PubMed] [Google Scholar]
- 29.Matsukawa A. STAT proteins in innate immunity during sepsis: lessons from gene knockout mice. Acta Med Okayama. 2007;61:239–245. doi: 10.18926/AMO/32897. [DOI] [PubMed] [Google Scholar]
- 30.Kinjyo I, Hanada T, Inagaki-Ohara K, Mori H, Aki D, Ohishi M, Yoshida H, Kubo M, Yoshimura A. SOCS1/JAB is a negative regulator of LPS-induced macrophage activation. Immunity. 2002;17:583–591. doi: 10.1016/s1074-7613(02)00446-6. [DOI] [PubMed] [Google Scholar]
- 31.Dittrich E, Haft CR, Muys L, Heinrich PC, Graeve L. A di-leucine motif and an upstream serine in the interleukin-6 (IL-6) signal transducer gp130 mediate ligand-induced endocytosis and down-regulation of the IL-6 receptor. J Biol Chem. 1996;271:5487–5494. doi: 10.1074/jbc.271.10.5487. [DOI] [PubMed] [Google Scholar]
- 32.Thiel S, Sommer U, Kortylewski M, Haan C, Behrmann I, Heinrich PC, Graeve L. Termination of IL-6-induced STAT activation is independent of receptor internalization but requires de novo protein synthesis. FEBS Lett. 2000;470:15–19. doi: 10.1016/s0014-5793(00)01276-x. [DOI] [PubMed] [Google Scholar]
- 33.Schmitz J, Weissenbach M, Haan S, Heinrich PC, Schaper F. SOCS3 exerts its inhibitory function on interleukin-6 signal transduction through the SHP2 recruitment site of gp130. J Biol Chem. 2000;275:12848–12856. doi: 10.1074/jbc.275.17.12848. [DOI] [PubMed] [Google Scholar]
- 34.Bode JG, Nimmesgern A, Schmitz J, Schaper F, Schmitt M, Frisch W, Haussinger D, Heinrich PC, Graeve L. LPS and TNFalpha induce SOCS3 mRNA and inhibit IL-6-induced activation of STAT3 in macrophages. FEBS Lett. 1999;463:365–370. doi: 10.1016/s0014-5793(99)01662-2. [DOI] [PubMed] [Google Scholar]
- 35.Moore KW, de Waal Malefyt R, Coffman RL, O’Garra A. Interleukin-10 and the interleukin-10 receptor. Annu Rev Immunol. 2001;19:683–765. doi: 10.1146/annurev.immunol.19.1.683. [DOI] [PubMed] [Google Scholar]
- 36.Okugawa S, Yanagimoto S, Tsukada K, Kitazawa T, Koike K, Kimura S, Nagase H, Hirai K, Ota Y. Bacterial flagellin inhibits T cell receptor-mediated activation of T cells by inducing suppressor of cytokine signalling-1 (SOCS-1) Cell Microbiol. 2006;8:1571–1580. doi: 10.1111/j.1462-5822.2006.00731.x. [DOI] [PubMed] [Google Scholar]
- 37.Kubo M, Inoue H. Suppressor of cytokine signaling 3 (SOCS3) in Th2 cells evokes Th2 cytokines, IgE, and eosinophilia. Curr Allergy Asthma Rep. 2006;6:32–39. doi: 10.1007/s11882-006-0007-6. [DOI] [PubMed] [Google Scholar]
- 38.Yang XO, Panopoulos AD, Nurieva R, Chang SH, Wang D, Watowich SS, Dong C. STAT3 regulates cytokine-mediated generation of inflammatory helper T cells. J Biol Chem. 2007;282:9358–9363. doi: 10.1074/jbc.C600321200. [DOI] [PubMed] [Google Scholar]
- 39.Eddahri F, Denanglaire S, Bureau F, Spolski R, Leonard WJ, Leo O, Andris F. Interleukin-6 / STAT3 signalling regulates the ability of naive T cells to acquire B cell help capacities. Blood. 2008;113:2466–33. doi: 10.1182/blood-2008-04-154682. [DOI] [PMC free article] [PubMed] [Google Scholar]
- 40.Dienz O, Eaton SM, Bond JP, Neveu W, Moquin D, Noubade R, Briso EM, Charland C, Leonard WJ, Ciliberto G, Teuscher C, Haynes L, Rincon M. The induction of antibody production by IL-6 is indirectly mediated by IL-21 produced by CD4+ T cells. J Exp Med. 2009;206:69–78. doi: 10.1084/jem.20081571. [DOI] [PMC free article] [PubMed] [Google Scholar]
- 41.Carrero JA, Calderon B, Unanue ER. Lymphocytes are detrimental during the early innate immune response against Listeria monocytogenes. J Exp Med. 2006;203:933–940. doi: 10.1084/jem.20060045. [DOI] [PMC free article] [PubMed] [Google Scholar]
- 42.Kim KD, Zhao J, Auh S, Yang X, Du P, Tang H, Fu YX. Adaptive immune cells temper initial innate responses. Nat Med. 2007;13:1248–1252. doi: 10.1038/nm1633. [DOI] [PMC free article] [PubMed] [Google Scholar]
- 43.Kamath AT, Sheasby CE, Tough DF. Dendritic cells and NK cells stimulate bystander T cell activation in response to TLR agonists through secretion of IFN-alpha beta and IFN-gamma. J Immunol. 2005;174:767–776. doi: 10.4049/jimmunol.174.2.767. [DOI] [PubMed] [Google Scholar]
- 44.Tough DF, Sun S, Sprent J. T cell stimulation in vivo by lipopolysaccharide (LPS) J Exp Med. 1997;185:2089–2094. doi: 10.1084/jem.185.12.2089. [DOI] [PMC free article] [PubMed] [Google Scholar]
- 45.Kambayashi T, Assarsson E, Lukacher AE, Ljunggren HG, Jensen PE. Memory CD8+ T cells provide an early source of IFN-gamma. J Immunol. 2003;170:2399–2408. doi: 10.4049/jimmunol.170.5.2399. [DOI] [PubMed] [Google Scholar]
- 46.Berg RE, Forman J. The role of CD8 T cells in innate immunity and in antigen non-specific protection. Curr Opin Immunol. 2006;18:338–343. doi: 10.1016/j.coi.2006.03.010. [DOI] [PubMed] [Google Scholar]
- 47.Srinivasan A, Salazar-Gonzalez RM, Jarcho M, Sandau MM, Lefrancois L, McSorley SJ. Innate immune activation of CD4 T cells in salmonella-infected mice is dependent on IL-18. J Immunol. 2007;178:6342–6349. doi: 10.4049/jimmunol.178.10.6342. [DOI] [PubMed] [Google Scholar]
Associated Data
This section collects any data citations, data availability statements, or supplementary materials included in this article.