

Abstract
Background
Medical literature or clinical guidelines have not adequately addressed the ideal blood pressure (BP) treatment targets for survival and renal outcome.
Objective
To evaluate ranges of treated BP in a large hypertension population and compare risk of mortality and end stage renal disease (ESRD).
Methods
A retrospective cohort study within the Kaiser Permanente Southern California health system was performed from January 1, 2006 to December 31, 2010. Treated hypertensive individuals age >/=18 years were studied. Cox proportional hazards regression models were used to evaluate the risks (hazard ratios) for mortality and/or ESRD among different BP categories with and without stratification for diabetes mellitus (DM) and older age.
Results
Among 398,419 treated hypertensive individuals (30% with DM), mortality occurred in 25,182 (6.3%) and ESRD in 4,957 (1.2%). Adjusted HR (95% CI) for composite mortality/ESRD in systolic BPs <110, 110-119, 120-129, 140-149, 150-159, 160-169, and >/=170 compared to 130-139 mmHg were 4.1 (3.8,1.3), 1.8 (1.7,1.9), 1.1 (1.1,1.1), 1.4 (1.4,1.5), 2.3 (2.2,2.5), 3.3 (3.0,3.6), and 4.9 (4.4,5.5) respectively. Diastolic BPs 60-79 mmHg were associated with the lowest risk. The nadir systolic and diastolic BP for the lowest risk was 137 and 71 mmHg respectively. Stratified analyses revealed that the DM population had a similar HR curve but a lower nadir at 131 and 69 mmHg but age >/=70 had a higher nadir (140 and 70 mmHg).
Conclusions
Both higher and lower treated BPs compared to 130-139 mmHg systolic and 60-79 mmHg diastolic ranges had worsened outcomes. Our study adds to the growing uncertainty about BP treatment targets.
Background
As treatment and control rates of hypertension (HTN) continue to improve (1,2), discussions have centered on the most appropriate target blood pressures (BP) in treated hypertensive individuals, specifically related to how aggressively their HTN should be treated. Current treatment goals have been drafted with the assumption that there is a linear relationship between BP and risk for vascular and mortality outcomes. Lower observed BPs across all age groups have been associated with the greatest morbidity and survival benefits (3). These observations have led to conclusions that lowering BP along that linear axis will correspond with a proportionate decrease in risk (4). The perception has been the same for the risk of renal failure (5). Indeed, significant risk reductions have been demonstrated in prospective interventional studies that have lowered BPs in those with severe HTN (5-13). However, aggressive BP lowering has not convincingly shown benefit (14-19) and may actually predispose individuals to harm (20-24).
In high-risk populations, such as those with diabetes (DM) and chronic kidney disease (CKD), interventions to lower BPs below current target levels have not demonstrated outcome improvements (14,19,25). In fact, aggressive BP lowering has been associated with worsened outcomes, (20-22) suggestive of a J-shaped curve. This nonlinear curve is similar to what has already been observed in other cardiovascular disease risk factors (24,26). Thus, for the treated general HTN population, the relationship between treated BP and outcomes is not well-defined. We used a large ethnically diverse population of individuals who were medically treated for HTN to evaluate discrete ranges of achieved BP and subsequent risk for mortality and end-stage renal disease (ESRD).
Methods
A retrospective cohort study was performed among members of Kaiser Permanente Southern California (KPSC) during the period January 1, 2006 through December 31, 2010. KPSC is an integrated health system comprised of 14 medical centers and more than 200 satellite medical offices, with a membership exceeding 3.5 million people. The membership population is ethnically and socioeconomically diverse, reflecting the population of the state of California (27). KPSC complete healthcare encounters are tracked using 1 common electronic health record and are collected as part of routine clinical care encounters. KPSC Institutional Review Board approved the study protocol, which was exempt from informed consent.
The study population consisted of individuals 18 years of age and older who had a minimum of 6 months continuous membership in the health plan. The HTN study cohort was identified in a 2-year window (January 1, 2006-December 31, 2007) and followed up to December 31, 2010. HTN was identified as any member with 2 International Classifications of Diseases, Ninth Revision (ICD-9) codes, specific to HTN (401.xx, 402.xx, 403.xx, 404.xx, 405.xx). The accuracy of ICD-9 coding for the diagnosis of HTN has been previously validated (28). Recorded BP values at baseline when the cohort was initially identified and all subsequent BPs were retrieved. Inclusion criteria were hypertensive individuals who had a minimum of 1 outpatient BP measurement and documented prescription(s) for antihypertensive medications. Individuals were determined to be on an antihypertensive medication if it was prescribed and filled for 7 or more days within the observation period. Exclusion criteria were individuals <18 years of age, on dialysis or who had received a renal transplant, with no documented diagnosis of HTN, no documented BP, or no documented prescription for antihypertensive medications. Individuals with congestive heart failure also were excluded as their BP may not necessarily reflect treated BP values.
Co-morbidities, including DM, ischemic heart disease, congestive heart failure, and cerebrovascular disease, were determined on the basis of inpatient and outpatient ICD-9 diagnoses codes. CKD was defined as an estimated glomerular filtration rate (eGFR) <60 mL/min/1.73m2, calculated from serum creatinine levels and the CKD Epidemiology Collaboration equation (29). Obesity was defined as a body mass index (BMI) ≥30. Charlson co-morbidity index (CCI) scores also were calculated for each individual.
Kaiser Permanente HTN Management
Since 2005, KPSC has internally advocated and made available a simplified HTN treatment algorithm to guide therapy for all practitioners treating and managing HTN (30). We have previously described that a majority of the practitioners within KPSC follow the algorithm as demonstrated by medication prescription information (31-33). During the study period, HTN control rates in the KPSC population ranged 65-80% (30,31,33).
Outcomes
The primary outcome evaluated was a composite of mortality or ESRD. Since mortality is a strong competing risk for individuals who progress to ESRD (34), the composite outcome was studied to minimize confounding of mortality on ESRD. ESRD, defined as treatment with dialysis or renal transplantation, is captured within an internal KPSC database which includes all dialysis and renal transplant patients along with comprehensive clinical care information. Mortality information was obtained from hospitalization records, outside billing records, state vital statistics, and Social Security Administration death files. For the latter 2 sources, a probabilistic match was made based on name, address, birth date, Social Security Number (when available) and other demographic information. Because data from these latter sources may be delayed, December 31, 2010 was used to censor follow-up.
Secondary outcomes included ESRD and mortality separately as competing risks and in stratified analyses of those with or without DM, age <70 or >/=70 years, and CCI scores.
The arithmetic means of all outpatient BP values were used in the analyses. The values were then categorized into systolic BP (SBP) increments of 10 mmHg in the following manner: <110, 110-119, 120-129, 130-139, 140-149, 150-159, 160-169, >/=170. Similar analyses were performed using diastolic BP (DBP) increments of 10 mmHg in the following manner: <50, 50-59, 60-69, 70-79, 80-89, 90-99, and >/=100. Differences in the distributions of continuous and ordinal variables were tested using the Kruskal-Wallis test and for categorical variables, the Chi-square test. Given the large size of the population and data, no imputations were performed for any missing values (e.g., eGFR).
Cox proportional hazards regression models were used to calculate hazard ratios (HR) among different SBP categories for mortality, ESRD, and the composite of mortality/ESRD. The 130-139 and 80-89 mmHg categories were used as the reference category for SBP and DBP, respectively. Adjusted HRs were estimated adjusting for age, sex, race, BMI>/=30, CKD, DM, and comorbidities of ischemic heart disease and cerebrovascular disease. Proportionality assumptions were tested by both graphic approaches and the addition of interaction terms with time. A cubic spline smoothing technique was used to interpolate the overall trend of risks through the range of BPs. To determine the “nadir” point where the risk is lowest, a secondary analysis was performed by treating SBP/DBPs as continuous variables and included a quadratic term. These analyses were repeated in subgroups based on DM status, age, and CCI scores. All statistical analyses were performed using SAS Version 9.2 (SAS Institute Inc., Cary, North Carolina) statistical software. Results with p-values <0.05 were considered statistically significant.
Sensitivity Analysis
We performed sensitivity analyses using single baseline BPs defined as the values closest in date to the second ICD-9 coded HTN date. Subgroup analyses also were performed in those who died. BP values within 60 days of death were excluded in order to control for any residual confounding on BP from end of life. The averages BP before and within 60 days of death were also compared.
Different subpopulations were considered in additional sensitivity analyses. We performed separate analyses after removing those with eGFR<60 ml/min./1.73m2, thereby removing the confounding of CKD itself on ESRD/mortality risk. We also tested whether there was an interaction between pre-existing cardiovascular disease and BP on the outcomes studied. If there were significant interactions, BP variables were evaluated in those with and without cardiovascular disease. We also performed separate analyses, excluding all individuals with cancer or dementia diagnoses as deteriorating health status may confound the BP relationship.
Results
A total of 398,419 treated hypertensive individuals were identified for the study cohort and analyses (Figure 1). At baseline, the mean age of the population was 64 years. The cohort was comprised of 55% females, 41% whites, 12% blacks, and 21% Hispanics (Table 1). The mean BP for the cohort was 131/73 mmHg with standard deviations for SBP (11 mmHg) and DBP (8 mmHg), respectively. In those who died, the mean SBP decreased 7 mmHg during the 60 days prior to death [124 vs 131 mmHg (p<0.01)]. DBP differences were not as pronounced with a decrease of 3 mmHg [70 mmHg before and 67 mmHg within 60 days of mortality (p<0.01)]. Overall, 83% of the HTN population was considered controlled (<140 mmHg) during the observation period. BMI information was available in 99% of the study cohort (4,397 with missing BMI) and 43% were considered obese. The prevalence of co-morbidities were as follows; DM 30%, ischemic heart disease 19%, and cerebrovascular disease 8%. The mean serum creatinine and eGFR of the cohort were 1.0 mg/dl and 74 ml/min/1.73m2, respectively. Overall, 24% of the population had an eGFR below 60 ml/min/1.73m2.
Figure 1. Kaiser Permanente Southern California Treated Hypertension Study Cohort.
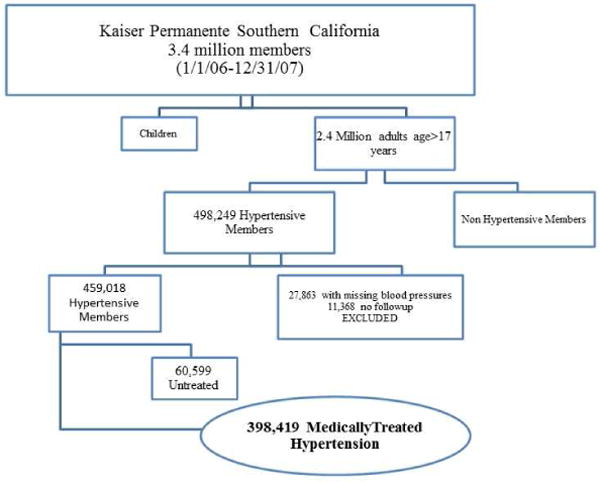
A total of 398,419 hypertensive individuals met inclusion criteria meaning that they were treated with hypertensive medicines and had documented BPs during the period of follow up to 12/31/2010.
Table 1. Characteristics of Treated Hypertension Cohort.
| Characteristics | All | <110 | 110-119 | 120-129 | 130-139 | 140-149 | 150-159 | 160-169 | >/=170 | P value |
|---|---|---|---|---|---|---|---|---|---|---|
|
|
||||||||||
| N | 398,419 | 6,531 | 43,865 | 138,958 | 141,582 | 49,463 | 12,682 | 3,641 | 1,697 | |
| Age | ||||||||||
| Mean (SD) | 64 | 66 (11) | 64 (11) | 64 (10) | 65 (11) | 65 (11) | 66 (12) | 65 (12) | 66 (11) | <0.001 |
| Median | 63 | 64 | 62 | 63 | 64 | 64 | 64 | 63 | 64 | |
| Gender | ||||||||||
| Female, % | 55 | 43 | 49 | 54 | 58 | 60 | 61 | 61 | 61 | <0.001 |
| Race | <0.001 | |||||||||
| White, % | 41 | 51 | 46 | 43 | 41 | 37 | 33 | 27 | 28 | |
| Black, % | 12 | 7 | 8 | 11 | 13 | 16 | 20 | 22 | 22 | |
| Hispanic, % | 21 | 19 | 20 | 20 | 21 | 23 | 23 | 23 | 24 | |
| Asian/Pacific, % | 8 | 10 | 10 | 9 | 7 | 6 | 5 | 5 | 5 | |
| Other, % | 17 | 13 | 15 | 17 | 17 | 18 | 19 | 22 | 21 | |
| Blood Pressure | ||||||||||
| SBP, mean (SD) | 131 | 106 | 116 | 126 | 134 | 144 | 154 | 164 | 179 | |
| DBP, mean (SD) | 73 | 63 | 68 | 72 | 75 | 77 | 80 | 84 | 89 | |
| BMI ≥ 30, % | 43 | 26 | 36 | 43 | 45 | 46 | 45 | 44 | 38 | <0.001 |
| Mean Creatinine (SD), mg/dl | 1.0 (0.4) | 1.1 (0.5) | 1.0 (0.4) | 1.0 (0.3) | 1.0 (0.3) | 1.0 (0.4) | 1.0 (0.5) | 1.1 (0.7) | 1.2 (0.8) | <0.001 |
| Mean eGFR (SD), ml/min/1.73m2 | 74 (20) | 72 (21) | 74 (20) | 75 (19) | 74 (19) | 73 (20) | 72 (22) | 71 (22) | 68 (23) | <0.001 |
| aChronic Kidney Disease, % | 24 | 28 | 24 | 23 | 23 | 26 | 28 | 29 | 33 | <0.001 |
| Diabetes mellitus, % | 30 | 40 | 36 | 32 | 27 | 29 | 33 | 34 | 33 | <0.001 |
| Ischemic Heart Disease, % | 19 | 43 | 39 | 27 | 16 | 10 | 8 | 9 | 19 | <0.001 |
| Cerebrovascular Disease, % | 8 | 25 | 19 | 12 | 7 | 4 | 4 | 5 | 8 | <0.001 |
SD = standard deviation
defined as eGFR <60ml/min/1.73m2
BMI = body mass index
SBP = systolic blood pressure
DBP = diastolic blood pressure
Medications administered to the patient cohort were generally reflective of the KPSC HTN treatment guidelines (Supplemental Table 1; Supplemental Figure 1). Diuretics (80%), angiotensin converting enzyme inhibitors (70%), beta-blockers (44%), and calcium channel blockers (37%) were the most frequently used antihypertensive medications.
Event Rates
A total of 28,919 (7.3%) individuals in the cohort reached the composite outcome of mortality or ESRD (Table 2). The mean and median lengths of follow-up were 4.0 and 4.5 years, respectively. The lowest and highest SBP groups had the greatest rates of mortality/ESRD (22.9 and 15.7%). Accounting for events separately, mortality occurred in 25,182 (6.3%) while ESRD occurred in 4,957 (1.2%). Mortality rates were higher in the lowest and highest SBPs as well. ESRD rates, however, appeared to increase across higher SBP categories (6.9% of individuals >/=170 mmHg). By contrast, there did not appear to be a disproportionate increase in ESRD with the lowest SBP groups (3.4% of individuals <110 mmHg).
Table 2. Crude Event rates per SBP and Length of follow up.
| All | <110 | 110-119 | 120-129 | 130-139 | 140-149 | 150-159 | 160-169 | >/=170 | |
|---|---|---|---|---|---|---|---|---|---|
|
|
|||||||||
| Event | N | ||||||||
| Mortality | 25,182 | 1,396 | 4,101 | 7,659 | 6,837 | 3,286 | 1,244 | 405 | 254 |
| (%) | 6.3 | 21.5 | 9.3 | 5.5 | 4.8 | 6.7 | 9.9 | 11.4 | 15.8 |
| ESRD | 4,957 | 159 | 486 | 1,166 | 1,381 | 1,010 | 435 | 203 | 117 |
| (%) | 1.2 | 2.4 | 1.1 | 0.8 | 1.0 | 2.0 | 3.4 | 5.6 | 6.9 |
| Mortality/ESRD | 28,919 | 1,494 | 4,402 | 8,486 | 7,908 | 4,107 | 1,595 | 571 | 356 |
| (%) | 7.3 | 22.9 | 10.0 | 6.1 | 5.6 | 8.3 | 12.6 | 15.7 | 21.0 |
| Length of follow up (years) | |||||||||
| Median | 4.5 | 4.1 | 4.5 | 4.5 | 4.5 | 4.4 | 4.1 | 3.8 | 3.0 |
| Mean | 4.0 | 3.5 | 4.0 | 4.1 | 4.1 | 3.9 | 3.5 | 3.2 | 2.8 |
Multivariable Regression Analyses
Adjusted HRs for composite mortality/ESRD outcomes using SBP 130-139 mmHg as reference demonstrated greater risk with higher and also lower SBPs (Figure 2, Table 3). With SBP modeled as a continuous variable and using a quadratic term, the calculated nadir for mortality/ESRD was 137 mmHg. DBPs revealed a wider range of optimal outcomes. Compared to DBP 80-89, the adjusted HR were lower for the range of 60-79. DBPs both lower and higher than the 60-79 range demonstrated worse outcomes (Table 4, Figure 3). The nadir DBP was estimated to be 71 mmHg. After removing those with cancer and dementia and then further adjusting for CCI scores (0, 1, and >/=2), eGFR and BMI as continuous variables, the mortality/ESRD HRs were 3.80 (3.52,4.11), 1.72 (1.63,1.80), 1.10 (1.06,1.15) 1.50 (1.43,1.58), 2.44 (2.27,2.62), 3.22 (2.88,3.61), and 5.02 (4.34,5.80) for SBPs <110, 110-119, 120-129, 140-149, 150-159, 160-169, and >169 mmHg, respectively compared to 130-139 mmHg.
Figure 2. Continuous Hazard Ratios for Mortality/ESRD across Systolic Blood Pressures.
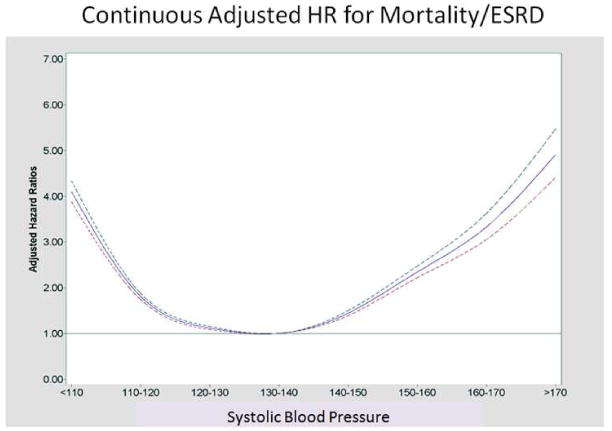
HR for Mortality/ESRD with 95% Confidence Intervals. The nadir SBP associated with the lowest risk was estimated at 137mmHg. A test on the relationship between the hazard ratios and quadratic term of the ordered BP levels gave significant result for non-linearity (p<0.001).
Table 3. Crude and Adjusted Hazards Ratios for Mortality/ESRD by SBP.
| Multivariate cox regression analysis (95% CI) for Mortality/ESRD by Systolic BP | |||
|---|---|---|---|
|
| |||
| Variable | Unadjusted HR (95% CI) | Adjusted HR (95% CI) | p-value |
| Systolic Blood Pressure | |||
| <110 | 5.00 (4.73,5.28) | 4.10 (3.87,4.33)* | <0.001 |
| 110-119 | 1.86 (1.79,1.93) | 1.81 (1.74,1.88) | <0.001 |
| 120-129 | 1.08 (1.05,1.11) | 1.12 (1.08,1.15) | <0.001 |
| 130-139 | - | - | - |
| 140-149 | 1.61 (1.55,1.67) | 1.44 (1.39,1.50) | <0.001 |
| 150-159 | 2.80 (2.65,2.95) | 2.34 (2.22,2.47) | <0.001 |
| 160-169 | 3.97 (3.64,4.32) | 3.33 (3.05,3.63) | <0.001 |
| >/= 170 | 6.41 (5.75,7.13) | 4.91 (4.41,5.47) | <0.001 |
| Age (every 5 year increase) | 1.49 (1.48,1.50) | 1.40 (1.39,1.41) | <0.001 |
| Male vs Female | 1.28 (1.25,1.31) | 1.33 (1.30,1.37) | <0.001 |
| Black vs White | 1.08 (1.04,1.11) | 1.23 (1.18,1.27) | <0.001 |
| DM | 1.50 (1.46,1.54) | 1.57 (1.37,1.61) | <0.001 |
| CKD | 3.13 (3.06,3.20) | 1.40 (1.53,1.43) | <0.001 |
| Cerebrovascular Disease | 2.75 (2.67,2.83) | 1.46 (1.41,1.50) | <0.001 |
| Ischemic Heart Disease | 2.16 (2.11,2.22) | 1.25 (1.22,1.28) | <0.001 |
Adjusted hazards ratios were estimated with adjustment for age, sex, race, BMI>/=30, CKD, DM and comorbidities of ischemic heart disease, and cerebrovascular disease.
Table 4. Adjusted Hazards Ratios based on Diastolic Blood Pressures.
| Multivariate cox regression analysis (95% CI) by Diastolic Blood Pressure | |||
|---|---|---|---|
|
| |||
| Mortality/ESRD Adjusted HR (95% CI) | Mortality Adjusted HR (95% CI) | ESRD Adjusted HR (95% CI) | |
|
|
|||
| Diastolic Blood Pressure | |||
| <50 | 3.14 (2.73,3.61) | 3.32 (2.88,3.83) | 2.54 (1.65,3.90) |
| 50-59 | 0.96 (0.91,1.02) | 0.98 (0.92,1.04) | 1.12 (0.98,1.27) |
| 60-69 | 0.72 (0.69,0.76) | 0.73 (0.69,0.76) | 0.82(0.74,0.90) |
| 70-79 | 0.70(0.67,0.73) | 0.71(0.68,0.74) | 0.72(0.66,0.79) |
| 80-89 | - | - | - |
| 90-99 | 1.92(1.73,2.13) | 1.99 (1.77,2.24) | 1.56 (1.26,1.92) |
| >/=100 | 3.83(3.04,4.83) | 3.65 (2.77,4.80) | 3.30 (2.18,5.00) |
Adjusted hazards ratios were estimated with adjustment for age, sex, race, BMI>/=30, CKD, DM and comorbidities of ischemic heart disease, and cerebrovascular disease.
Figure 3. Continuous Hazard Ratios across Diastolic Blood Pressures.
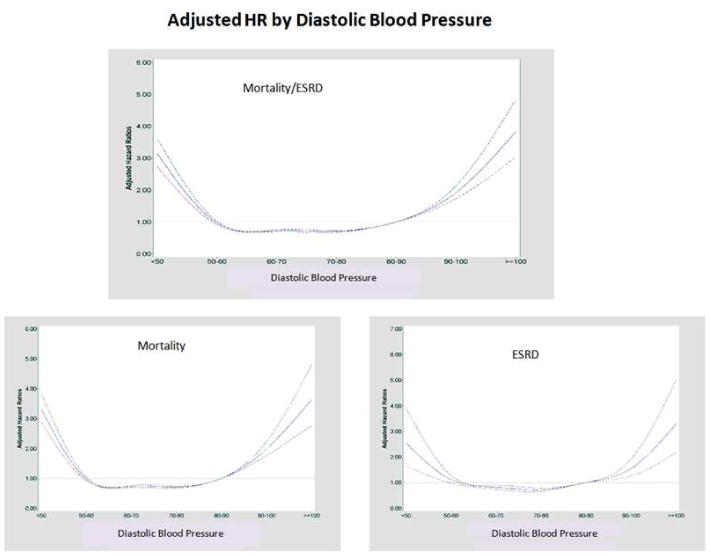
HR for Mortality/ESRD, mortality alone, and ESRD alone with 95% confidence intervals.
The mortality only analyses revealed a similar U-shaped trend (Figure 4, Supplemental Table 2). The ESRD only analyses suggested a more linear relationship (Figure 4, Supplemental Table 3). After removing those with cancer and dementia and then further adjusting for CCI scores (0, 1, and >/=2), eGFR, and BMI as continuous variables, the mortality HRs were 4.26 (3.92,4.63), 1.95 (1.84,2.05), 1.19 (1.14, 1.25), 1.34 (1.27,1.42), 2.12 (1.95,2.30), 2.43 (2.12,2.80), 3.72 (3.10,4.48) for SBPs <110, 110-119, 120-129, 140-149, 150-159, 160-169, and >169 mmHg, respectively compared to 130-139 mmHg.
Figure 4. Continuous Hazard Ratios for Mortality and ESRD across Systolic Blood Pressures.

HR for Mortality and ESRD with 95% Confidence Intervals
Stratified Analyses
The HRs for mortality/ESRD in individuals with DM were shifted to lower BPs experiencing better outcomes compared to non-diabetics. The nadir BPs in patients with DM were 131 and 69 mmHg for systolic and DBP, respectively as compared to 142 and 73 mmHg in non-diabetics (Table 5).
Table 5. Stratified Analysis: Hazards Ratios for Mortality/ESRD.
| Multivariate cox regression analysis (95% CI) for Mortality/ESRD by Systolic BP (Adjusted for age, race, gender, DM, HTN) | ||||
|---|---|---|---|---|
|
| ||||
| Diabetes | Non Diabetes | Age<70 | Age >/=70 | |
|
|
||||
| Variable | Adjusted HR (95% CI) | Adjusted HR (95% CI) | Adjusted HR (95% CI) | Adjusted HR (95% CI) |
| Systolic Blood Pressure | ||||
| <110 | 3.50 (3.20,3.82) | 4.62 (4.30,4.98) | 3.92 (3.55,4.32) | 4.13 (3.86,4.42) |
| 110-119 | 1.43 (1.35,1.52) | 2.12 (2.02,2.22) | 1.64 (1.54,1.75) | 1.90 (1.81,1.99) |
| 120-129 | 0.97 (0.92,1.02) | 1.23 (1.18,1.28) | 1.02 (0.96,1.07) | 1.19 (1.14,1.24) |
| 130-139 | - | - | - | - |
| 140-149 | 1.68 (1.58,1.78) | 1.29 (1.22,1.35) | 1.62 (1.52,1.73) | 1.33 (1.27,1.39) |
| 150-159 | 2.82 (2.59,3.04) | 1.98 (1.84,2.13) | 2.94 (2.69,3.22) | 1.99 (1.86,2.13) |
| 160-169 | 4.38 (3.89,4.93) | 2.53 (2.23,2.86) | 4.72 (4.13,5.39) | 2.56 (2.28,2.86) |
| >/= 170 | 6.85 (5.88,7.98) | 3.73 (3.20,4.35) | 8.24 (6.99,9.72) | 3.46 (3.00,3.98) |
Adjusted hazards ratios were estimated with adjustment for age, sex, race, BMI>/=30, CKD, DM and comorbidities of ischemic heart disease, and cerebrovascular disease.
When mortality alone was evaluated, non-diabetics appeared to have better survival in the higher ranges of BPs compared to the diabetic subpopulation (Figure 5, Supplemental Table 4). For the ESRD-only analyses, persons with DM experienced better outcomes in the lower ranges of BP compared to non-diabetics. However, persons with DM did worse with higher BPs compared to those without DM (Supplemental Table 5).
Figure 5. Continuous Hazard Ratios across Systolic Blood Pressures Stratified by DM Status.
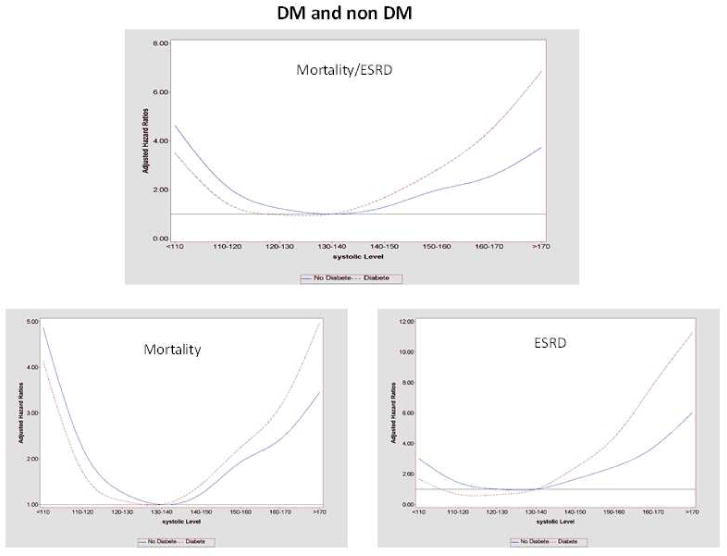
Stratified analyses comparing continuous HR in those with and without DM. For the composite mortality/ESRD outcome, the nadir SBP was 131 in DM and 142mmHG in non DM.
Age
The estimated nadirs of BP for mortality/ESRD in age >/=70 years were 140 and 70 mmHg for SBP and DBP, compared with younger individuals whose nadirs were 133 and 76 mmHg. For ESRD risk alone, age <70 group fared better with lower BP ranges compared with those age >/=70 but were more susceptible with higher BPs (Supplemental Table 5).
Charlson Co-morbidity Index
Compared to a CCI score of 1, the adjusted mortality/ESRD HR's were 0.43 (0.28,0.65) for CCI score of 0 and 1.49 (1.16,1.92) for CCI scores of 2 or higher. Adjusted mortality/ESRD HRs within individuals with CCI scores of 0, 1, and 2 or higher continued to demonstrate a similar BP curve. Mortality/ESRD HR for those with CCI 0 were 1.15, 0.49, 1.58, 2.54, 1.52, and 2.29 for SBPs 110-119, 120-129, 140-149, 150-159, 160-169, and >169 mmHg. For CCI 1, the mortality/ESRD HRs were 22.32, 1.64, 0.80, 1.24, 2.40, 7.31, and 9.16 compared to those with CCI 2 or higher, where the mortality/ESRD HRs were 3.78, 1.72, 1.10, 1.50, 2.44, 3.21, and 5.01 for SBPs <110, 110-119, 120-129, 140-149, 150-159, 160-169, and >169 mmHg, respectively compared to 130-139 mmHg (Supplemental Table 6).
Sensitivity Analyses
Baseline versus Averaged BP
Using single baseline BPs, the multivariable adjusted HR (95% CI) for ESRD/Mortality compared with SBPs 130-139 mmHg were 1.47 (1.39, 1.55), 1.15 (1.09, 1.21), 1.02 (0.97, 1.07) 1.08 (1.02, 1.14), 1.20 (1.13, 1.28), 1.21 (1.12, 1.31), and 1.52 (1.41, 1.63) for SBPs <110, 110-119, 120-129, 140-149, 150-159, 160-169, and >169 mmHg, respectively. Mortality alone HRs were 1.74 (1.63, 1.85), 1.27 (1.19, 1.35), 1.06 (1.00,1.12), 1.04 (0.97, 1.11), 1.12 (1.04, 1.21), 1.10 (1.00, 1.21), and 1.28 (1.16, 1.40). ESRD alone HRs were 1.07 (0.98, 1.18), 0.95 (0.87, 1.04), 0.96 (0.88, 1.04), 1.11 (1.02, 1.21), 1.27 (1.15, 1.40), 1.39 (1.23, 1.56), and 1.8 (1.64, 2.02) for the same BP ranges. After removing BPs within 60 days of those who experienced mortality or ESRD event, the adjusted HR's revealed a similar trend with mortality/ESRD HRs of 3.84 (3.62,4.07), 1.77 (1.71, 1.84), 1.10 (1.07,1.14), 1.46 (1.40,1.52), 2.36 (2.23,2.49), 3.24 (2.96, 3.54), and 4.72 (4.20,5.31) for SBPs <110, 110-119, 120-129, 140-149, 150-159, 160-169, and >169 mmHg, respectively.
Pre-existing cardiovascular disease
When tested, the interactions between ischemic heart disease and BP were significant for mortality (p<0.001) and combined mortality/ESRD (p<0.001). The interaction between cerebrovascular disease and BP were significant for mortality/ESRD only (p=0.02). The HR for mortality/ESRD outcomes were performed in those with and without pre-existing ischemic heart disease and also in those with and without cerebrovascular disease. Compared to those without cardiovascular disease and SBP 130-139 mmHg, the mortality/ESRD HRs in those with preexisting ischemic heart disease were 4.19, 2.21, 1.43, 1.36, 2.03, 3.73, 4.38, and 7.69; and in those with pre-existing cerebrovascular disease, the mortality/ESRD HR were 6.18, 2.33, 1.63, 1.44, 2.06, 2.74, 4.05, and 4.77 for SBPs <110, 110-119, 120-129, 130-139, 140-149, 150-159, 160-169, and >169 mmHg, respectively (Supplemental Table 7).
CKD
Every 10 mL/min/1.73m2 decline in eGFR was associated with a mortality/ESRD HR of 1.08 (1.07,1.09). Sensitivity analyses were performed after removing individuals with eGFR<60 ml/min./1.73m2 to examine the impact of pre-existing CKD. Essentially similar associations were observed when the CKD population was removed from the analyses (data not shown). Less than 1% (2,922) of the population had missing eGFR values. Urine protein quantitation was not performed or it was unavailable for the majority of the population (>80%).
Discussion
This observational study of a large diverse cohort of persons with medically treated HTN demonstrates that achieved BPs in both relatively higher and lower ranges are associated with worsened risk of mortality and ESRD. We observed a U-shaped curve for the composite outcome of mortality/ESRD at SBPs >139 and <130 mmHg (Central Illustration). There were incremental risk increases in both directions. DBPs <60 and >79 similarly had greater risk. The nadir BPs associated with the best outcome were 137 for systolic and 71 for diastolic. SBP and ESRD risk alone demonstrated a somewhat J-shaped curve with a lower risk in the SBP 110-139 range. However, this did not account for the competing risk of mortality and thus, may be misleading when ESRD alone is evaluated.
Central Illustration: Where are the ideal blood pressures in those treated for hypertension?

Legend: Cubic spline smoothing based on multi variable cox regression analyses demonstrating mortality/ESRD hazard ratios across ranges of blood pressure. Achieved systolic blood pressure range 130-139 and diastolic blood pressure range 60-79 mm Hg were associated with the best outcomes.
Our study population included large numbers of diabetics and individuals age ≥70 years. The stratified analyses in both DM and age >/=70 populations demonstrated a similar U-shaped risk curve. Clinical trials evaluating aggressive BP reduction have focused more on DM populations, and it has not been clear if those study results would apply to hypertensive non-diabetics. In our study, patients with DM overall had better outcomes at lower BPs as compared to non-diabetics, but their optimal BPs were still within the 130-139 mmHg systolic range.
Historically, lower observed BP has been associated with better survival from vascular disease and mortality outcomes (3,5). Interventional studies that reduced BP in extreme HTN populations have demonstrated significant improvement in morbidity and mortality in both DM and non-diabetics (5-13,35). This has led to large population-based initiatives to raise awareness about HTN and to implement strategies for HTN control. The emphasis has been to treat working on the assumption of “the lower the better”. Even as lower has been observed as better (3), it may not necessarily apply to the “treated” HTN population.
The setting of the ideal BP targets in the HTN population has not been satisfactorily addressed. While high BP is detrimental, the benefits of treatment have been demonstrated mostly at achieved SBPs >130 mmHg (5-13,35-37). Aggressive HTN treatment to very low BPs may have untoward consequences and at the expense of greater costs on the individual and the health delivery environment. In fact several studies have suggested worsened outcomes with relatively lower treated BPs (8,23), while others have suggested that there may be no proven benefit of treating those with mild HTN unless there is evidence of end organ damage (38,39). The recent 2014 evidence based guidelines for management of high blood pressure now suggest higher BP goals and threshold for treatment in those with DM, CKD, and age ≥60 years. However, we are unaware of any recommendations cautioning on thresholds for low treatment BPs.
Our study has several potential limitations that may affect the interpretation of our results. The achieved BPs may not necessarily reflect the treated goal BPs but instead represent a biomarker for a sicker population. One example of this limitation is the disproportionate prevalence of ischemic heart disease across the BP ranges. The tested interactions between ischemic heart disease and BP demonstrated significance implying that pre-existing cardiovascular disease may impact the HRs. Nevertheless, in separate analyses of the populations with and without cardiovascular disease, the HRs across BPs continued to demonstrate a U-shaped curve. Obesity was also highly prevalent in our population with 43% having a BMI>/=30. Our cohort also demonstrated an obesity paradox similar to that described in the past in other high-risk populations (41). Obesity had a protective effect where those who were obese (BMI>/=30) had a mortality/ESRD HR of 0.85 (0.83,0.88). Furthermore, every BMI increase of 5 was associated with mortality/ESRD HR of 0.87 (0.86,0.89).
Since BP declines toward the end of life (42), the average BP over the observation period may have confounding effects, as they may reflect the processes that lead to ESRD or death rather than the actual treated BPs. Indeed, the BPs within 60 days of death were significantly lower than BPs prior. We did perform several sensitivity analyses to control for such residual confounding. We used single baseline BP values instead of average BPs over time but continued to find a similar BP curve. We also performed cox regression analyses, after excluding BPs within 60 days of mortality or ESRD. However, these sensitivity analyses cannot account for confounding due to reverse causality where the near end-of-life state may lead to low BP.
The effect of medication treatment and duration on outcomes is a confounder that cannot be accounted for in this study. The different medicine classes and the number of medicines may have had additional pleotropic effects in addition to the BP-lowering effect. There is also confounding by indication for individuals who received different medicine classes or numbers of medicines that were not evaluated in our study. Physician bias may have been another limitation as patients that practitioners identified as more ill may have been seen more frequently and treated with more aggressive BP approaches. In addition, we were unable to fully account for variables, such as smoking, diet, and physical activity.
Despite these potential limitations, strengths of our study lie in the large, ethnically diverse, and gender-balanced HTN population that included large numbers of diabetics and elderly patients. The clinical encounter information including vital signs, medications, co-morbidities, and utilization data, were reliably captured for the cohort. In addition, the standardized treatment approaches for HTN lessen some of the confounding from heterogeneity among the individual practitioners.
Conclusions
We found that treated HTN patients with BPs in the range of 130-139 mm Hg systolic and 60-79 mm Hg diastolic experienced the lowest risk for the composite outcome of mortality and ESRD. Individuals with either higher or lower BPs departing from these ranges were found to be at greater risk for these outcomes. While current U.S. guidelines emphasize the upper limits of therapeutic goals (36), the potential dangers of overtreatment may need to be considered. In the current HTN management environment, both escalation and withdrawal of medications may be appropriate for optimal outcomes in an HTN population.
Perspectives
Competency in Medical Knowledge
Treatment of hypertension reduces morbidity and mortality, but optimum blood pressure targets have not been clearly defined.
Competency in Patient Care
Compared to blood pressure ranges of 130-139 mmHg systolic and 60-79 mmHg diastolic, both higher and lower pressure ranges are associated with worse outcomes in hypertensive patients on treatment.
Translational Outlook 1
Additional studies are necessary to determine whether the target blood pressure associated with optimum outcomes varies with the type of antihypertensive therapy employed.
Supplementary Material
Acknowledgments
Financial Support: This study was supported by Kaiser Permanente Southern California Regional Research and a research grant from the National Institute of Diabetes, Digestive and Kidney Disease the grant R01 DK078106 (KKZ, CPK, SJJ). Additional support was also provided by the National Institute of Health grants K24-DK091419 (KKZ) and R01-DK096920 (CPK, KKZ).
Abbreviations
- ESRD
end-stage renal disease
- DM
diabetes mellitus
- HTN
hypertension
- BP
blood pressure
- CKD
chronic kidney disease
- KPSC
Kaiser Permanente Southern California
- eGFR
estimated glomerular filtration rate
- BMI
body mass index
- HR
hazards ratio
- HTN
hypertension
- CCI
Charlson co-morbidity index
Footnotes
Disclosure: No other authors have any conflicts of interest relevant to this manuscript.
Publisher's Disclaimer: This is a PDF file of an unedited manuscript that has been accepted for publication. As a service to our customers we are providing this early version of the manuscript. The manuscript will undergo copyediting, typesetting, and review of the resulting proof before it is published in its final citable form. Please note that during the production process errors may be discovered which could affect the content, and all legal disclaimers that apply to the journal pertain.
References
- 1.Cutler JA, Sorlie PD, Wolz M, et al. Trends in hypertension prevalence, awareness, treatment, and control rates in United States adults between 1988-1994 and 1999-2004. Hypertension. 2008;52:818–27. doi: 10.1161/HYPERTENSIONAHA.108.113357. [DOI] [PubMed] [Google Scholar]
- 2.Egan BM, Zhao Y, Axon RN. US trends in prevalence, awareness, treatment, and control of hypertension, 1988-2008. JAMA. 2010;303:2043–50. doi: 10.1001/jama.2010.650. [DOI] [PubMed] [Google Scholar]
- 3.Lewington S, Clarke R, Qizilbash N, et al. Age-specific relevance of usual blood pressure to vascular mortality: a meta-analysis of individual data for one million adults in 61 prospective studies. Lancet. 2002;360:1903–13. doi: 10.1016/s0140-6736(02)11911-8. [DOI] [PubMed] [Google Scholar]
- 4.Whelton PK, He J, Appel LJ, et al. Primary prevention of hypertension: clinical and public health advisory from The National High Blood Pressure Education Program. JAMA. 2002;288:1882–8. doi: 10.1001/jama.288.15.1882. [DOI] [PubMed] [Google Scholar]
- 5.Klag MJ, Whelton PK, Randall BL, et al. Blood pressure and end-stage renal disease in men. N Engl J Med. 1996;334:13–8. doi: 10.1056/NEJM199601043340103. [DOI] [PubMed] [Google Scholar]
- 6.Prevention of stroke by antihypertensive drug treatment in older persons with isolated systolic hypertension. Final results of the Systolic Hypertension in the Elderly Program (SHEP). SHEP Cooperative Research Group. JAMA. 1991;265:3255–64. [PubMed] [Google Scholar]
- 7.Turnbull F, Neal B, Ninomiya T, et al. Effects of different regimens to lower blood pressure on major cardiovascular events in older and younger adults: meta-analysis of randomised trials. BMJ. 2008;336:1121–3. doi: 10.1136/bmj.39548.738368.BE. [DOI] [PMC free article] [PubMed] [Google Scholar]
- 8.Hansson L, Zanchetti A, Carruthers SG, et al. Effects of intensive blood-pressure lowering and low-dose aspirin in patients with hypertension: principal results of the Hypertension Optimal Treatment (HOT) randomised trial. Lancet. 1998;351:1755–62. doi: 10.1016/s0140-6736(98)04311-6. [DOI] [PubMed] [Google Scholar]
- 9.Julius S, Kjeldsen SE, Weber M, et al. Outcomes in hypertensive patients at high cardiovascular risk treated with regimens based on valsartan or amlodipine: the VALUE randomised trial. Lancet. 2004;363:2022–31. doi: 10.1016/S0140-6736(04)16451-9. [DOI] [PubMed] [Google Scholar]
- 10.Staessen JA, Fagard R, Thijs L, et al. Randomised double-blind comparison of placebo and active treatment for older patients with isolated systolic hypertension. The Systolic Hypertension in Europe (Syst-Eur) Trial Investigators Lancet. 1997;350:757–64. doi: 10.1016/s0140-6736(97)05381-6. [DOI] [PubMed] [Google Scholar]
- 11.Staessen JA, Gasowski J, Wang JG, et al. Risks of untreated and treated isolated systolic hypertension in the elderly: meta-analysis of outcome trials. Lancet. 2000;355:865–72. doi: 10.1016/s0140-6736(99)07330-4. [DOI] [PubMed] [Google Scholar]
- 12.Cushman WC, Evans GW, Byington RP, et al. Effects of intensive blood-pressure control in type 2 diabetes mellitus. N Engl J Med. 2010;362:1575–85. doi: 10.1056/NEJMoa1001286. [DOI] [PMC free article] [PubMed] [Google Scholar]
- 13.Appel LJ, Wright JT, Jr, Greene T, et al. Intensive blood-pressure control in hypertensive chronic kidney disease. N Engl J Med. 2010;363:918–29. doi: 10.1056/NEJMoa0910975. [DOI] [PMC free article] [PubMed] [Google Scholar]
- 14.JATOS Study Group. Principal results of the Japanese trial to assess optimal systolic blood pressure in elderly hypertensive patients (JATOS) Hypertens Res. 2008;31:2115–27. doi: 10.1291/hypres.31.2115. [DOI] [PubMed] [Google Scholar]
- 15.Ogihara T, Saruta T, Rakugi H, et al. Target blood pressure for treatment of isolated systolic hypertension in the elderly: valsartan in elderly isolated systolic hypertension study. Hypertension. 2010;56:196–202. doi: 10.1161/HYPERTENSIONAHA.109.146035. [DOI] [PubMed] [Google Scholar]
- 16.Benavente OR, Coffey CS, Conwit R, et al. Blood-pressure targets in patients with recent lacunar stroke: the SPS3 randomised trial. Lancet. 2013;382:507–15. doi: 10.1016/S0140-6736(13)60852-1. [DOI] [PMC free article] [PubMed] [Google Scholar]
- 17.Wright JT, Jr, Bakris G, Greene T, et al. Effect of blood pressure lowering and antihypertensive drug class on progression of hypertensive kidney disease: results from the AASK trial. JAMA. 2002;288:2421–31. doi: 10.1001/jama.288.19.2421. [DOI] [PubMed] [Google Scholar]
- 18.Kovesdy CP, Bleyer AJ, Molnar MZ, et al. Blood Pressure and Mortality in U.S. Veterans With Chronic Kidney Disease A Cohort Study. Ann Intern Med. 2013;159:233–242. doi: 10.7326/0003-4819-159-4-201308200-00004. [DOI] [PMC free article] [PubMed] [Google Scholar]
- 19.Yusuf S, Teo KK, Pogue J, et al. Telmisartan, ramipril, or both in patients at high risk for vascular events. N Engl J Med. 2008;358:1547–59. doi: 10.1056/NEJMoa0801317. [DOI] [PubMed] [Google Scholar]
- 20.Bangalore S, Messerli FH, Wun CC, et al. J-curve revisited: An analysis of blood pressure and cardiovascular events in the Treating to New Targets (TNT) Trial. Eur Heart J. 2010;31:2897–908. doi: 10.1093/eurheartj/ehq328. [DOI] [PubMed] [Google Scholar]
- 21.Ruggenenti P, Perna A, Loriga G, et al. Blood-pressure control for renoprotection in patients with non-diabetic chronic renal disease (REIN-2): multicentre, randomised controlled trial. Lancet. 2005;365:939–46. doi: 10.1016/S0140-6736(05)71082-5. [DOI] [PubMed] [Google Scholar]
- 22.Verma S, Gupta M, Holmes DT, et al. Plasma renin activity predicts cardiovascular mortality in the Heart Outcomes Prevention Evaluation (HOPE) study. Eur Heart J. 2011 [Google Scholar]
- 23.Koebnick C, Langer-Gould AM, Gould MK, et al. Sociodemographic characteristics of members of a large, integrated health care system: comparison with US Census Bureau data. Perm J. 2012;16:37–41. doi: 10.7812/tpp/12-031. [DOI] [PMC free article] [PubMed] [Google Scholar]
- 24.Bhandari SK, Pashayan S, Liu IL, et al. 25-hydroxyvitamin D levels and hypertension rates. J Clin Hypertens (Greenwich) 2011;13:170–7. doi: 10.1111/j.1751-7176.2010.00408.x. [DOI] [PMC free article] [PubMed] [Google Scholar]
- 25.Levey AS, Stevens LA, Schmid CH, et al. A new equation to estimate glomerular filtration rate. Ann Intern Med. 2009;150:604–12. doi: 10.7326/0003-4819-150-9-200905050-00006. [DOI] [PMC free article] [PubMed] [Google Scholar]
- 26.Sim J, Bhandari S, Shi J, et al. Characterizing Resistant Hypertension in a Large Ethnically Diverse Hypertensive Population of an Integrated Health System. Mayo Clin Proc. doi: 10.1016/j.mayocp.2013.06.017. In Press. [DOI] [PMC free article] [PubMed] [Google Scholar]
- 27.Sim JJ, Bhandari SK, Shi J, et al. Plasma renin activity (PRA) levels and antihypertensive drug use in a large healthcare system. Am J Hypertens. 2011;25:379–88. doi: 10.1038/ajh.2011.216. [DOI] [PubMed] [Google Scholar]
- 28.Sim JJ, Bhandari SK, Shi J, et al. Characteristics of Resistant Hypertension in a Large, Ethnically Diverse Hypertension Population of an Integrated Health System. Mayo Clin Proc. 2013;88:1099–1107. doi: 10.1016/j.mayocp.2013.06.017. [DOI] [PMC free article] [PubMed] [Google Scholar]
- 29.Sim JJ, Handler J, Jacobsen SJ, Kanter MH. Systemic Implementation Strategies to Improve Hypertension: The Kaiser Permanente Southern California Experience. The Can J cardiol. 2014;30(5):544–52. doi: 10.1016/j.cjca.2014.01.003. [DOI] [PubMed] [Google Scholar]
- 30.Go AS, Chertow GM, Fan D, et al. Chronic kidney disease and the risks of death, cardiovascular events, and hospitalization. N Engl J Med. 2004;351:1296–305. doi: 10.1056/NEJMoa041031. [DOI] [PubMed] [Google Scholar]
- 31.Zanchetti A. Blood pressure targets of antihypertensive treatment: up and down the J-shaped curve. Eur Heart J. 2010;31:2837–40. doi: 10.1093/eurheartj/ehq281. [DOI] [PubMed] [Google Scholar]
- 32.Perry HM, Jr, Davis BR, Price TR, et al. Effect of treating isolated systolic hypertension on the risk of developing various types and subtypes of stroke: the Systolic Hypertension in the Elderly Program (SHEP) JAMA. 2000;284:465–71. doi: 10.1001/jama.284.4.465. [DOI] [PubMed] [Google Scholar]
- 33.Cooper-DeHoff RM, Gong Y, Handberg EM, et al. Tight blood pressure control and cardiovascular outcomes among hypertensive patients with diabetes and coronary artery disease. JAMA. 2010;304:61–8. doi: 10.1001/jama.2010.884. [DOI] [PMC free article] [PubMed] [Google Scholar]
- 34.DeFelice A, Willard J, Lawrence J, et al. The risks associated with short-term placebo-controlled antihypertensive clinical trials: a descriptive meta-analysis. J Hum Hypertens. 2008;22:659–68. doi: 10.1038/jhh.2008.51. [DOI] [PubMed] [Google Scholar]
- 35.Diao D, Wright JM, Cundiff DK, Gueyffier F. Pharmacotherapy for mild hypertension. Cochrane Database Syst Rev. 2012;8:CD006742. doi: 10.1002/14651858.CD006742.pub2. [DOI] [PMC free article] [PubMed] [Google Scholar]
- 36.James PA, Oparil S, Carter BL, et al. 2014 Evidence-Based Guideline for the Management of High Blood Pressure in Adults: Report From the Panel Members Appointed to the Eighth Joint National Committee (JNC 8) JAMA. 2014;311(5):507–520. doi: 10.1001/jama.2013.284427. [DOI] [PubMed] [Google Scholar]
- 37.Romero-Corral A, Montori VM, Somers VK, et al. Association of bodyweight with total mortality and with cardiovascular events in coronary artery disease: a systematic review of cohort studies. Lancet. 2006;368:666–678. doi: 10.1016/S0140-6736(06)69251-9. [DOI] [PubMed] [Google Scholar]
- 38.Diehr PH, Thielke SM, Newman AB, et al. Decline in health for older adults: five-year change in 13 key measures of standardized health. J Gerontol A-Biol. 2013;68:1059–67. doi: 10.1093/gerona/glt038. [DOI] [PMC free article] [PubMed] [Google Scholar]
Associated Data
This section collects any data citations, data availability statements, or supplementary materials included in this article.