

Significance
We have resolved an efferent connection map of the zebrafish cerebellar Purkinje cells (PCs), showing that the PC efferents represent one of the highest conserved circuitries throughout vertebrates. Moreover, by physiological characterization and functional interrogation using optogenetics in freely moving zebrafish, we have identified distinct PC regions responsible for controlling specific but different stereotypic behaviors. This finding indicates that the output of the cerebellar PC layer is topographically organized and shows that zebrafish can serve to unveil the highly sought structure–physiology–function relationships in the vertebrate brain directly in vivo.
Abstract
There has been accumulating evidence for a regionalized organization of the cerebellum, which was mostly deduced from anatomical mapping of axonal projections of cerebellar afferents. A likewise regionalization of the cerebellar output has been suggested from lesion studies and dye-tracer experiments, but its physiological targets as well as the functional relevance of such an output regionalization are less clear. Ideally, such functional regionalization should be proven noninvasively in vivo. We here provide evidence for such a regionalization of the output from the cerebellar cortex by genetically encoded transneuronal mapping of efferent circuits of zebrafish Purkinje neurons. These identified circuits correspond to distinct regionalized Purkinje cell activity patterns in freely behaving zebrafish larvae during the performance of cerebellar-dependent behaviors. Furthermore, optogenetic interrogation of selected Purkinje cell regions during animal behavior confirms the functional regionalization of Purkinje cell efferents and reveals their contribution to behavior control as well as their function in controlling lateralized behavioral output. Our findings reveal how brain compartments serve to fulfill a multitude of functions by dedicating specialized efferent circuits to distinct behavioral tasks.
The vertebrate cerebellum is involved in controlling balance, body posture, smooth performance of movements, and likely, conditioning and motor learning (1–4). It is, thus, interconnected in many ways with other brain regions, such as the cortex and the spinal cord. Several approaches have attempted to prove the existence of a functional regionalization in the cerebellum, trying to ascribe a distinct function to individual cerebellar subregions (5, 6). These studies usually used electrophysiological methods for mapping cerebellar input (afferents), and such maps, which correlate each sensory input to a distinct cerebellar region, have been well-constructed in mammals (6). The illustration of a similar output (efferents) map, however, would be more meaningful to prove the subdivision of the cerebellar cortex into discrete functional regions, but this illustration has remained more challenging (2, 3, 7). Until recently, a precise physiologic characterization of the functional output governed by efferent circuits was highly invasive. Ideally, such characterization would address true activity-dependent coupling of neurons by noninvasively manipulating their activity, while monitoring behavioral consequences for freely behaving animals.
Recently, several techniques have been developed that allow for (i) the characterization of transneuronal connections, (ii) the direct noninvasive observation of neuronal activity, and (iii) the precise manipulation of neuronal circuits using optical methods (8–11). In this study, we use the combination of these techniques for circuit analysis in the zebrafish cerebellum to address a potential functional regionalization of the cerebellar cortex.
Results
Purkinje cells (PCs) represent the sole output neurons of the cerebellar cortex. We have isolated a 258-bp PC-specific regulatory element from zebrafish, which becomes active at around 2.5 d postfertilization (dpf) and continues to express in adults. A tandem organization of this 258-bp enhancer allows for specific coexpression of two different targets in PCs (Fig. 1A and SI Appendix, Fig. S1).
Fig. 1.

Efferent mapping of the adult zebrafish cerebellum. (A) Characterization of the PC-specific regulatory element in stable transgenic zebrafish (FyntagRFPT:PC:EGFP). SI Appendix, Fig. S1 shows detailed information about the PC-specific enhancer. (A1) Schematic drawing of the plasmid construct using a bidirectional PC-specific tandem enhancer. This enhancer was combined with the zebrafish E1b minimal promoter sequence. The globin intron (GI) promotes the nuclear export of the mRNA, whereas the polyA (pA) sequence stabilizes the mRNA. (A2) This enhancer element induces specific transgene expression (EGFP) in the zebrafish cerebellum. (Scale bar: 200 μm.) Five confocal images are integrated into this picture, and white lines indicate the division between each original image. (A3) Expression is confined to PCs, which is indicated by colocalization with the PC-specific marker ZebrinII in optical confocal microscopy sections (1.068 μm). (Scale bar: 20 μm.) (A4) Live imaging of FyntagRFPT:PC:EGFP. In litandem, this element allows strong bidirectional expression in PCs (EGFP and membrane-localized FyntagRFP-T; optical sections of 2.361 μm). (Scale bar: 100 μm.) (B) Immunohistochemical staining of the WGA protein and RNA in situ hybridization of wga mRNA. In sagittal brain sections of wga mRNA in situ hybridization, (B1 and B2) anti–tagRFP-T and (B3 and B4) anti-WGA immunohistochemistry staining was localized in the cerebellar PC layer, and (B1 and B2) no significant signals of tagRFP-T protein and wga mRNA were detected outside of the cerebellum. The WGA protein, instead, was found in many brain regions (B3 and B4 represent medial and lateral sagittal sections, respectively). Transverse sections are shown in B5 and SI Appendix, Fig. S3. B5 indicates representative signals of high-magnification transverse sections showing lateral valvular nucleus and inferior olive staining, and SI Appendix, Fig. S3 shows low-magnification images of these structures. (B6) No significant staining of WGA protein was observed in control [Tg(FyntagRFP-T:PC:empty)] sections. Inset in B6 shows an antibody staining against FyntagRFP-T expression as a positive control for the immunohistochemical analysis. n = 5 adult brains. (Scale bars: B1–B4 and B6, 500 μm; B5, 50 μm.) (C) Summary of the efferent PC network of the zebrafish cerebellum. Efferent targets were categorized by well-known function and/or connection. Anatomical nomenclature and abbreviations are according to the zebrafish brain atlas (46, 47), and SI Appendix, Fig. S3 shows the list of these abbreviations. AON, anterior octaval nucleus; CCe, corpus cerebella; CM, mammillary body; DIL, diffuse nucleus of the inferior lobe; DON, descending octaval nucleus; DTN, dorsal tegmental nucleus; EW, Edinger–Westphal nucleus; GC, central gray; Hc, caudal zone of periventricular hypothalamus; Hd, dorsal zone of periventricular hypothalamus, IGL, internal granule cell layer; IO, inferior olive; LLF, lateral longitudinal fascicle; LRN, lateral reticular nucleus; MLF, medial longitudinal fascicle; MON, medial octavolateralis nucleus; NLV, lateral valvular nucleus; NIII, oculomotor nucleus; NR, red nucleus; PPa, parvocellular preoptic nucleus, anterior part; PPv, periventricular pretectal nucleus, ventral part; RF, reticular formation; SO, secondary octaval population; SRF, superior reticular formation; TeO, optic tectum; TL, longitudinal torus; TPp, periventricular nucleus of posterior tuberculum; TS, semicircular torus; Val, valvular cerebellum; VT, ventral thalamus; Vv, ventral nucleus of ventral telencephalic area.
Mapping of PC Efferents.
For labeling the efferent network of zebrafish PCs, we used this enhancer to coexpress the membrane-localized red fluorescent protein (RFP) FyntagRFP-T together with the transneuronal anterograde tracer wheat germ agglutinin (WGA) (9) in stable transgenic fish. mRNA in situ hybridization confirmed that wga mRNA was only localized in the FyntagRFP-T–expressing PC layer (Fig. 1B). Strikingly, anti-WGA immunohistochemistry detected the WGA protein in not only PCs but also, EGFP-expressing eurydendroid cells (ECs) of Tg(olig2:EGFP) (12, 13) embryos and adults (SI Appendix, Fig. S2 A1 and B). These neurons represent first-order PC efferents and are thought to be equivalent to the deep cerebellar nuclei in mammals (14–16). In contrast, EGFP-fluorescent granule neurons, which are prominent PC afferents, were devoid of WGA protein in transgenic Tg(gata1:EGFP) (17) embryos, juveniles, and adults (Fig. 1B4, unstained internal granule cell layer and SI Appendix, Fig. S2 A2 and B). Thus, WGA, indeed, illustrates PC efferents but not afferents by anterograde transneuronal transport. Furthermore, outside the cerebellum, WGA staining identified second-order PC efferents in the thalamus, the preoptic area, the hypothalamus, the optic tectum, the octaval nuclei, the inferior olive, the reticular formation, the red nucleus, the nucleus of the medial longitudinal fascicle, and others (Fig. 1 B and C and SI Appendix, Fig. S3). Note that WGA is different from dye tracers, because it has been described to detect efferent somata but often does not label axons and dendrites (9). Stable transgenic fish only expressing FyntagRFP-T in PCs (FyntagRFP-T:PC:empty) did not show any immunohistochemical WGA signal (Fig. 1B6 and SI Appendix, Fig. S4). These identified PC efferents in zebrafish are largely consistent with indirect connectivity data in other fish deduced from tracer injections (18–20) and WGA mapping results in mouse (9), indicating that cerebellar connectivity has been highly conserved during evolution.
Topographical Organization of the Cerebellum—Efferent Network.
Next, we made use of a transient transgenic approach by DNA injection of expression constructs into one-cell-stage embryos. On day 5 dpf, mosaic PC-specific expression of membrane-targeted tagRFP-T (FyntagRFP-T:PC:empty) revealed that only cells in the lateral but not the medial part of the PC layer projected their axons directly to the octaval nuclei (14) as first-order efferents without contacting ECs (Fig. 2A). These projections are well-known to be the only direct projections of PCs to targets outside of the cerebellum in vertebrates (14, 21). In contrast, the lengths of zebrafish PC axons contacting ECs were always very short, about 1.91 ± 2.79 μm (average ± SD; maximum length found was 8.04 μm) (SI Appendix, Fig. S5), which was reported in other teleosts (22, 23). Thus, the topographical organization of ECs should be very similar to their afferent PCs. To further map second-order PC efferents by tracing individual EC projections, we isolated a regulatory element of the zebrafish olig2 gene to construct an olig2:KalTA4 expression vector (24). When injected into transgenic embryos of a Tg(5xUAS:FynVenus-GIpA) strain that expresses a membrane-targeted Venus fluorescent protein under control of Gal4-binding sites (UAS), Venus fluorescence was observed just underneath the PC layer (Fig. 2B and SI Appendix, Fig. S6). Here, it colocalized in transgenic Tg(olig2:DsRed) embryos (SI Appendix, Fig. S5A) with the red fluorescent cerebellar cells that have been previously identified as ECs (12, 13). This result confirmed that, in the cerebellum, the isolated olig2 regulatory element drives expression in cerebellar ECs.
Fig. 2.

Axon tracing of PCs and ECs. Axons of PCs and ECs were traced by using specific enhancers and fluorescent proteins. (A) FyntagRFP-T fluorescence in PCs of Tg(FyntagRFP-T:PC:empty) embryos illustrates PC axons projecting directly to the octaval nuclei (A1, confocal laser-scanning microscope is shown by the black arrows; A2, stereomicroscope is shown by the white arrows). These efferents were derived from PCs only in the lateral part of the cerebellum. The red dashed circle indicates the absence of directly descending projections from the medial part of the PC layer (A2, Right). (B) Injection of the olig2:KalTA4 expression construct into Tg(5xUAS:FynVenus-GIpA)/Tg(FyntagRFP-T:PC:empty) double-transgenic embryos marked individual ECs and their projections in a mosaic manner. Red and yellow fluorescent neurons represent PCs and ECs, respectively. This experiment revealed that ECs of the caudal cerebellum (arrowheads) send axons predominantly to the ipsilateral octaval nuclei (arrows in B1–B3) and less prominently to the contralateral octaval nuclei (green arrow in B3). (B4) Also, ECs of the valvula cerebelli project ipsilateral efferents into the octaval nuclei. (B5) The ECs below the rostromedial PC layer instead project long ascending axons to the thalamus, the red nucleus, or the nucleus of the medial longitudinal fasciculus. In addition, long descending projections to the reticular formation could be observed. Lower shows the respective transverse sections counterstained by BODIPY630/650; yellow signals of traced axons are encircled by red squares, and enlarged images are shown below. Arrowheads show EC somata, and arrows show representative axon terminals. n = 3 for each projection. Anatomical nomenclature and abbreviations are according to the zebrafish brain atlas (46, 47). (C) Comparison of the efferent PC network in the zebrafish and human cerebellum by schematic illustration. Note that the relative position of each region (1–4) in the adult zebrafish cerebellum is similar to that of the human cerebellum (in the text). nMLF, nucleus of the medial longitudinal fascicle; NR, red nucleus; OC, otic capsule; ON, octaval nucleus; SRF, superior reticular formation.
Tracing of individual axons in olig2:KalTA4-injected 5-dpf double-transgenic Tg(5xUAS:FynVenus-GIpA) × Tg(FyntagRFP-T:PC:empty) larvae unveiled a regionalization of EC efferents with additional detail (Fig. 2 and SI Appendix, Fig. S6). ECs from the caudolateral and caudomedial cerebellum were mostly connected to the octaval nuclei. These projections were mainly ipsilateral, with only few of them projecting contralaterally. In addition, ECs from the valvula cerebelli sent their axons to their respective ipsilateral octaval nucleus (Fig. 2B). Some ECs from the caudolateral region projected to anterior brain regions in the hypothalamus and the torus semicircularis in the midbrain (SI Appendix, Fig. S6B). In contrast, the ECs in the rostromedial part of the cerebellum (corpus cerebelli) showed quite different efferents (Fig. 2B and SI Appendix, Fig. S6C). These ECs projected long ascending axons to the nucleus of the medial longitudinal fascicle, the red nucleus, and the thalamus. Also, ECs from this region projected long descending axons to the reticular formation. These long projections were mostly bilateral, with the exception of projections to the red nucleus that were exclusively contralateral (Fig. 2B).
Considering a possible developmental process of the zebrafish cerebellum, during which the lateral part of the larval cerebellum may give rise to the caudomedial part of the adult cerebellum (SI Appendix, Fig. S7) like has been shown for the mouse cerebellum (25), the topographical organization of the cerebellum and its efferents is probably very similar between zebrafish, mouse, and human (Fig. 2C). This idea is further supported by comparing the efferents of zebrafish larvae with WGA staining in transient transgenic adult fish with WGA/tagRFP-T expression in subdomains of the PC layer (SI Appendix, Fig. S8). In sum, these data suggest that the lateral part of the larval zebrafish cerebellum corresponds to the human flocculus and the caudal part of the larval zebrafish cerebellum corresponds to the human caudal vermis, whereas the rostromedial part of the zebrafish larval cerebellum likely corresponds to the human paravermis.
Spatially Restricted Activity of Purkinje Neurons.
We next focused on two behaviors likely being influenced by the cerebellum: the optomotor reflex (OMR) and the optokinetic response (OKR) (26–30). We established OMR and OKR induction on a stage of a confocal microscope to allow for in vivo imaging of PC activity at high spatial and temporal resolutions in behaving larvae (SI Appendix, Fig. S9 and Movie S1). To analyze PC activity during these behaviors, we aimed for using genetically encoded calcium indicators (GECIs). Their use in PCs is challenging, because it is well-established that GECIs provide only low-signal intensity changes during the recording of Ca2+ transients in cerebellar PCs (31). To partially overcome this problem, we screened a number of available GECIs for their emission properties in PCs. Although GCaMP2, GCaMP3, GECO1.1, and GECO1.2 provided a low sensitivity (10, 32, 33), GCaMP5G emitted sufficiently strong amplitudes for discriminating PCs with fluctuating Ca2+ levels from inactive PCs (34). Furthermore, we increased the GECI expression level by tetramerizing the PC-specific regulatory element, and this transgene was used to generate a stable transgenic strain Tg(tagRFP-T:PC:GCaMP5G). Next, continuous Ca2+ fluctuation recordings at low magnification were performed across the entire PC layer at 3.64 Hz to localize Ca2+-level changes of zebrafish larvae during OMR and OKR performance. Although such recordings using GECIs do not allow for distinguishing single-PC action potentials (31), they do reveal areas of cumulative activity of PCs and thus, allow for revealing the physiological involvement of PC areas in certain behaviors (Figs. 3 and 4A).
Fig. 3.
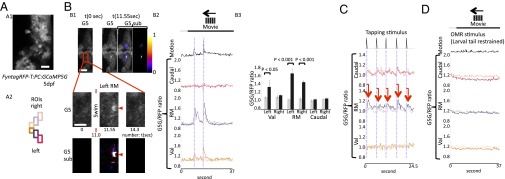
PC activities during OMR. Larvae of the Tg(tagRFP-T:PC:GCaMP5G) strain were mounted on the stage of a confocal microscope and stimulated to perform OMR. The red fluorescent PC layer of these larvae was overlaid by a stereotypic color-coded grid of regions of interest (ROIs). Changes in GCaMP5-derived fluorescence were recorded (275 ms/frame) followed by ratiometric analysis by division of GCaMP5G through tagRFP-T signals (G5/RFP) to correct for subtle movements of the larvae. Signal changes were displayed as separate graphs coded by the color corresponding to each ROI. (A1) High-magnification image of GCaMP5G signals. (Scale bar: 20 μm.) (A2) Rectangular ROIs used in the following analyses. (B) GCaMP5G signals during left-oriented OMR stimulation. n = 10 larvae. The graph is one representative example from these 10 larvae. (Scale bar: 50 μm.) (B1) Representative figures during swimming event. G5 represents original GCaMP5G signals, and G5 sub represents color-coded GCaMP5G signals subtracted by the t = 0 image. The right image of G5 sub represents color-coded subtraction, and the left image shows that on the baseline GCaMP5G image (t = 0). (Scale bar: 50 μm.) Enlarged G5 and G5 subimages are shown in Middle, and the elevated signals are indicated by red arrowheads. (Scale bar: 20 μm.) (B2) G5/RFP ratio plotting in each ROI during OMR-induced swimming. Note that the increase in Ca2+ activities in the rostromedial area of the PC layer occurred nearly simultaneously to swimming movements of the larva. (B3) Bars in the graph represent G5/RFP ratios before swimming initiation (gray; the frame that is three frames before each swimming initiation was used for this graph) and during swimming (black; the peak signal within five frames after each swimming initiation). n = 6 events. (C) A vibratory stimulus (tapping) also evoked swimming behavior with the rostromedial PC area, again responding most strongly by an increase in Ca2+ activity just after the stimulus. Red arrows indicate the correspondence between each tapping stimulus to respective induced neuronal activation. n = 6 larvae. The graph is one representative example from these six larvae. (D) The graphs display the GCaMP5G/tagRFP-T signals during OMR stimulation but with the trunk of the specimen being restrained. n = 4 larvae. The graph is one representative example from these four larvae. Caudal, caudal cerebellum; RM, rostromedial cerebellum; Val, valvular cerebellum.
Fig. 4.

PC activities during OKR. Larvae of the Tg(tagRFP-T:PC:GCaMP5G) strain were mounted on the stage of a confocal microscope and stimulated to perform OKR. (A) GCaMP5G signals during OKR evoking saccades to the right. n = 10 larvae. The graph is one representative example from these 10 larvae. (A1) Representative figures during OKR-induced saccade event. G5 represents original GCaMP5G signals, and G5 sub represents color-coded GCaMP5G signals subtracted by the t = 0 image. The right image of G5 sub represents color-coded subtraction, and the left image shows that on baseline GCaMP5G image (t = 0). (Scale bar: 50 μm.) Enlarged images are shown in Middle, and the elevated signals are indicated by red arrowheads. (Scale bar: 20 μm.) (A2) G5/RFP ratio plotting of each region of interest (ROI). Note that the activities in the caudal Purkinje layer are closely related to each saccade event (dashed lines). (A3) Bars in the graph represent G5/RFP ratios before a saccade (gray; the frame that is three frames before each saccade initiation was used for this graph) and during saccade performance (black; peak signal within five frames after each saccade initiation). n = 12 events. (A4) Overlay of OMR- (red) and OKR-induced (yellow) GECI signals, for which the size and orientation of the PC layer were registered, indicates the PC layer spatially distinct regions responding to each behavioral paradigm. (B) Ca2+ activity recording during irregular saccade stimulation by a moving point. Again, the caudal area of the PC layer showed increased Ca2+ activity simultaneous to saccades. n = 6 larvae. The graph is one representative example from these six larvae. (C) The graphs show the GCaMP5G/tagRFP-T signals during OKR stimulation but with eyes of the specimen being restrained. n = 4 larvae. The graph is one representative example from these four larvae. Caudal, caudal cerebellum; RM, rostromedial cerebellum; Val, valvular cerebellum.
First, the head of the larvae was restrained in agarose, whereas the tail could move freely to respond to OMR induction. A robust rise of GCaMP5G fluorescence, indicating cumulative Ca2+-signal increases in PCs, was observed. This change in fluorescence was spatially restricted and confined to the rostromedial part on both sides of the cerebellar PC layer (Fig. 3B and Movie S2). Also, vibration by tapping the imaging chamber—used as a second but different swimming-inducing stimulus—evoked a steep increase in Ca2+-mediated GCaMP5G fluorescence, correlating with initiation of swimming movements (Fig. 3C) and being confined to the same rostromedial PC area. Strikingly, the intensity of Ca2+ transients differed on both sides of the cerebellum, with PCs ipsilateral to the direction of swimming (direction of tail movement) responding stronger than their contralateral counterparts (Fig. 3B3 and SI Appendix, Fig. S10A2). The onset of Ca2+ transients mediating GCaMP5G fluorescence emission was observed simultaneously with the initiation of larval swimming movements (SI Appendix, Fig. S10A1, 69 ms/frame). Such Ca2+ fluctuation did not occur when the trunks of the larvae were restrained (Fig. 3D). These data show that PC activity in this area is involved in locomotive behavior.
Second, the trunk of the larvae was restrained for the OKR paradigm. During OKR performance, significant changes of Ca2+ levels were restricted to PCs only in the caudal part of the cerebellum, in which Ca2+ transients occurred simultaneously to saccade movements (Fig. 4A and Movie S3). Of note, this region in the PC layer is clearly removed from the OMR-responsive caudal territory of PCs (Fig. 4A4). When we used a different stimulus, a moving point, that induced irregular but incidental saccades, the same region in the PC layer showed elevated Ca2+ activity correlating to saccade performance (Fig. 4B). This finding indicates a behavior-related activation of PCs, which is restricted to the caudal cerebellar region. Again, PCs raised their Ca2+ level simultaneously and not significantly before or after the initiation of the saccade (SI Appendix, Fig. S10B1). Moving stripes did not trigger Ca2+ elevation in PCs when the eyes of the larvae were restrained (Fig. 4C), supporting that PC activity in the caudal cerebellar region is involved in eye movement behavior. Although the same regions in the bilateral cerebellum were activated during saccades, a laterality of the intensity of the GCaMP5G signal could be observed: caudal PCs contralateral to the direction of the saccade showed a higher elevation in Ca2+ levels compared with the ipsilateral ones that responded in a less intense manner (Fig. 4A3 and SI Appendix, Fig. S10B2).
In summary, by connectivity and physiological activity, the PC layer of the zebrafish cerebellum is regionalized into functional domains of PCs that are involved in controlling distinct behaviors.
Different Functional Roles of Each PC Subregion in the Cerebellum.
To prove such a regionalized organization of the PC layer by means of function, we used optogenetics, which use the expression of light-gated ion channels to locally trigger or inhibit neuronal activity (35). For our studies, we used Channelrhodopsin 2 (ChR2; H134R, fused to Venus) and Archaerhodopsin 3 (Arch; fused to tagRFP-T) because of their high sensitivity and prompt recovery after cessation of illumination, respectively (36–39). In addition, unlike other hyperpolarizing opsins, Arch does not influence GABAergic signaling beyond the period of light stimulation (40), making Arch an optimal choice for hyperpolarizing GABAergic PCs.
To prove an immediate influence of opsin activity on PC physiology, we generated stable transgenic zebrafish coexpressing each of these light-gated ion channels together with a matching GECI (SI Appendix, Fig. S1). We illuminated the entire PC layer of Arch/GCaMP5G-coexpressing larvae at 5 dpf by 561-nm laser light using a confocal laser-scanning microscope at scan rates of 3.64 Hz. Simultaneous recording of GCaMP5G emission, indeed, revealed a clear decrease of PC activity specifically during periods of Arch stimulation (SI Appendix, Fig. S11A). When only a small region of PCs was irradiated as well, the GCaMP5G signal was only reduced within the illuminated domain (SI Appendix, Fig. S11B). Similarly, global (SI Appendix, Fig. S11A) or regional (SI Appendix, Fig. S11C) activation of PCs only during ChR2 stimulation with blue laser light of 488 nm could be achieved in transgenic zebrafish larvae coexpressing ChR2 and RGECO-1.
To confirm the regionalization of the cerebellar cortex in relation to behavioral output, we searched for PC regions affecting OMR-induced swimming on optogenetic manipulation. For this purpose, OMR was induced in transgenic larvae with PC-specific Arch or ChR2 expression, and their tail movements were monitored before, during, and after the respective optogenetic channel was stimulated. When the entire right hemisphere of the cerebellum was hyperpolarized by yellow light activation of Arch, thereby inhibiting PC activity, swimming events to the right (tail flip to the right) decreased, resulting in the increase of left swimming ratio (Fig. 5A1). This effect was confined to the inactivation of the rostromedial PC region, whereas inactivation of other PC regions, activation of Arch outside of the cerebellum (control1), and illumination of the right cerebellum in Tg(tagRFP-T:PC:GCaMP5G) control larvae (control2) did not significantly influence swimming orientation, indicating that the control of oriented OMR was specifically mediated by the rostromedial territory of the cerebellar PC layer in zebrafish larvae (Fig. 5 A1 and A2). In contrast, suppression of the left rostromedial PC activity by Arch stimulation decreased swimming events to the left (tail flip to the left) (Fig. 5A2 and Movie S4). When we activated PCs in the same rostromedial region by blue light stimulation of ChR2, the effects were inverted: illumination on the left mostly impaired oriented swimming to the right, and ChR2 activation on the right predominantly impaired leftward swimming events (Fig. 5B and Movie S4). The finding that Arch and ChR2 both suppressed but did not trigger swimming in a specific direction confirms that PCs are not generators of swimming movements; instead, they rather coordinate the proper execution of oriented swimming (41). Next, we analyzed the performance of OKR while influencing PC physiology by optogenetic stimulation. When the entire PC layer or only its caudal part was inhibited by hyperpolarization through Arch activation, the number of saccades was significantly reduced (SI Appendix, Fig. S12A1). The effect of this optogenetic inhibition of saccades was prompt and reversible, and the eye movements recovered quickly after the termination of Arch activation (SI Appendix, Fig. S12 A2 and A3). Illumination of other parts of the cerebellum than the caudal part or outside the cerebellum (control1) did not alter either impaired saccade performance, indicating that the control over saccades was specifically mediated by the caudal cerebellum in zebrafish larvae (SI Appendix, Fig. S12A1). Interestingly, when PC activity was inhibited in the left caudal region of the PC layer, impairment of saccades to the right was observed. In contrast, suppression of PC activity in the corresponding right caudal part of the PC layer resulted in an inhibition of saccades to the left (SI Appendix, Fig. S12A3 and Movie S5). These findings were further confirmed when we triggered PC activity in the same regions by blue light stimulation of ChR2, with the effects being inverse. Namely, ChR2 activation in the left caudal PC region impaired saccades to the left, whereas ChR2 activation in the right caudal PC region impaired saccades to the right (SI Appendix, Fig. S12B and Movie S5). This result shows that the caudal region of the cerebellar PC layer controls saccade movements, with the laterality of the movement being predominantly assigned to one hemisphere each. The fact that PC activation neither accelerates nor triggers saccades or swimming movements, regardless of PCs being depolarized or hyperpolarized, is not surprising, because the generators of these behaviors have been mapped to structures outside the cerebellum (42–44). For proper motor control, PCs need to determine combinations of counteracting muscles (tensor and flexor), for which they have to send well-tuned contraction and relaxation commands controlling muscle tonus (2, 45). Increasing either one will impair proper movement execution.
Fig. 5.

Optogenetic in situ manipulation of PC activity during OMR. OMR monitoring during optogenetic suppression (561 nm) of PCs in a Tg(Arch-tagRFP-T:PC:GCaMPG5G) larva. Dunnett's test was used for posthoc analysis. Left swimming ratio is defined as the number of left-directed swimming events per the number of total swimming events. (A) Suppression of the entire right hemisphere of the cerebellum induced a decrease of swimming events toward the right (A1). (A1 and A2) This effect is also observed by the illumination of the right rostromedial PC layer (examples are indicated by the red arrows), but illumination other than the rostromedial region of interest (ROI) in the right hemisphere or outside the cerebellum did not affect the orientation of swimming (A1). (A2) On the contrary, suppression of PCs in the left rostromedial PC layer resulted in a decrease of swimming events toward the left (examples are indicated by red arrows). n = 3 larvae (10 trials each). One representative example is shown. Relative motion distance is the displacement of the tail divided by the width of the trunk. Control1, illumination outside of the cerebellum (hindbrain) of Tg(Arch-tagRFP-T:PC:GCaMPG5G) larva; control2, illumination of the right hemisphere of the PC layer of Tg(tagRFP-T:PC:GCaMP5G) larva. (B) OMR monitoring during optogenetic activation (488 nm) of PCs of a Tg(ChR2-Venus:PC:R-GECO1) larva. Activation of PCs in the left or right rostromedial PC layer resulted in a decrease of swimming events toward the right or the left, respectively (examples are indicated by the red arrows). n = 3 larvae (10 trials each). One example is shown. Dunnett's test was used for posthoc analysis. Caudal, caudal cerebellum; control1, illumination outside of the cerebellum (hindbrain) of Tg(ChR2-Venus:PC:RGECO-1) larva; control2, illumination of right hemisphere of the PC layer of Tg(tagRFP-T:PC:GCaMP5G) larva; RM, rostromedial cerebellum; Val, valvular cerebellum.
Discussion
In this report, we have used noninvasive in vivo methods to show a regionalized output organization of the zebrafish cerebellar PC layer into areas that control different behaviors. Shown by Ca2+ imaging and optogenetic manipulation, the caudal part of the cerebellar PC layer controls saccadic eye movements, and these PCs send projections to the octaval populations, which is shown by transneuronal WGA mapping and axon tracing of ECs. In contrast, swimming behavior is controlled by the rostromedial part of the PC layer, which is connected to the locomotor-related system of the CNS as revealed by WGA transport from PCs to ascending and descending projections and the axonal projection of rostromedial ECs. Therefore, not only the input but also, the output of the vertebrate cerebellar PC layer are organized into units of different functions. Our zebrafish model offers a powerful in vivo approach for addressing how such regionalized neuronal networks are organized and optimized during brain differentiation to generate an optimal physiological output.
In conclusion, by mostly using noninvasive methods on freely behaving animals, we have shown a regionalized functional organization of the output of the PC layer in the zebrafish cerebellum. Therefore, not only the input but also, the output of the vertebrate cerebellar PC layer are organized into units of different functions. Our zebrafish model offers a powerful in vivo approach for addressing how such regionalized neuronal networks are organized and optimized during brain differentiation to generate an optimal physiological output.
Materials and Methods
For in vivo calcium imaging, larvae were kept in 30% (vol/vol) Danieau’s solution containing 75 μM 1-phenyl 2-thiourea (PTU) from 1 dpf. tagRFP-T and fluctuating GCaMP5G fluorescence were monitored under a confocal microscope (TCS SP8; Leica Microsystems) simultaneously to observe animal behavior. Fish for optogenetics combined with behavioral monitoring were kept in 30% Danieau’s solution. When optogenetics were combined with calcium imaging, 75 μM PTU was added to the medium from 1 dpf onward. Illumination of Arch was performed using a 561-nm laser, whereas ChR2 was illuminated using the 488-nm laser.
Supplementary Material
Acknowledgments
We thank Angela Traudt, Eva Saxinger, and Timo Fritsch for technical support. We also thank Dr. Mario F. Wullimann for intense discussions and Dr. Marta Zagrebelsky for carefully commenting on the manuscript. This work was supported by funding from Deutsche Forschungsgemeinschaft Grant KO 1949/7-1 and an Alexander von Humboldt Fellowship (to H.M.).
Footnotes
The authors declare no conflict of interest.
This article is a PNAS Direct Submission.
See Commentary on page 11580.
This article contains supporting information online at www.pnas.org/lookup/suppl/doi:10.1073/pnas.1403105111/-/DCSupplemental.
References
- 1.Timmann D, et al. The human cerebellum contributes to motor, emotional and cognitive associative learning. A review. Cortex. 2010;46(7):845–857. doi: 10.1016/j.cortex.2009.06.009. [DOI] [PubMed] [Google Scholar]
- 2.Carpenter MB. Core Text of Neuroanatomy. 4th Ed. Philadelphia: Lippincott Williams & Wilkins; 1992. [Google Scholar]
- 3.Guyton AC, Hall JE. Textbook of Medical Physiology. 11th Ed. Philadelphia: Saunders; 2005. [Google Scholar]
- 4.Aizenberg M, Schuman EM. Cerebellar-dependent learning in larval zebrafish. J Neurosci. 2011;31(24):8708–8712. doi: 10.1523/JNEUROSCI.6565-10.2011. [DOI] [PMC free article] [PubMed] [Google Scholar]
- 5.Bolk L. Das Cerebellum der Säugetiere: Eine vergleichende anatomische Untersuchung. 1906. (Fischer, Stuttgart) [Google Scholar]
- 6.Manni E, Petrosini L. A century of cerebellar somatotopy: A debated representation. Nat Rev Neurosci. 2004;5(3):241–249. doi: 10.1038/nrn1347. [DOI] [PubMed] [Google Scholar]
- 7.Dow RS, Moruzzi G. The Physiology and Pathology of the Cerebellum. Minneapolis: Minnesota Univ Press; 1958. [Google Scholar]
- 8.Scott EK. The Gal4/UAS toolbox in zebrafish: New approaches for defining behavioral circuits. J Neurochem. 2009;110(2):441–456. doi: 10.1111/j.1471-4159.2009.06161.x. [DOI] [PubMed] [Google Scholar]
- 9.Yoshihara Y, et al. A genetic approach to visualization of multisynaptic neural pathways using plant lectin transgene. Neuron. 1999;22(1):33–41. doi: 10.1016/s0896-6273(00)80676-5. [DOI] [PubMed] [Google Scholar]
- 10.Tian L, et al. Imaging neural activity in worms, flies and mice with improved GCaMP calcium indicators. Nat Methods. 2009;6(12):875–881. doi: 10.1038/nmeth.1398. [DOI] [PMC free article] [PubMed] [Google Scholar]
- 11.Adamantidis AR, Zhang F, Aravanis AM, Deisseroth K, de Lecea L. Neural substrates of awakening probed with optogenetic control of hypocretin neurons. Nature. 2007;450(7168):420–424. doi: 10.1038/nature06310. [DOI] [PMC free article] [PubMed] [Google Scholar]
- 12.Shin J, Park HC, Topczewska JM, Mawdsley DJ, Appel B. Neural cell fate analysis in zebrafish using olig2 BAC transgenics. Methods Cell Sci. 2003;25(1-2):7–14. doi: 10.1023/B:MICS.0000006847.09037.3a. [DOI] [PubMed] [Google Scholar]
- 13.Park HC, Shin J, Roberts RK, Appel B. An olig2 reporter gene marks oligodendrocyte precursors in the postembryonic spinal cord of zebrafish. Dev Dyn. 2007;236(12):3402–3407. doi: 10.1002/dvdy.21365. [DOI] [PubMed] [Google Scholar]
- 14.Bae YK, et al. Anatomy of zebrafish cerebellum and screen for mutations affecting its development. Dev Biol. 2009;330(2):406–426. doi: 10.1016/j.ydbio.2009.04.013. [DOI] [PubMed] [Google Scholar]
- 15.Pouwels E. On the development of the cerebellum of the trout, Salmo gairdneri. III. Development of neuronal elements. Anat Embryol (Berl) 1978;153(1):37–54. doi: 10.1007/BF00569848. [DOI] [PubMed] [Google Scholar]
- 16.Pouwels E. On the development of the cerebellum of the trout, Salmo gairdneri. IV. Development of the pattern of connectivity. Anat Embryol (Berl) 1978;153(1):55–65. doi: 10.1007/BF00569849. [DOI] [PubMed] [Google Scholar]
- 17.Volkmann K, Rieger S, Babaryka A, Köster RW. The zebrafish cerebellar rhombic lip is spatially patterned in producing granule cell populations of different functional compartments. Dev Biol. 2008;313(1):167–180. doi: 10.1016/j.ydbio.2007.10.024. [DOI] [PubMed] [Google Scholar]
- 18.Wullimann MF, Northcutt RG. Connections of the corpus cerebelli in the green sunfish and the common goldfish: A comparison of perciform and cypriniform teleosts. Brain Behav Evol. 1988;32(5):293–316. doi: 10.1159/000116558. [DOI] [PubMed] [Google Scholar]
- 19.Ikenaga T, Yoshida M, Uematsu K. Efferent connections of the cerebellum of the goldfish, Carassius auratus. Brain Behav Evol. 2002;60(1):36–51. doi: 10.1159/000064120. [DOI] [PubMed] [Google Scholar]
- 20.Wullimann MF, Rooney DJ. A direct cerebello-telencephalic projection in an electrosensory mormyrid fish. Brain Res. 1990;520(1-2):354–357. doi: 10.1016/0006-8993(90)91730-5. [DOI] [PubMed] [Google Scholar]
- 21.Altman J, Bayer SA. Development of the Cerebellar System in Relation to Its Evolution, Structure, and Function. Boca Raton, FL: CRC; 1997. [Google Scholar]
- 22.Hoggatt AM, Lannoo MJ. Monoclonal antibody anti-type I and anti-zebrin II labelling in siluriform fishes: The role of shared lineage versus shared function in polypeptide co-distributions. Brain Res. 1994;665(2):181–191. doi: 10.1016/0006-8993(94)91337-4. [DOI] [PubMed] [Google Scholar]
- 23.Lannoo MJ, Ross L, Maler L, Hawkes R. Development of the cerebellum and its extracerebellar Purkinje cell projection in teleost fishes as determined by zebrin II immunocytochemistry. Prog Neurobiol. 1991;37(4):329–363. doi: 10.1016/0301-0082(91)90022-s. [DOI] [PubMed] [Google Scholar]
- 24.Distel M, Wullimann MF, Köster RW. Optimized Gal4 genetics for permanent gene expression mapping in zebrafish. Proc Natl Acad Sci USA. 2009;106(32):13365–13370. doi: 10.1073/pnas.0903060106. [DOI] [PMC free article] [PubMed] [Google Scholar]
- 25.Sgaier SK, et al. Morphogenetic and cellular movements that shape the mouse cerebellum; insights from genetic fate mapping. Neuron. 2005;45(1):27–40. doi: 10.1016/j.neuron.2004.12.021. [DOI] [PubMed] [Google Scholar]
- 26.Omata T, et al. Purkinje cell activity in the middle zone of the cerebellar flocculus during optokinetic and vestibular eye movement in cats. Jpn J Physiol. 2000;50(3):357–370. doi: 10.2170/jjphysiol.50.357. [DOI] [PubMed] [Google Scholar]
- 27.Angelaki DE, Hess BJ. The cerebellar nodulus and ventral uvula control the torsional vestibulo-ocular reflex. J Neurophysiol. 1994;72(3):1443–1447. doi: 10.1152/jn.1994.72.3.1443. [DOI] [PubMed] [Google Scholar]
- 28.Beck JC, Rothnie P, Straka H, Wearne SL, Baker R. Precerebellar hindbrain neurons encoding eye velocity during vestibular and optokinetic behavior in the goldfish. J Neurophysiol. 2006;96(3):1370–1382. doi: 10.1152/jn.00335.2006. [DOI] [PubMed] [Google Scholar]
- 29.Maurer CM, Huang YY, Neuhauss SC. Application of zebrafish oculomotor behavior to model human disorders. Rev Neurosci. 2011;22(1):5–16. doi: 10.1515/RNS.2011.003. [DOI] [PubMed] [Google Scholar]
- 30.Paul DH, Roberts BL. The activity of cerebellar neurones of the decerebrate dogfish Scyliorhinus during spontaneous swimming movements. J Physiol. 1984;352:1–16. doi: 10.1113/jphysiol.1984.sp015274. [DOI] [PMC free article] [PubMed] [Google Scholar]
- 31.Yamada Y, et al. Quantitative comparison of genetically encoded Ca indicators in cortical pyramidal cells and cerebellar Purkinje cells. Front Cell Neurosci. 2011;5:18. doi: 10.3389/fncel.2011.00018. [DOI] [PMC free article] [PubMed] [Google Scholar]
- 32.Zhao Y, et al. An expanded palette of genetically encoded Ca²⁺ indicators. Science. 2011;333(6051):1888–1891. doi: 10.1126/science.1208592. [DOI] [PMC free article] [PubMed] [Google Scholar]
- 33.Tallini YN, et al. Imaging cellular signals in the heart in vivo: Cardiac expression of the high-signal Ca2+ indicator GCaMP2. Proc Natl Acad Sci USA. 2006;103(12):4753–4758. doi: 10.1073/pnas.0509378103. [DOI] [PMC free article] [PubMed] [Google Scholar]
- 34.Akerboom J, et al. Optimization of a GCaMP calcium indicator for neural activity imaging. J Neurosci. 2012;32(40):13819–13840. doi: 10.1523/JNEUROSCI.2601-12.2012. [DOI] [PMC free article] [PubMed] [Google Scholar]
- 35.Tye KM, Deisseroth K. Optogenetic investigation of neural circuits underlying brain disease in animal models. Nat Rev Neurosci. 2012;13(4):251–266. doi: 10.1038/nrn3171. [DOI] [PMC free article] [PubMed] [Google Scholar]
- 36.Chow BY, et al. High-performance genetically targetable optical neural silencing by light-driven proton pumps. Nature. 2010;463(7277):98–102. doi: 10.1038/nature08652. [DOI] [PMC free article] [PubMed] [Google Scholar]
- 37.Nagel G, et al. Light activation of channelrhodopsin-2 in excitable cells of Caenorhabditis elegans triggers rapid behavioral responses. Curr Biol. 2005;15(24):2279–2284. doi: 10.1016/j.cub.2005.11.032. [DOI] [PubMed] [Google Scholar]
- 38.Boyden ES, Zhang F, Bamberg E, Nagel G, Deisseroth K. Millisecond-timescale, genetically targeted optical control of neural activity. Nat Neurosci. 2005;8(9):1263–1268. doi: 10.1038/nn1525. [DOI] [PubMed] [Google Scholar]
- 39.Zhang F, et al. Multimodal fast optical interrogation of neural circuitry. Nature. 2007;446(7136):633–639. doi: 10.1038/nature05744. [DOI] [PubMed] [Google Scholar]
- 40.Raimondo JV, Kay L, Ellender TJ, Akerman CJ. Optogenetic silencing strategies differ in their effects on inhibitory synaptic transmission. Nat Neurosci. 2012;15(8):1102–1104. doi: 10.1038/nn.3143. [DOI] [PMC free article] [PubMed] [Google Scholar]
- 41.Del Bene F, Wyart C. Optogenetics: A new enlightenment age for zebrafish neurobiology. Dev Neurobiol. 2012;72(3):404–414. doi: 10.1002/dneu.20914. [DOI] [PubMed] [Google Scholar]
- 42.Schoonheim PJ, Arrenberg AB, Del Bene F, Baier H. Optogenetic localization and genetic perturbation of saccade-generating neurons in zebrafish. J Neurosci. 2010;30(20):7111–7120. doi: 10.1523/JNEUROSCI.5193-09.2010. [DOI] [PMC free article] [PubMed] [Google Scholar]
- 43.Wyart C, et al. Optogenetic dissection of a behavioural module in the vertebrate spinal cord. Nature. 2009;461(7262):407–410. doi: 10.1038/nature08323. [DOI] [PMC free article] [PubMed] [Google Scholar]
- 44.Arrenberg AB, Del Bene F, Baier H. Optical control of zebrafish behavior with halorhodopsin. Proc Natl Acad Sci USA. 2009;106(42):17968–17973. doi: 10.1073/pnas.0906252106. [DOI] [PMC free article] [PubMed] [Google Scholar]
- 45.Standring S. Gray’s Anatomy: The Anatomical Basis of Clinical Practice. 39th Ed. Philadelphia: Churchill Livingstone; 2005. [Google Scholar]
- 46.Wullimann MF, Rupp B, Reichert H. Neuroanatomy of the Zebrafish Brain. Basel: Birkhaeuser; 1996. [DOI] [PubMed] [Google Scholar]
- 47.Mueller T, Wullimann MF. Atlas of Early Zebrafish Brain Development. Amsterdam: Elsevier; 2005. [Google Scholar]
Associated Data
This section collects any data citations, data availability statements, or supplementary materials included in this article.