

Abstract

Experimentally, the solubility of oligoglycines in water decreases as its length increases. Computationally, the free energy of solvation becomes more favorable with chain length for short (n = 1–5) oligoglycines. We present results of large scale simulations with over 600 pentaglycines at varying concentrations in explicit solvent to consider the mechanism of aggregation. The solubility limit of Gly5 for the force field used was calculated and compared with experimental values. We find that intermolecular interactions between pentaglycines are favored over interactions between glycine and water, leading to their aggregation. However, the interaction driving peptide associations, liquid–liquid phase separation, are not predominantly hydrogen bonding. Instead, non-hydrogen bonding interactions between partially charged atoms on the peptide backbone allow the formation of dipole–dipole and charge layering correlations that mechanistically stabilize the formation of large, stable peptide clusters.
Introduction
Proteins fold because water is a marginal solvent for peptide polymer chains.1,2 Changing the quality of the solvent affects solution stability or aggregation and is usually accompanied by changes in protein stability.3−5 Timasheff and co-workers have analyzed changes in protein stability and solubility in the presence of osmolytes in terms of liquid state correlations among the protein, the solvent, and the osmolyte.6−8 The correlations may be described by preferential inclusion or exclusion of cosolvents in the protein solvation shells. Other work has parsed the solution data into contributions from the backbone vs the side chains in various solvents and has shown that the backbone contributes significantly to changes in protein stability and solubility.5,9
Oligoglycines are useful models of the protein backbone and of aspects of protein folding3,4 since as their length increases, their solubility in water decreases,10,11 resembling the marginal solubility and behavior of many globular proteins in water. They are also idealized models of certain intrinsically disordered proteins (IDPs) or disordered protein domains because of their inherent flexibility and lack of persistent secondary structure. This allows us to use them to examine transitions from “extended, disordered states” to “collapsed, disordered states” observed in IDPs.12 Simulations of dilute oligoglycine models show that they collapse in water,3,4 a result that was borne out by single molecule fluorescence correlation spectroscopy experiments on oligoglycines at subnanomolar concentrations.13 The collapse of long oligoglycine is another manifestation of the experimental poor solubility of short oligoglycines in water. Remarkably, this collapse occurs in spite of the favorable decrease in solvation free energy with increase in length that has been calculated at infinite dilution.14
In both peptide collapse and aggregation, the result is not a solid state but a liquid–liquid phase separation characterized by increased turbidity in the solution.10,11,13 The occurrence of a separate dense liquid phase has been noted in the precrystallization stage in proteins as well.15−19 Liquid–liquid phase separations are usually induced by changing temperature and/or concentration.15,20 However, such a separation can also be formed by inducing a large dipole moment in the protein or peptide by, for instance, changing the pH of the solvent.21−23 pH dependent changes in the solubility of Ribonuclease Sa resulting in the formation of insoluble amyloid fibrils of the protein have also been reported.24 Change in solubility can also be caused by altering the flanking sequence of aggregating units as has been observed in Huntingtin protein.25
Here, we simulate the aggregation of pentaglycines in water as a model of a liquid–liquid phase separation analogous to proteins and analyze the molecular basis of the transition. In folding and aggregation, we expect a mechanism dominated by solute-to-solute interactions. Generally, protein and peptide structures are thought to be dominated by hydrogen bonding. We analyze the nature and type of interactions responsible for the solubility limit of our model peptides. In the next section, we describe the models and computational methods used. We then present and discuss the results in terms of the interactions and correlations found in the systems. We conclude by drawing comparisons to longer oligomers of glycine and consider the role these mechanisms may play in the function of IDPs.
Methods
In order to study the phase separation of glycine oligomers, we built systems of 625 pentaglycines with capped ends (Gly5) at two concentrations, 0.3 M (the concentrated system) and 0.03 M (the dilute system). Both concentrations are above the extrapolated experimental solubility limit of pentaglycines of around or under 1 mM.11 Computationally, solubility limits are not known for the protein force fields used. Some liquid state studies have been done on ionic solubilities for common force fields that showed interesting trends with respect to van der Waals parameter contributions.26 The large number of peptides used in this study is necessary to allow for the formation of clusters/aggregates that are large enough to overcome surface tension effects. A large system also ensures that artifacts of the periodic boundary conditions can be made small; for example, a smaller system would have a smaller heat capacity, which would affect the rate at which aggregation proceeds.27
Simulation Protocol
The peptides, built with CHARMM,28 were arranged on a cubic lattice and solvated using VMD29 at concentrations of 0.3 and 0.03 M. The concentrated system had 90,940 water molecules and a cubic cell of side length 145 Å. The dilute system had 1,105,898 water molecules and a cubic cell of side length of 325 Å.
The concentrated system was run three times. In one run it was briefly heated to 400 K, cooled, and equilibrated at constant pressure and temperature (NPT) (pressure = 1 atm; temperature = 300 K) for 2 ns, the pressure checked at constant volume for 1 ns, and then run for a 100 ns in NPT (pressure = 1 atm; pressure = 300 K). Aggregation began as soon as the temperature was reassigned to 300 K. The other two were run, one for 100 ns and one for 50 ns, in the NPT ensemble (pressure = 1 atm; temperature = 300 K) after minimization; aggregation started immediately in both runs. Results reported here are primarily for the nonheated system run for a 100 ns unless otherwise noted. The dilute system was first equilibrated in NPT (pressure = 1 atm; temperature = 300 K) for 2 ns and in NVT (temperature = 300 K) for 1 ns, before being run in the NPT ensemble (pressure = 1 atm; temperature = 300 K) for 100 ns.
The NAMD package was used to run all simulations30 with the CHARMM22 force field with cmap correction.31,32 The velocity Verlet algorithm was used to calculate the trajectories of the atoms. A time step of 1 fs was used. Particle Mesh Ewald was used to calculate long-range electrostatic interactions, with a maximum space of 1 Å between grid points. Long-range electrostatics were updated at every time step. Van der Waal’s interactions were truncated at 12 Å. All bonds were constrained using the RATTLE module. Temperature was controlled with Langevin dynamics with a damping coefficient of 4/ps, applied only to non-hydrogen atoms. Pressure was controlled by the Nose-Hoover method with the Langevin piston, with an oscillation period of 200 fs and a damping time scale of 100 fs.
Simulations were run on Keeneland, a heterogeneous, high performance computing system with 264 nodes comprised of HP SL250 servers. Each node has 32 GB of host memory, two Intel Sandy Bridge CPU’s, and three NVIDIA M2090 GPUs. The communications network architecture is a Mellanox FDR InfiniBand interconnect.33
Solubility Limit
All binary mixtures that are not miscible in all proportions display a solubility limit. Different aqueous systems at ambient conditions may undergo either a liquid–liquid phase separation or a liquid–solid transition. For the systems here, all evidence both theoretical and experimental points to a liquid–liquid separation. Experimentally, when density differences between the two phases are large, gravity is sufficient to separate the liquids. When the density difference is less, an ultracentrifuge may be employed. Here, we have chosen a route computationally convenient without the presence of another field to separate the phases.
We consider a phase separated system in terms of aggregated clusters and supernatant, which has only monomers and small associated clusters. This is based on the expectation that given a standard nucleation barrier, we would expect a few large clusters and some number of solute molecules not in aggregates left in equilibrium in solution. The supernatant by definition is at the concentration of the solubility limit in a phase separated system. On the basis of the cluster size distribution, we can remove the substantial clusters from our supernatant by calculating the number of molecules and the solvent excluded volume of the large clusters and subtracting them from the total system. The DAlphaBall package34 was used to compute the solvent accessible volume. As the clusters are dynamically in exchange with molecules in the solvent, we average over 1000 time points after the phase separation in completed, in the last 50 ns.
Structure and Number of Interactions
Cluster definitions are highly dependent on the nature of the clustering molecules. Here, the inherent flexibility of the pentaglycine makes the classification of peptides into clusters based on the distance between the centers of mass or geometry ambiguous. Furthermore, a cutoff distance based on these centers leads to erroneous assignment of well solvated peptides into “clusters”. For our analysis, we have used an all-atom distance criteria. While this is more computationally intensive, it gives us an accurate cluster assignment. We have assigned two peptides to the same cluster if the distance between any two atoms in the peptides is ≤4 Å, which is just larger than the donor–acceptor distance for a H-bond but small enough that water may not intervene.
The conventional belief is that as a peptide collapses (or aggregates) and sacrifices solvation free energy, it gains stability through internal interactions, particularly hydrogen bonds.35,36 For our purpose, we used a generous (loose) definition of hydrogen bonding. An H-bond was defined as present if the distance between O and polar H atoms was less than 2.4 Å. The H-bond criteria is the same as the one used by default in the CHARMM program and has been shown to include all H-bonds possible when an angle cutoff was not included.37 Other stabilizing interactions for proteins involving the backbone CO dipoles have been considered in the literature.38 We investigated the prevalence of such interactions in our analysis. A CO–CO interaction was considered to be present if the distance between C and O atoms was ≤4.2 Å. Both cutoff distances were taken from the radial distribution curves of the respective atoms about each other.
Interaction Energy and Energy Distributions
The total energy was decomposed in the usual solvent–solvent, solute–solvent, solute–solute, and intrasolute terms as reflected in the force field. Those were further subdivided into van der Waals, electrostatics, and bonded interactions. We also monitored the classical H-bonds in the total energy categories. A variety of dipolar interactions were also monitored of which H-bonds are a subset. For the analysis presented below, the H-bond energy between a pair of NH and CO atoms was calculated as the sum of the Lennard-Jones potential and electrostatic interactions:
 |
where i defines the donor atoms N and H, and j defines the acceptor atoms C and O.
The CO–CO interaction energy was calculated using the same method with a second CO atom pair instead of the NH atom pair. A distance cutoff of 10 Å between the O and H atoms for H-bonds and the O and C atoms for CO–CO interactions was used to exclude long-range interactions that have a negligible contribution to the interaction energy.
Dipole Correlations
We calculated the dipole moment of the peptide amide group using the method described by Ripoll et al.39 The peptide group dipole is defined as
where ri is a charge-weighted average of the positions of the atoms in the dipole, i.e.,
Correlations between two dipoles are given by the dot product between them.
Results
Gly5 Aggregates in a Concentration Dependent Manner
The concentrated systems (0.3 M) begin to phase separate almost immediately during production, and by 10 ns, distinct “peptide-rich” and water-rich regions are visible. By 20 ns, clusters of tens of peptides are formed for the 300 K runs. Over the next 30 ns, these clusters combine to form very large clusters of hundreds of peptides with relatively dry interiors that resemble droplets observed during simulations of phase separation in solvophobic solutions.40,41 By 50 ns, these droplets combine to form a single large cluster of over 550 peptides that persists for the remainder of the simulation (Figure 1a). Considerable fluctuations in shape occur constantly. No stable secondary structural elements are formed. All systems at the same concentration showed phase separation, albeit by different pathways. The system that was heated briefly rapidly formed clusters of hundreds of peptides and was stable by 20 ns, a classic example of an increase in temperature leading to an increase in solvation forces driving aggregation.42 Temperature increases leading to increased collapse has recently been observed in several proteins including IDPs.43
Figure 1.

Representative snapshots showing clustering in (a) 0.3 M at 100 ns and (b) 0.03 M at 40 ns. The color scheme is red, monomers; yellow, dimers; green, trimers; and blue, larger clusters. In the 0.3 M system, almost all of the peptides are in a single large cluster. In the 0.03 M system, there are a few small clusters comprising 4–7 peptides. Where peptides form a classic secondary structure, it is shown as a ribbon.
The dilute system (0.03 M) forms clusters of up to 12 peptides, which then break up and reform repeatedly (Figure 1b). Throughout the simulation, we did not observe phase separation, and large clusters like those observed in the concentrated system are not formed on the time scale allotted for the computer experiment.
The time averaged distribution of the observed clusters by size, shown in Figure 2, demonstrates the variation of cluster sizes in the two systems in the last 50 ns, the period after phase separation has occurred in the concentrated system. The cluster size distribution over the entire simulation is also shown (inset). Two peptides are defined as belonging to the same cluster if the distance between any two atoms in the peptides is ≤4 Å, a distance just larger than the donor–acceptor distance for a H-bond. For the entire last 50 ns in the concentrated system (indicated by red squares), most of the peptides (∼600) are in a single large cluster, while the remaining peptides are present in the solvent as monomers. There are no clusters of intermediate sizes during this period. The dilute system (indicated by blue triangles) has a few hundred monomers. As the cluster size increases, their number of occurrences decreases until when the cluster size reaches 10, it goes to zero and remains there. The inset shows the variation across the entire simulation period for both systems. The distribution for the dilute system is similar to the distribution during the last 50 ns. Across the entire simulation period, the concentrated system has several clusters of intermediate size. However, since these clusters are absent after phase separation, it is clear they are only formed during the initial phase transition stages. If monomers, dimers, and trimers are considered small clusters, the ratio of peptides in large clusters to small clusters is 15.9 in the concentrated system, indicating that at 0.3 M the equilibrium constant of the concentrated systems favors the formation of large clusters.
Figure 2.

Distribution of average cluster size across the last 50 ns at the two concentrations. The inset shows variation in cluster size in the two concentrations across the entire simulation period (100 ns). The red squares indicates clusters from the 0.3 M solution, and the blue triangles indicate clusters from the 0.03 M solution.
In Figure 3, we have shown a surface rendering of the peptides from a single simulation snapshot. The morphology and topography of the peptide cluster surfaces are reminiscent of those of globular proteins depicted in a similar manner. We can use water as a convenient probe of the pentapeptide nanodroplets. We categorize the instantaneous solvation into three groups: water on a surface peptide, water near clefts or pores in a cluster, and water excluded from dry interiors of clusters. In the figure, we have shown examples of all three types of waters within 6 Å of any atom of a representative peptide for each category. We chose an interior “dry” peptide, which was only one layer of peptides deep, for which only a single water on the surface met the criterion. We also show a channel of waters protruding through the droplet and waters on the surface of an exposed peptide. These features are similar to those seen in and around globular proteins. The difference here is that the peptide droplets are not made of kinetically stable secondary or tertiary structure. Thus, the topography the water samples changes on a few picosecond time scale and is generally less stable than the surface of natively folded proteins.
Figure 3.

Surface rendering of peptides from a single snapshot from the 0.3 M system. Three examples of all solvation water that is within 6 Å of a given peptide are shown with red colored water oxygens. The case of waters near a dry, interior peptide is on the left, around a surface peptide is shown in the middle, and a channel of waters penetrating into the cluster is shown on the right.
Solubility Limit
Using the surfaces as depicted in Figure 3, we can calculate the concentration of the saturated solution by subtracting the volume and number of the large clusters from the whole system and recalculating the concentration from the remainder as discussed in Methods. Using the plot in Figure 2, we choose 12 monomers as our demarcation between large clusters and small. We find the concentration of the saturated solution to be 0.016 M ± 0.003. This is below both our initial concentrations of 0.3 and 0.03 M. While the aggregation into clusters in our more concentrated system stabilized within a few nanoseconds, no sizable aggregates (greater than 12) formed on the 100 ns time scale for the 0.03 M system. However, when the single, large aggregate formed in the 0.3 M system was placed in a larger box of water, such that its concentration was 0.03 M, the aggregate (comprising 598 peptides) was stable for over 15 ns, indicating that when large aggregates are formed in the dilute system, they are very stable, both kinetically and mechanistically.
Figure 4 depicts the convergence of the solubility as measured by the concentration in the supernatant with respect to time for 0.3 M. A precipitous drop initially from around the starting concentration is seen until we reach a plateau in a few tens of nanoseconds. Small fluctuations persist as the shape and makeup of the aggregates evolve in time. The experimental solubility is lower by an order of magnitude, but the force field used and force fields in common usage in the field were never parametrized to give the solubility limit of aggregates.
Figure 4.

Concentration of Gly5 in the supernatant versus simulation time.
Interactions Within Clusters
We now consider the mechanism of cluster formation by computing the number of stabilizing interactions per peptide, both intramolecular and with other peptides within a cluster, versus cluster size. H-Bonds feature prominently in the literature of peptide/protein structure stabilization, and those are plotted versus cluster size in Figure 5a. On average, we observe less than two interpeptide H-bonds per pentapeptide in the concentrated system, irrespective of cluster size, and the dilute system has even fewer interpeptide H-bonds. The peptides do not form any appreciable intrapeptide H-bonds (Figure 5a) in either system. This is notable, especially given the loose definition of a H-bond used here, given that the conventional wisdom is that H-bonds are the primary drivers of the stabilization of collapsed states in peptide and protein systems.
Figure 5.

Variation in the number of H-bonds and CO–CO interactions, per peptide versus cluster size for the two concentrations. At the top, panel a shows the number of interpeptide (empty bars) and intrapeptide (filled bars) H-bonds in 0.3 M (red) and 0.03 M (blue) concentrations. At the bottom, panel b shows the number of interpeptide (empty bars) and intrapeptide (filled bars) CO–CO interactions at 0.3 M (red) and 0.03 M (blue) concentrations.
We observe a considerable number of interactions among the CO dipoles both intramolecular and with other peptides within a cluster versus cluster size (Figure 5b). We have defined a CO–CO interaction as present if the distance between the two atoms is ≤4.2 Å (taken from the first minimum of the radial distribution of C atoms about O atoms). All peptides, irrespective of cluster size, form about 5 intrapeptide CO–CO interactions in both systems. Most of these interactions occur between adjacent dipoles that are oriented in the same direction. We notice that the number of interpeptide CO–CO interactions increases as cluster size increases in the 0.3 M system as opposed to the steady number of intrapeptide interactions. This is a clear concentration dependent stabilizing effect.
An interaction between CO dipoles is not considered a traditionally stabilizing protein/peptide interaction. However, such an interaction is possible due to the partially positively charged C atom and the partially negatively charged O atom. Different groups have seen evidence supporting the stabilizing effect of these effective interactions. Some have referred to these correlated non-H-bonding interactions of the peptide group or in terms of quantum chemical descriptors as in n → π* interactions.38,44 Others have used a classical electrostatic description of these interactions such as “dipolar electrostatic” interactions.45 Several such interactions have been observed in crystal structures of small molecules, protein–ligand, and protein structures.38,44,45 As the classical electrostatics in the force fields we use are parametrized in part from quantum chemical calculations, they represent similar model energetic concepts.
Figure 6 depicts the pair probability distribution of the energy for traditional H-bonds and the CO–CO interaction between peptides in the 0.3 M system. Our pair energy distribution for the H-bond uses only the CO to NH interaction. Using the whole peptide moiety produces a value a couple of kcal/mol lower for both the traditional H-bonds and the CO interactions but does not change the number or probability of the interactions. While the CO–CO interaction is weaker than the CO-NH interaction (the lowest point of the CO to CO peak occurs at −3.0 kcal/mol in comparison to −4.0 kcal/mol for the CO to NH), there are far more CO–CO interactions as indicated both by the heights of the peaks and by Figure 5. Thus, CO–CO interactions, while weaker, contribute more to the overall stability of the clusters. Therefore, it appears that stable clusters are formed with hardly any appreciable role played by the expected peptide–peptide H-bonds. Other, nontraditional dipolar interactions are seen here to play a significant role holding the clusters together.
Figure 6.

Pair energy probability distribution of interaction energy from CO to NH groups (red) and between CO groups (blue) between peptides at 0.3 M.
Structural Stabilization of Clusters
Stable secondary structural elements such as α-helices and β-sheets are absent in the aggregates in the 0.3 M system (Figure 1a). However, we do observe order in the arrangement of atoms about each other by charge. Figure 7 shows the radial distribution of positively charged atoms (H and C) about negatively charged atoms (N, O, and Cα), negative about negative, and positive about positive, between peptides. The peak near 2 Å in the +– curve is from the H···O interactions of hydrogen bonds. Similarly, the peaks at ∼3 Å in both the like charge curves (++ and −−) are also due to atoms involved in H-bonding, with the distribution of C atoms about H atoms causing the peak in the ++ curve, and the distribution of N about O causing the peak in the −– curve. Beyond these, there is a layer of unlike charges at 4.0 Å. Distribution of C atoms about O atoms occurs in this peak. A final layer of like charges occurs at 5 Å before the correlations deteriorate. A shoulder at 4.0 Å in the −– curve is caused by the distribution of oxygen atoms about each other. Thus, while the peptides do not interact via H-bonds, they do arrange themselves such that the charged atoms form layers about each other facilitating the formation of other, non-H-bond interactions. We have previously observed charge correlations causing peptides to undergo changes in solubility as well as structure.22 The structure is not unexpected from the arrangements seen in other charged systems such as fused salts.46
Figure 7.

Distribution of atoms by charge between peptides in 0.3 M. Distribution of oppositely charged atoms about each other is indicated by the red curve, distribution of positively charged atoms about each other is indicated by the black curve, and distribution of negatively charged atoms about each other is indicated by the blue curve.
Dipole Correlations
Each entire peptide group forms a dipole pointing toward the NH atoms. We calculated the dipole–dipole correlation with respect to the distance between the center of peptide charge, both within an oligopeptide and between oligopeptides, up to a distance of 10 Å for the concentrated system. The results are shown in Figure 8. The intrapeptide curve shows a strong positive correlation between 2 and 3 Å followed immediately by a strong negative correlation between 3 and 4 Å. These two peaks are caused by correlations between adjacent peptides. An example is shown in Figure 9a, where the two parallel dipoles are 3 Å apart, and the two antiparallel dipoles are 3.5 Å apart. Adjacent dipoles oriented in the same direction are usually involved in CO–CO interactions, as we previously observed when we estimated the number of intrapeptide CO–CO interactions (Figure 5b).
Figure 8.

Interpeptide (red) and intrapeptide (blue) dipole correlations with respect to distance in the 0.3 M system. The correlations between dipoles that have been identified as forming n → π* interactions in the K+-Fab complex38 are shown as black asterisks.
Figure 9.
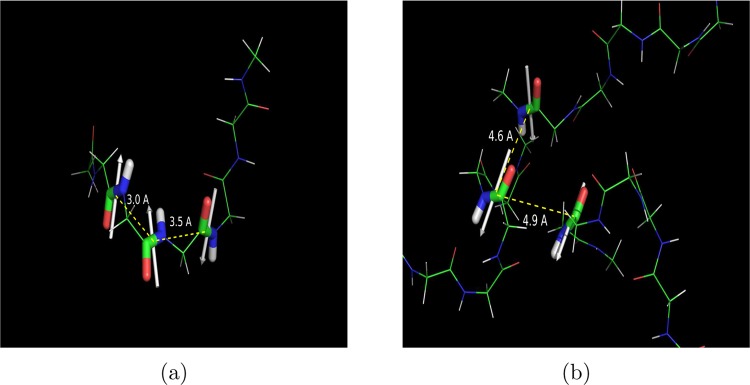
Examples of (a) intrapeptide and (b) interpeptide dipoles in the 0.3 M system. The dipoles are indicated by white arrows and point toward the NH atoms. Distances between the centers of the dipoles are indicated.
CO groups on adjacent dipoles have been observed forming n → π* interactions in the K+-Fab complex.38,47 Dipole correlations between the same dipoles are shown in Figure 8. They occur within our regions of positive intrapeptide dipole correlations for adjacent peptides. It is interesting to note because the interactions identified by Barlett et al. occur along a stretch of protein comprising varied sequences. Thus, while it could be argued that the absence of side chains in our system allowed the occurrence of these dipole correlations, their presence in protein complexes in regions composed largely of side chains indicates that they can and do occur in full length proteins and conceivably play a functional role there.
The third peak in Figure 8 (positive) occurs in both intra- and interpeptide correlations between 4 and 5 Å. Both H-bonds and CO–CO interactions occur at this distance. However, since there are no intrapeptide H-bonds to speak of, we find that in the intrapeptide curve at least, all the correlations at this distance are due to the CO–CO interaction. Thus, while n → π*-type interactions as defined by Raines and co-workers can occur only between adjacent amides, we find evidence that similar interactions can occur between peptide groups that might be quite far apart sequentially. Figure 9b shows examples of two such correlations between three dipoles across three different peptides. The dipoles are oriented such that the O atoms of each are pointed toward C atoms of the other dipole. While this brings the oxygen atoms of each dipole into close proximity, it also allows for the formation of interactions between the O atom of one dipole and the C atom of the other, which in turn hold these three different peptides together in a cluster.
Discussion
Glycines are often on the border between polar and nonpolar on many scales of solvophobicity.48 The oligomers of the glycine phase separate, and clustering is observed both experimentally and in the simulation of our concentrated system. The separation seen is similar to that observed in simulations of classically hydrophobic molecules such as neopentane and 2-butoxyethanol,40,41 as well as the turbidity observed in protein solutions undergoing liquid–liquid phase transitions.13,15 In our case, phase separation is accompanied by a decrease in the interpeptide potential energy, with both the van der Waal’s interaction and the electrostatic interaction contributing favorably. At the same time, the peptide–water interaction potential increased across the same period as the water molecules are excluded from the interiors of the peptides, again behavior often considered a part of the “hydrophobic effect” that drives protein folding. We observe further similarity between aggregation and protein folding in the solvation pattern of the aggregates, with relatively dry interiors, highly solvated surfaces, and channels of water traversing the clusters that resemble structures formed during intermediate stages of protein folding when water is being expelled from the interior of the protein.
H-bonding is believed to be necessary for the stabilization of the folded protein,2,35,49 and several studies have found that in the crystalline, three-dimensional native state, all the well-folded proteins are almost completely H-bonded;36,50−53 that is, few dangling or unsatisfied H-bonds are seen. In this study, we observe a small number of H-bonds per oligoglycine but not enough to explain the presence of the clusters. The absence of H-bonds has been noted before during the aggregation of tetramers of Aβ peptides.54 Here, the clusters are held together by other “non-traditional” dipolar interactions such as CO–CO interactions. While these interactions are weaker than a H-bond, they are more numerous, allowing them to play a significant role in holding the clusters together. Several other groups have noticed similar interactions leading to considerable structural and energetic stabilization of groups of small molecules.55,56
These CO–CO dipole interactions have been shown to affect the structures of well-folded proteins in several studies. Maccallum et al. showed that a dipole interaction between CO–CO dipoles in proteins contributes as much to the direction of the twist in β-sheets as steric hindrance between side chains.57,58 More recently, others showed that dipoles play a role in stabilizing various protein secondary structures by orienting them so that they are aligned with the external field created by the rest of the protein.39 Our results may be compared to previous observations about the absence of H-bonds in studies on the collapse of longer, single oligoglycines3,4 indicating that the same mechanism could be in effect in full-length unfolded, unordered proteins.
In other work, Raines and collaborators have shown that interactions between the C and O atoms of adjacent amides occur in several classes of protein structure.38 However, we observe correlations between CO atoms of amide groups at up to 6.4 Å indicating that these effective interactions occur not just between adjacent amide groups but could extend via the mechanism of charge layering throughout proteins. Charge layering and dipole correlations across the clusters together facilitate the formation of weaker interactions. This ordering, along with the weaker interactions allow the clusters to remain fluid, allowing them to explore several structural states with ease, an important feature in IDPs that allows them to perform their functions.
Conclusions
We observed phase separation of pentaglycines in water at 0.3 M into peptide clusters and water rich regions. From the water rich supernatant, we measured the saturation concentration for our model as 0.016 M. We did not see phase separation at 0.03 M, even though that concentration is above the solubility limit we measured apparently due to the system being kinetically limited. Interestingly, when we briefly heated the concentrated system, the kinetics markedly increased, an effect sometimes associated with the hydrophobic effect.42 These systems with very negative free energies of solvation4 are far from the classical definition of the hydrophobic solute.
Peptide clustering and aggregation in our model study were not driven by H-bond formation but by other dipolar interactions such as CO–CO interactions. Energetically, the CO–CO interactions are weaker than a H-bond but are more numerous and so play a significant role in stabilizing the clusters. Structural ordering of atoms by charge type and by correlations between amide dipoles facilitated the formation of such interactions.
Acknowledgments
We would like to thank Drs. Matt Auton, Cheng Zhang, Dilip Asthigari, and Robert Harris for helpful discussions. The Robert A. Welch Foundation (H-0037), the National Science Foundation (CHE-1152876), and the National Institutes of Health (GM-037657) are thanked for partial support of this work. This research was performed in part using the Keenland system, part of the National Science Foundation through XSEDE resources.
The authors declare no competing financial interest.
Funding Statement
National Institutes of Health, United States
References
- Flory P. J.Principles of Polymer Chemistry; Cornell University Press: Ithaca, NY, 1953. [Google Scholar]
- Bolen D. W.; Rose G. D. Structure and Energetics of the Hydrogen-Bonded Backbone in Protein Folding. Annu. Rev. Biochem. 2008, 77, 339–362. [DOI] [PubMed] [Google Scholar]
- Tran H. T.; Mao A.; Pappu R. V. Role of Backbone-Solvent Interactions in Determining Conformational Equilibria of Intrinsically Disordered Proteins. J. Am. Chem. Soc. 2008, 130, 7380–7392. [DOI] [PubMed] [Google Scholar]
- Hu C. Y.; Lynch G. C.; Kokubo H.; Pettitt B. M. Trimethylamine N-Oxide Influence on the Backbone of Proteins: An Oligoglycine Model. Proteins: Struct., Funct., Bioinf. 2010, 78, 695–704. [DOI] [PMC free article] [PubMed] [Google Scholar]
- Auton M.; Rösgen J.; Sinev M.; Holthauzen L. M.; Bolen D. W. Osmolyte Effects on Protein Stability and Solubility: A Balancing Act between Backbone and Side-Chains. Biophys. Chem. 2011, 159, 90–99. [DOI] [PMC free article] [PubMed] [Google Scholar]
- Arakawa T.; Bhat R.; Timasheff S. N. Preferential Interactions Determine Protein Solubility in Three-Component Solutions: The MgCl2 System. Biochemistry 1990, 29, 1914–1923. [DOI] [PubMed] [Google Scholar]
- Arakawa T.; Bhat R.; Timasheff S. N. Why Preferential Hydration Does Not Always Stabilize the Native Structure of Globular Proteins. Biochemistry 1990, 29, 1924–1931. [DOI] [PubMed] [Google Scholar]
- Timasheff S. N. The Control of Protein Stability and Association by Weak Interactions with Water: How Do Solvents Affect These Processes?. Annu. Rev. Biophys. Biomol. Struct. 1993, 22, 67–97. [DOI] [PubMed] [Google Scholar]
- Auton M.; Holthauzen L. M.; Bolen D. W. Anatomy of Energetic Changes Accompanying Urea-Induced Protein Denaturation. Proc. Natl. Acad. Sci. U.S.A. 2007, 104, 15317–15322. [DOI] [PMC free article] [PubMed] [Google Scholar]
- Fischer E. Synthese von Polypeptiden. XIV. Berichte der deutschen chemischen Gesellschaft 1906, 39, 453–474. [Google Scholar]
- Auton M.; Bolen D. W. Additive Transfer Free Energies of the Peptide Backbone Unit that are Independent of the Model Compound and the Choice of Concentration Scale. Biochemistry 2004, 43, 1329–1342. [DOI] [PubMed] [Google Scholar]
- Uversky V. N.; Oldfield C. J.; Dunker A. K. Showing your ID: Intrinsic Disorder as an ID for Recognition, Regulation and Cell Signaling. J. Mol. Recognit. 2005, 18, 343–384. [DOI] [PubMed] [Google Scholar]
- Teufel D. P.; Johnson C. M.; Lum J. K.; Neuweiler H. Backbone-Driven Collapse in Unfolded Protein Chains. J. Mol. Biol. 2011, 409, 250–262. [DOI] [PubMed] [Google Scholar]
- Hu C. Y.; Kokubo H.; Lynch G. C.; Bolen D. W.; Pettitt B. M. Backbone Additivity in the Transfer Model of Protein Solvation. Protein Sci. 2010, 19, 1011–1022. [DOI] [PMC free article] [PubMed] [Google Scholar]
- Dumetz A. C.; Chockla A. M.; Kaler E. W.; Lenhoff A. M. Protein Phase Behavior in Aqueous Solutions: Crystallization, Liquid-Liquid Phase Separation, Gels, and Aggregates. Biophys. J. 2008, 94, 570–583. [DOI] [PMC free article] [PubMed] [Google Scholar]
- De Young L. R.; Fink A. L.; Dill K. A. Aggregation of Globular Proteins. Acc. Chem. Res. 1993, 26, 614–620. [Google Scholar]
- Muschol M.; Rosenberger F. Liquid-Liquid Phase Separation in Supersaturated Lysozyme Solutions and Associated Precipitate Formation/Crystallization. J. Chem. Phys. 1997, 107, 1953–1962. [Google Scholar]
- Thomson J. A.; Schurtenberger P.; Thurston M. G.; Benedek G. B. Binary Liquid Phase Separation and Critical Phenomena in a Protein/Water Solution. Proc. Natl. Acad. Sci. U.S.A. 1987, 84, 7079–7083. [DOI] [PMC free article] [PubMed] [Google Scholar]
- Rozhkov S. P. Phase Transitions and Precrystallization Processes in a Water-Protein-Electrolyte System. J. Cryst. Growth. 2004, 273, 266–279. [Google Scholar]
- Vekilov P. G. Phase Diagrams and Kinetics of Phase Transitions in Protein Solutions. J. Phys.: Condens. Matter 2012, 24, 193101. [DOI] [PubMed] [Google Scholar]
- Cohn E. J.; Ferry J. D.. The Interactions of Proteins with Ions and Dipolar Ions. In Proteins, Amino Acids and Peptides as Ions and Dipolar Ions; Cohn E. J., Edsall J. T., Eds.; Reinhold: New York, 1943. [Google Scholar]
- Perkyns J. S.; Wang Y.; Pettitt B. M. Salting in Peptides: Conformationally Dependent Solubilities and Phase Behavior of a Tripeptide Zwitterion in Electrolyte Solution. J. Am. Chem. Soc. 1996, 118, 1164–1172. [Google Scholar]
- Arakawa T.; Timasheff S. N. Abnormal Solubility Behavior of Beta-Lactoglobulin: Salting-In by Glycine and NaCl. Biochemistry 1987, 26, 5147–5153. [DOI] [PubMed] [Google Scholar]
- Schmittschmitt J. P.; Scholtz J. M. The Role of Protein Stability, Solubility, and Net Charge in Amyloid Fibril Formation. Protein Sci. 2003, 12, 2374–2378. [DOI] [PMC free article] [PubMed] [Google Scholar]
- Crick S. L.; Ruff K. M.; Garai K.; Frieden C.; Pappu R. V. Unmasking the Roles of N- and C-terminal Flanking Sequences from Exon 1 of Huntingtin as Modulators of Polyglutamine Aggregation. Proc. Natl. Acad. Sci. U.S.A. 2013, 110, 20075–20080. [DOI] [PMC free article] [PubMed] [Google Scholar]
- Perkyns J. S.; Pettitt B. M. On the Solubility of Aqueous 1–1 Electrolytes. J. Phys. Chem. 1994, 98, 5147–5151. [Google Scholar]
- Swope W. C.; Anderson H. C. 106-particle Molecular-dynamics Study of Homogeneous Nucleation of Crystals in a Supercooled Atomic Liquid. Phys. Rev. B 1990, 41, 7042–7054. [DOI] [PubMed] [Google Scholar]
- Brooks B. R.; et al. CHARMM: The Biomolecular Simulation Program. J. Comput. Chem. 2009, 30, 1545–1614. [DOI] [PMC free article] [PubMed] [Google Scholar]
- Humphrey W.; Dalke A.; Schulten K. VMD – Visual Molecular Dynamics. J. Mol. Graphics 1996, 14, 33–38. [DOI] [PubMed] [Google Scholar]
- Phillips J. C.; Braun R.; Wang W.; Gumbart J.; Tajkhorshid E.; Villa E.; Chipot C.; Skeel R. D.; Kale L.; Schulten K. Scalable Molecular Dynamics with NAMD. J. Comput. Chem. 2005, 26, 1781–1802. [DOI] [PMC free article] [PubMed] [Google Scholar]
- MacKerell A. D. J.; et al. All-Atom Empirical Potential for Molecular Modeling and Dynamics Studies of Proteins. J. Phys. Chem. B 1998, 102, 3586–3616. [DOI] [PubMed] [Google Scholar]
- MacKerell A. D. J.; Feig M.; Brooks C. L. I. Extending the Treatment of Backbone Energetics in Protein Force Fields: Limitations of Gas-Phase Quantum Mechanics in Reproducing Protein Conformational Distributions in Molecular Dynamics Simulations. J. Comput. Chem. 2004, 25, 1400–1415. [DOI] [PubMed] [Google Scholar]
- Keeneland—Enabling Heterogenous Computing for the Open Science Community. http://keeneland.gatech.edu/.
- Edelsbrunner H.; Koehl P. The Weighted Volume Derivative of a Space Filling Diagram. Proc. Natl. Acad. Sci. U.S.A. 2003, 100, 2203–2208. [DOI] [PMC free article] [PubMed] [Google Scholar]
- Pauling L.; Corey R. B.; Branson H. R. The Structure of Proteins: Two Hydrogen-Bonded Helical Configurations of the Polypeptide Chain. Proc. Natl. Acad. Sci. U.S.A. 1951, 37, 205–211. [DOI] [PMC free article] [PubMed] [Google Scholar]
- Fleming P. J.; Rose G. D. Do All Backbone Polar Groups in Proteins Form Hydrogen Bonds?. Protein Sci. 2005, 14, 1911–1917. [DOI] [PMC free article] [PubMed] [Google Scholar]
- De Loof H.; Nilsson L.; Rigler R. Molecular Dynamics Simulation of Galanin in Aqueous and Nonaqueous Solution. J. Am. Chem. Soc. 1992, 114, 4028–4035. [Google Scholar]
- Bartlett G. J.; Choudhary A.; Raines R. T.; Woolfson D. N. n → π* Interactions in Proteins. Nat. Chem. Biol. 2010, 6, 615–620. [DOI] [PMC free article] [PubMed] [Google Scholar]
- Ripoll D. R.; Vila J. A.; Scheraga H. A. On the Orientation of the Backbone Dipoles in Native Folds. Proc. Natl. Acad. Sci. U.S.A. 2005, 102, 7559–7564. [DOI] [PMC free article] [PubMed] [Google Scholar]
- Gupta R.; Patey G. N. Association and Microheterogeneity in Aqueous 2-Butoxyethanol Solutions. J. Phys. Chem. B 2011, 115, 15323–15331. [DOI] [PubMed] [Google Scholar]
- Sarma R.; Paul S. Hydrophobic Interactions in Presence of Osmolytes Urea and Trimethylamine-N-Oxide. J. Chem. Phys. 2011, 135, 174501. [DOI] [PubMed] [Google Scholar]
- Chandler D. Interfaces and the Driving Force of Hydrophobic Assembly. Nature 2005, 437, 640–647. [DOI] [PubMed] [Google Scholar]
- Wuttke R.; Hofmann H.; Nettels D.; Borgia M. B.; Mittal J.; Best R. B.; Schuler B. Temperature-Dependent Solvation Modulates the Dimensions of Disordered Proteins. Proc. Natl. Acad. Sci. U.S.A. 2014, 111, 5213–5218. [DOI] [PMC free article] [PubMed] [Google Scholar]
- Newberry R. W.; VanVeller B.; Guzei I. A.; Raines R. T. n → π* Interactions of Amides and Thioamides: Implications for Protein Stability. J. Am. Chem. Soc. 2013, 135, 7843–7846. [DOI] [PMC free article] [PubMed] [Google Scholar]
- Paulini R.; Müller K.; Diederich F. Orthogonal Multipolar Interactions in Structural Biochemistry and Biology. Angew. Chem., Int. Ed. 2005, 44, 1788–1805. [DOI] [PubMed] [Google Scholar]
- Hansen J. P.; McDonald I. R. Statistical Mechanics of Dense Ionized Matter. IV. Density and Charge Fluctuations in a Simple Molten Salt. Phys. Rev. A 1975, 11, 2111–2123. [Google Scholar]
- Zhou Y.; Morais-Cabral J. H.; Kaufman A.; MacKinnon R. Chemistry of Ion Coordination and Hydration Revealed by a K+ Channel-Fab Complex at 2.0 Å Resolution. Nature 2001, 414, 43–48. [DOI] [PubMed] [Google Scholar]
- Wilce M. C. J.; Aguilar M.-I.; Hearn M. T. W. Physicochemical Basis of Amino Acid Hydrophobicity Scales: Evaluation of Four New Scales of Amino Acid Hydrophobicity Coefficients Derived from RP-HPLC of Peptides. Anal. Chem. 1995, 67, 1210–1219. [Google Scholar]
- Dill K. A.; MacCallum J. L. The Protein-Folding Problem, 50 Years On. Science.. 2012, 338, 1042–1046. [DOI] [PubMed] [Google Scholar]
- Baker E.; Hubbard R. Hydrogen Bonding in Globular Proteins. Prog. Biophys. Mol. Biol. 1984, 44, 97–179. [DOI] [PubMed] [Google Scholar]
- Stickle D. F.; Presta L. G.; Dill K. A.; Rose G. D. Hydrogen Bonding in Globular Proteins. J. Mol. Biol. 1992, 226, 1143–1159. [DOI] [PubMed] [Google Scholar]
- Savage H. J.; Elliott C. J.; Freeman C. M.; Finney J. L. Lost Hydrogen Bonds and Buried Surface Area: Rationalising Stability in Globular Proteins. J. Chem. Soc. Faraday Trans. 1993, 89, 2609–2617. [Google Scholar]
- McDonald I. K.; Thornton J. M. Satisfying Hydrogen Bonding Potential in Proteins. J. Mol. Biol. 1994, 238, 777–793. [DOI] [PubMed] [Google Scholar]
- Kim S.; Takeda T.; Klimov D. K. Mapping Conformational Ensembles of Aβ Oligomers in Molecular Dynamics Simulations. Biophys. J. 2010, 99, 1949–1958. [DOI] [PMC free article] [PubMed] [Google Scholar]
- Bent H. A. Structural Chemistry of Donor-Acceptor Interactions. Chem. Rev. 1968, 68, 587–648. [Google Scholar]
- Bernstein J.; Cohen M. D.; Leiserowitz L. In The Chemistry of the Quinoid Compounds; Patai S., Ed.; Interscience: New York, 1974; Vol. 1, pp 37–110.. [Google Scholar]
- Maccallum P. H.; Poet R.; Milner-White E. J. Coulombic Interactions between Partially Charged Main-Chain Atoms Not Hydrogen-Bonded to Each Other Influence the Conformations of Alpha-Helices and Antiparallel Beta-Sheet. A New Method for Analysing the Forces Between Hydrogen Bonding Groups in Proteins Includes All the Coulombic Interactions. J. Mol. Biol. 1995, 248, 361–373. [DOI] [PubMed] [Google Scholar]
- Maccallum P. H.; Poet R.; Milner-White E. J. Coulombic Attractions between Partially Charged Main-Chain Atoms Stabilise the Right-Handed Twist Found in Most Beta-Strands. J. Mol. Biol. 1995, 248, 374–384. [DOI] [PubMed] [Google Scholar]