

Abstract
The production of phytochelatins (PCs) provides an important means for plants to achieve tolerance to cadmium (Cd) toxicity. A reed gene encoding PC synthase (PaPCS) was isolated and its function tested through its heterologous expression in a strain of yeast sensitive to Cd. Subsequently, the Cd sensitive and high biomass accumulating species tall fescue was transformed either with PaPCS or PaGCS (a glutamyl cysteine synthetase gene of reed) on their own (single transformants), or with both genes together in the same transgene cassette (double transformant). The single and double transformants showed greater Cd tolerance and accumulated more Cd and PC than wild type plants, and their Cd leaf/root ratio content was higher. The ranking in terms of Cd and PC content for the various transgenic lines was double transformants>PaGCS single transformants>PaPCS single transformants>wild type. Thus PaGCS appears to exert a greater influence than PaPCS over PC synthesis and Cd tolerance/accumulation. The double transformant has interesting potential for phytoremediation.
Introduction
Heavy metal pollution caused by a combination of natural leaching and anthropogenic activity is becoming a significant environmental problem. Thousands of hectares of arable land have been contaminated in China, representing a significant health hazard to the population [1]–[3]. Phytoremediation is seen as a favorable strategy to remove the contamination. The optimal phytoremediating plant needs to be highly productive in terms of biomass and efficient in terms of accumulation of heavy metals [4], [5]. One such species is the reed Phragmites australis (Cav.) Trin. ex Steud, a most effective accumulator of Cd, Pb and Zn, and has been widely exploited as a sewage treatment wetland species [6]. However, the most efficient accumulators appear to be poor in terms of biomass production [7]–[9]. As a result, it has been proposed that an effective approach could be based on the engineering of heavy metal accumulation and tolerance into a species already recognized as being an effective biomass producer [10]–[12]. Tall fescue (Festuca arundinacea Schreb), a particularly vigorous grass species with broad climatic adaptation, could be an attractive recipient species, since turf grasses tolerate regular mowing, thus allowing for the ready disposal of the heavy metals translocated into their foliage. A number of genes involved in the uptake of and tolerance to heavy metals have been identified, and some have already been successfully transferred into plants [13]–[16], and it has been demonstrated that the heterologous expression of some of these improves the levels of heavy metal tolerance and accumulation.
The presence of heavy metals tends to induce the production of phytochelatins (PCs) in plants [17], [18]. The PCs form a family of oligopeptides able to neutralize the toxicity of heavy metals by chelation [19], [20]. Two key rate-limiting enzymes in the synthesis of PCs are phytochelatin synthase (PCS) and γ-glutamyl cysteine synthetase (γ-GCS) [21]. Their involvement in the accumulation of heavy metals has been experimentally confirmed in both Arabidopsis thaliana and Brassica juncea [22], [23] but it is unclear which of these two enzymes is the most important [24], [25]. We have previously shown that the γ-GCS glutamyl cysteine synthetase gene of P. australis (PaGCS) is a key component of the species' heavy metal tolerance, and that when this gene is expressed in the fast-growing species Agrostis palustris, tolerance to Cd toxicity is measurably enhanced [26]. In the present study we further explored the potential of P. australis as a donor of phytoremediation genes by testing the effect of expressing PaPCS and/or PaGCS in tall fescue.
Materials and Methods
Cloning of Phragmites australis phytochelatin synthase gene
Total RNA extracted from frozen P. australis leaf tissue using the TRIzol reagent (Invitrogen, Carlsbad, CA, USA) formed the template for the M-MLV reverse transcriptase driven synthesis of cDNA (TaKaRa Bio Group, Otsu, Japan). The resulting cDNA was amplified using the primer pair 5′-CTTCCAG(A/T)CTCA(G/A)TCGGAGC and 5′-ATTGC(G/C)ACTCCT(T/A)GACAGCA to obtain an initial PaPCS sequence. After sequencing this amplicon, further primers were derived to perform 3′-RACE and 5′-RACE (TaKaRa 3′- and 5′-Full RACE Core set), according to the manufacturer's protocols.
Yeast complementation assay
SacI/XbaI PaPCS cDNA fragments were sub-cloned into the pYES2 vector and transformed into Saccharomyces cerevisiae mutant strain YK44 (ura3-52 his3-200, ΔZRCΔCot1, mating type α) using the lithium acetate method [27]. Yeast cells harboring either an empty pYES2 vector or pYES2-PaPCS were cultured on SD-Ura medium (Difco BRL, USA) at 30°C until the OD600 reached 0.5. The cells were pelleted by centrifugation from a 500 µL aliquot of the culture and re-suspended in deionized water in 10−1, 10−2, and 10−3 concentrations, and then inoculated into 40 µL YPGAL (1% w/v yeast extract, 2% w/v peptone, 2% w/v galactose, Difco) medium in the presence of 100 µM CdCl2. All experiments were done in quadruplicate.
Construction of plant expression vectors
The XbaI/SacI PaPCS cDNA fragment was cloned into the pROKII vector (Fig. S1A), and the resulting pROK/PaPCS fusion was transformed into E. coli DH10B by thermal shock. The 35S::PaPCS-Tnos fragment released from pROK/PaPCS and the equivalent for PaGCS [26] were fused and inserted into the plant gene expression vector pCAMBIA3301 based on NPTII as the selectable marker (Fig. S1B). The recombinant vector (p3301/PG) was then transformed into E. coli DH10B.
Transformation of tall fescue
The binary plasmids pROK/PaGCS, pROK/PaPCS and p3301/PG were separately introduced into the Agrobacterium tumefaciens strain AGL1. Putative transformants were selected by including 50 mg/L kanamycin in the culture medium. Subsequent tissue culture and agroinfection of the hypocotyledonary axis were performed as reported by Fu et al (2007). Prior to agroinfection, F. arundinacea embryogenic calli were grown for one week on MS medium [28] containing 2 mg/L 2,4-dichlorophenoxyacetic acid (2,4-D). Following the agroinfection process, the embryogenic calli were exposed to 2 mg/L and 50 mg/L kanamycin for two weeks, after which the surviving calli were transferred to a differentiation medium (MS medium containing 1 mg/L 6-BA, 1 mg/L IAA and 50 mg/L kanamycin) for one month. Rooted seedlings were hardened on differentiation medium with the addition of 2 mg/L clobutrazol and 50 mg/L kanamycin for two weeks before being transplanted into soil in a greenhouse.
Plant material and stress treatment
Transgenic and wild type (WT) F. arundinacea rooted seedlings were transplanted into soil in a greenhouse (22±3°C under a 16 h photoperiod with a photosynthetic photon flux density of 45 µmol m−2 s−1). The seedlings were at tillering stage after being transplanted into the soil for 30 days. Then, WT and transgenic tiller clones were transferred into Hoagland's solution, and exposed for five days to 150 µM CdCl2.
Genetic analysis of putative transformants
Genomic DNA was isolated from the leaf of candidate transformants using the CTAB method [29]. A fragment beginning within the 35S promoter and ending within the PaGCS coding region was amplified as previously described [26] for the detection of PaGCS transformants. To detect candidate PaPCS transformants, a primer pair was designed to target a similar fragment of the PaPCS transgene (primer sequences were 5′-CTTCCAGACTCAGTCGGAGC and 5′-ATTGCGACTCCTTGACAGCA). Each 20 mL PCR reaction contained 0.4 µM of each primer, 400 µM dNTP, 1.5 mM MgCl2, 1.25 U rTaq DNA polymerase (Takara, Japan) and either 300 ng plant DNA or 15 pg plasmid. Each PCR consisted of a denaturation step (95°C/5 min), followed by 35 cycles of 95°C/40 s, 55°C/60 s 72°C/60 s, ending with an extension step of 72°C/10 min. PCR products were separated by 1% agarose gel electrophoresis. The presence of the transgene was also tested by Southern hybridization. For this purpose, 15 µg EcoRI- or SacI digested genomic DNA was electrophoresed through a 0.8% agarose gel and electrophoretically transferred onto a Hybond N+ membrane (Amersham, Piscataway, NJ, USA). The membranes were hybridized with the PaGCS or PaPCS amplicons labeled with digoxigenin using the random primer method (DIG High Prime DNA Labeling and Detection Starter Kit II, Roche, Basel, Switzerland). Hybridization, washing and signal detection were performed according to the manufacturer's instructions.
Biomass assay and the assessment of Cd2+ uptake
The biomass of WT and transgenic tiller clones exposed to 150 µM CdCl2 for five days was recorded. Each plant was thoroughly washed with distilled water, divided into leaves, shoots, and roots. Root samples were washed for 10 min at 4°C in 2 mM CaSO4 and 10 mM EDTA, and rinsed three times in water, and then placed into oven dried to a constant weight. A sample of 30 mg dry matter was digested in HNO3 and HClO4 (4∶1 v/v). Then it was evaporated to dryness and dissolved in 2 mol/L HNO3. The concentration of Cd2+ in the solvent was determined as described by Vitória, Lea & Azevedo [30], using an inductively coupled plasma mass spectrometer (ICP-MS). All experiments were done in quadruplicate.
MDA content
Top most expanded leaves of transgenic and wild-type tall fescue with or without Cd treatment were collected. Malondialdehyde (MDA) content was determined by measuring the concentration of thiobarbituric acid-reacting material present, using thiobarbituric acid (TBA) [31]. Fresh leaves were homogenized with 2 mL of TBA reagent (15% w/v ti-ichloroacetic acid and 0.25 M HCl), and treated in a boiling water bath for 15 minutes. After cooling, the suspension was centrifuged at 10,000× g for 10 minutes. The supernatant was then separated. The absorbance was measured at 535 nm. The MDA concentration was determined by the specific absorbance coefficient (156 mM−1 cm−1). The MDA concentrations were measured after a 0 h, 6 h, 12 h, 24 h, 48 h, 72 h and 120 h exposure to 150 µM CdCl2. All treatments and experiments were using different plants done in quadruplicate. The MDA concentration unit was µmol·g−1DW.
Enzyme activity measurement
Top most expanded leaves of transgenic and wild-type tall fescue with or without Cd treatment were collected. Peroxidase (POD) and superoxide dismutase (SOD) activity were measured as described by Scebba et al. [32]. Fresh leaves were immediately frozen in liquid nitrogen and then ground in liquid nitrogen. The powder was suspended in 0.5 mL 0.1 M Tris pH 8.0, 1 mM PMSF, 1% (w/v) polyvinylpyrrolidone, 1% (w/v) sodium ascorbate and 1% (v/v) β-mercaptoethanol. Extracts were centrifuged twice at 26,000 g for 20 minutes (4°C), and the clarified supernatant was used for determination of enzyme activity.
Total protein of the crude extract was measured using the method of Bradford [33]. Different amounts (0.005, 0.010, 0.020 and 0.040 mL) of crude extract were added to a reaction mixture. The mixture contained 50 mM sodium phosphate buffer pH 7.8, 0.1 mM ethylenediaminetetraacetic acid, 13 mM methionine, 2 µM riboflavine and 75 µM 3-(4,5)-dimethylthiazol-2-yl-2,5-diphenyl-tetrazolium bromide (MTT). Exposing the mixture to cool white fluorescent light for 15 minutes started the reaction. The light was then switched off, the tubes were stirred and the blue color was measured at 560 nm. POD (E.C.1.11.1.7) activity was assayed in a reaction mixture. The mixture contained 10 mM potassium phosphate buffer pH 7.0, 10 mM H2O2 solution, 20 mM guaiacol and 0.01 mL of crude extract. Adding H2O2 and guaiacol solution at the same time started the reaction. The activity was determined by monitoring the increase of absorbance at 470 nm, as a result of guaiacol oxidation. Both SOD and POD enzyme activities were measured after a 0 h, 6 h, 12 h, 24 h, 48 h, 72 h and 120 h exposure to 150 µM CdCl2. All treatments and experiments were using different plants done in quadruplicate. POD activity unit was Δ460·min−1·g−1. SOD activity unit was Unit·mg−1.
The non-protein thiol, GSH and PCs quantification
Total glutathione (GSH) content was determined as described by Gupta et al. [34]. Frozen tillers (700 mg FW) was homogenized in 0.1 M sodium phosphate buffer (pH,8.0) and 25% HPO3, centrifuged at 20,000 g for 20 minutes and GSH was fluorometrically determined in the supernatant after 15 minutes incubation at 25°C with o phthaldehyde (OPT) and the fluorescent intensity was recorded at 420 nm after excitation at 350 nm on a Hitachi Fluorescence Spectrophotometer (Model No. 650-60). The non-protein thiol (TNP-SH) content was determined as described by Tu et al. [35]. The PC content were measured by HPLC as described by Gupta et al., using PC2 and PC3 as PC standards [34]. TNP-SH, GSH and PC content were measured after a 0 h, 6 h, 12 h, 24 h, 48 h, 72 h and 120 h exposure to 150 µM CdCl2. All treatments and experiments were using different plants done in quadruplicate. TNP-SH, GSH and PC content unit were µmol·g−1DW.
Statistical analysis
For each statistical test, a threshold of P<0.05 was applied to indicate statistical significance. The data were analyzed using the SAS statistical package (v5.1, SAS Institute Inc., Cary, NC, USA).
Results
Isolation and function of PaPCS
The consensus regions shared by the PCS sequences present in bread wheat, pea, onion, Zinnia elegans and tomato provided the target for the design of PCR primers. A full-length P. australis cDNA was obtained by RACE-PCR. The PaPCS (GenBank accession number JX826285) sequence length was 1497 bp, and comprised a single open reading frame encoding a 498 residue polypeptide of predicted molecular mass ∼54.9 kDa. A phylogenetic analysis showed that its nucleotide sequence shared considerable similarity with its homologs from bread wheat (84.3%), bermudagrass (84.3%) and rice (70.9%). The closest related peptide sequence was the PCS from bermudagrass (Fig. S2). The presence of the pYES2-PaPCS construct in the Cd-sensitive yeast strain YK44 supported cell growth when the yeast was challenged by 100 µM CdCl2 (Fig. 1).
Figure 1. Functional testing of PaPCS in the Cd sensitive yeast strain YK44.
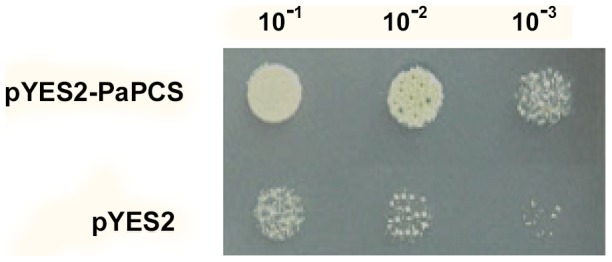
Yeast cells harboring either an empty pYES2 vector or pYES2-PaPCS were cultured and inoculated into 40 µL YPGAL medium in 10−1, 10−2, and 10−3 concentrations in the presence of 100 µM CdCl2. After 48 h, the growth of transgenic cells heterologously expressing PaPCS was compared to control cells carrying an empty pYES2 vector. All experiments were done in quadruplicate.
Transformation of tall fescue with PaPCS or PaGCS or PaPCS-PaGCS
Granular embryogenic calli were used for agroinfection (Figs. 2A, S3A, S4A). Two weeks after agroinfection with either pROK/PaGCS, pROK/PaPCS or p3301/PG (Figs. 2B, S3B, S4B), kanamycin resistant calli having a yellow granulated structure were selected (Figs. 2C, S3C, S4C), shoots and roots were induced (Figs. 2D, S3D, S4D) and a second round of kanamycin selection was applied to remove escapes (Figs. 2E, S3E, S4E). In all, 95 putative transgenic PaPCS plants, 87 PaGCS plants and 15 PaPCS/PaGCS plants were regenerated (Figs. 2F, S3F, S4F). The PCR-based screening of the putative transgenics identified seven PaPCS, eleven PaGCS transgenic lines and three PaPCS/PaGCS transgenic lines. Of these, two per transgene were taken forward. A semi-quantitative RT-PCR analysis showed that transgene transcript appeared in transgenic lines (Fig. 3A,C). Profiling the genomic DNA of the six selected transformants by Southern hybridization showed that a single copy of PaPCS was integrated into each of the two PaPCS lines, a single copy of PaGCS into one of the PaGCS lines (and two copies into the other), and a single copy of PaPCS-PaGCS into each of the PaPCS/PaGCS lines (Fig. 3B,D).
Figure 2. Transformation of F. arundinacea with PaGCS.

(A) Callus induction, (B) Agroinfection, (C) Kanamycin selection of transgenic calli, (D) Regenerated plants, (E) Selected plants maintain their greenness in the presence of kanamycin, (F) Putative transgenic plants grown in soil.
Figure 3. DNA fingerprinting to confirm the presence of PaPCS (A,B) and PaGCS (C,D).
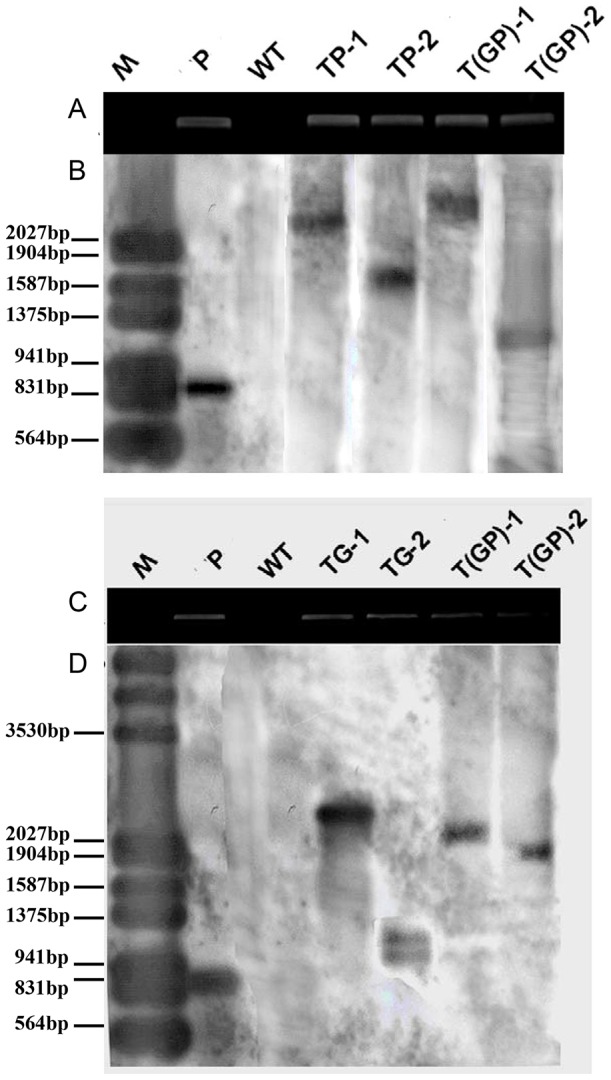
(A,C) PCR analysis, (B,D) Southern blot hybridization of EcoRI and SacI digested genomic DNA. TP-1, TP-2: carriers of PaPCS; TG-1, TG-2: carriers of PaGCS; T(GP)-1, T(GP)-2: carriers of PaGCS-PaPCS; P: plasmid; WT: wild type F. arundinacea. M: size marker.
Growth and Cd accumulation of WT and transgenic tall fescue plants
After five days exposure to 150 µM CdCl2, the total biomass of each of the three types of transgenic lines was greater than that of the WT, with the double transformant being the most productive, suggesting a better Cd tolerance. However, the total biomass increase for PaPCS transgenic lines was not significant (Fig. 4). The Cd content of each of the three types of transgenic lines was significant greater than that of the WT in leaf and root, in the order of double transformants>PaGCS single transformants>PaPCS single transformants>WT (Fig. 5). The root was higher than that of the leaf in each case, and the double transformant accumulated more Cd than did either of the single transformants. The ratio between the leaf and root Cd content was higher for the transgenic material than for the WT. In WT, the Cd content in the root was 1.9 fold higher than that of in the leaf, this ratio was significant decreased in PaPCS transgenic lines (1.4 fold) and PaGCS transgenic lines (1.1–1.28 fold). In the double transformant, the ratio was 1.0–1.2 fold, which was not significantly different with PaGCS transgenic lines (Tab. 1), suggesting these transgenic plant was particularly efficient in translocating Cd from the root to the leaf.
Figure 4. The total biomass accumulation after exposure to 150 µM CdCl2 for five days.

TP-1, TP-2: carriers of PaPCS; TG-1, TG-2: carriers of PaGCS; T(GP)-1, T(GP)-2: carriers of PaGCS-PaPCS; WT: wild type F. arundinacea. Vertical bars indicate the standard error of the mean (n = 4). Different letters indicate significant differences according to a Tukey test (P<0.01).
Figure 5. Cd2+ accumulation of transgenic lines and wild type after exposure to 150 µM CdCl2 for five days.

The Cd content of the roots, leaves and total plant was measured in four plants per line. TP-1, TP-2: carriers of PaPCS; TG-1, TG-2: carriers of PaGCS; T(GP)-1, T(GP)-2: carriers of PaGCS-PaPCS; WT: wild type F. arundinacea. Vertical bars indicate the standard error of the mean(n = 4). Different letters indicate significant differences according to a Tukey test (P<0.01).
Table 1. Ratio of Cd root/leaf content.
| plant lines | Ratio of Cd root/leaf content |
| WT | 1.9312±0.165 a |
| TG-1 | 1.2878±0.103 c |
| TG-2 | 1.1059±0.111 c |
| TP-1 | 1.4341±0.121 b |
| TP-2 | 1.4058±0.134 b |
| T(GP)-1 | 1.1948±0.128 c |
| T(GP)-2 | 1.0522±0.110 c |
Values are mean ± standard error (n = 4). For each variable, values followed by different letters differ significantly between the strains (Student's t-test, P<0.05).
MDA content and enzyme activities under Cd stress
After 6 h of Cd stress, the MDA content of both the transgenic and WT plants began to rise, with the rate of increase being fastest in the WT plants. The rate of increase in MDA content was slowest in the two double transformants, followed first by the PaGCS single transformants and then by the PaPCS single transformants (Fig. 6A). Thus in the transgenic plants, lipid peroxidation was slowed, and this slowing was more effective in the presence of PaGCS.
Figure 6. Short term response of plants to Cd exposure/After 0–120 h, the leaves were sampled for (A) MDA content, (B) SOD activity, (C) POD activity.

TP-1, TP-2: carriers of PaPCS; TG-1, TG-2: carriers of PaGCS; T(GP)-1, T(GP)-2: carriers of PaGCS-PaPCS; WT: wild type F. arundinacea. Vertical bars indicate the standard error of the mean (n = 4).
After 6 h of Cd stress, the MDA content of both the transgenic and WT plants began to rise, with the rate of increase being fastest in the WT plants. The rate of increase in MDA content was slowest in the two double transformants and PaGCS single transformants, followed by the PaPCS single transformants (Fig. 6A).
Thus in the transgenic plants, lipid peroxidation was slowed, and this slowing was more effective in the presence of PaGCS. SOD and POD activity all peaked rather quickly in response to the Cd stress, the former by 6 h, and the latter by 12 h (Figs. 6B, C). At its peak, SOD activity was highest in the WT, followed by the PaPCS transgenics, the PaGCS transgenics and finally the double transformants (Fig. 6B). At its peak, POD activity had the same pattern as SOD activity (Fig. 6C). After peaking, both SOD and POD activity sharply decreased. Thus, after 24 h of Cd stress, both SOD and POD activity had dropped below their initial level. At this time, the ranking of enzyme activity was PaGCS/PaPCS transgenics>PaGCS transgenics>PaPCS transgenics>WT.
GSH, PC and TNP-SH content of transgenic tall fescue under cadmium stress
Before exposure to Cd stress, the total GSH content of the three transgenic types was similar to that of WT plants, as well as the PC and TNP-SH content. As the Cd stress was applied, the total GSH content of WT and the transgenic plants did not significantly change (Fig. 7A), but both the PC and TNP-SH content increased (Figs. 7B, C, S5). Overall, with respect to PC, the double transformants out-performed each of the single transformants; the PaGCS transgenic was superior to the PaPCS transgenic, and both single transformants out-performed WT (Fig. 7C).
Figure 7. Short term response of plants to Cd exposure/After 0–120 h, the leaves were sampled for (A) Total glutathione (GSH) content, (B) Non-protein thiol (TNP-SH) content, (C) PC content.

TP-1, TP-2: carriers of PaPCS; TG-1, TG-2: carriers of PaGCS; T(GP)-1, T(GP)-2: carriers of PaGCS-PaPCS; WT: wild type F. arundinacea. Vertical bars indicate the standard error of the mean (n = 4).
Discussion
PCS is the enzyme which catalyses the final step in the synthesis of phytochelatin, so it has been the major focus in the field of the genetic engineering of phytoremediation ever since it was first identified by Vatamaniuk et al. [36] and Clemens et al. [37]. Expression of PCS in both prokaryotes and yeast increases tolerance to heavy metals [38]–[40], as well as to various abiotic stresses in Anabaena [41]. In the present study, when the PaPCS gene was expressed in a strain of yeast sensitive to Cd, the tolerance of the cells to the presence of 100 µM CdCl2 in the growth medium was noticeably improved. The introduction of PCS genes from various species into plants has also generally resulted in an improved ability to tolerate and/or accumulate heavy metals. Examples include the heterologous expression of A. thaliana AtPCS1 in tobacco [42] and Indian mustard [43], bread wheat TaPCS1 and Ceratophyllum demersum CdPCS1 in tobacco [40], and that of Nelumbo nucifera NnPCS and CdPCS1 in A. thaliana [44]–[46]. When a PCS deficient A. thaliana mutant was transformed with AtPCS1 driven by a leaf-specific promoter, the resulting lines proved less sensitive to Cd toxicity [47]. However, although over-expression of AtPCS1 helped raise the level of tolerance to arsenic [48], it also resulted in a higher sensitivity to Cd [49]. In the present study heterologous expression of PaPCS in tall fescue improved the plants' ability to accumulate biomass in the presence of 150 µM CdCl2, which demonstrated the contribution that this gene makes to Cd tolerance.
However, the previous studies paid more attention on single overexpression of genes involved in chelation, and it indicated that overexpression of genes involved in PCs synthesis in plants results in either hypersensitivity or tolerance to Cd [50]–[51]. In our study, the line overexpressed single PaPCS or PaGCS, was tolerant to Cd stress (Fig. 4). It had higher content of PCs (Fig. 7) and accumulated higher amounts of this metal (Fig. 5) than WT. This result supported some of the above reports. In our study, the transgenic lines simultaneous overexpressed PaPCS and PaGCS gene had higher contents of Cd and PCs than WT and single-gene transgenic lines after Cd exposure (Fig. 5,7). This result is consistent with the previous study on the transgenic lines simultaneous overexpressed CsPCS and YCF1 which accumulated higher amounts of Cd than single-gene transformants [52]. This showed that multiple overexpression of genes involved in chelation can led to a higher increase on the tolerance and accumulation to heavy metal, it might be a way of acquiring more efficient hyperaccumulator.
The behaviour of MDA content and the patterns of SOD and POD activity confirmed this conclusion, since the leaf content of MDA in the non-transgenic plants remained substantially higher than in the PaPCS transgenic lines (Fig. 6A). The significance of MDA content lies in its being a diagnostic for the severity of oxidative stress. It is suggested that the level of oxidative damage in the transgenic lines was less severe than in the WT. Consistently, both SOD and POD activity were higher in the PaPCS transgenics than in the WT 24 h after the stress was imposed (Fig. 6B, 6C). Heavy metals in their ionic state are considered to be rather more toxic than when they are complexed with organic molecules, for instance the PCs. The PaPCS transgenic lines accumulated more Cd than the WT, but at the same time they were able to neutralize this additional Cd by enhancing the cellular level of PC.
It has been noted that the tissue-specific expression of PC biosynthesis genes can result in the relocation of heavy metal mediated by the long distance xylem transport of γ-glutamylcysteine, and PCs [53], [54]. However, little is known about the relationship between growth condition, PC content and redistribution of Cd of the transgenic lines with single or double PC biosynthesis genes. Here, we detected the variation of the redistribution of Cd of the WT and three transgenic lines, and found that the heterologous overexpression of PaGCS in tall fescue increased the ratio of Cd root/leaf content (Tab. 1), which is consistent with the previous study of PaGCS heterologous overexpression in Agrostis palustris [26]. Heterologous overexpression of PaPCS in tall fescue also increased the ratio of Cd root/leaf content (Table 1). This phenomenon has been observed in previous study of wheat PCS overexpressed in rice, in which the Cd accumulation were increased in shoot, but not changed in root [55]. However, other study did not show the redistribution of Cd in PCS transgenic plants, which suggested the redistribution might depend on the gene sources [52], [53], [56].
In previous study, the growth of PCS transgenic plants appeared to be inhibited under Cd stress, although when the plants were given exogenous GSH, this sensitivity disappeared. The interpretation of this behavior was that glutathione must be necessary for the operation of PCS. γ-GCS catalyzes the initial step of GSH synthesis, and it is generally understood that GSH synthesis is a rate limiting step for PCS activity. Heterologous expression of the E. coli γ-GCS gene gshl in poplar chloroplasts is known to enhance the accumulation of GSH [56]. When PaGCS and PaPCS were simultaneously introduced into tall fescue, the double transformant line out-performed both of the single transgene carriers, which were superior to the WT. This out-performance was measurable in terms of biomass accumulation, MDA content and antioxidant enzyme activity. The implication is that of the two genes PaGCS and PaPCS, the former has a stronger beneficial effect than the latter on heavy metal tolerance.
Supporting Information
The plant expression vectors (A) pROK/PaGCS, and (B) p3301/PG. RB and LB: right and left borders of the Ti plasmid; Tnos : nos terminator (260 bp).
(TIF)
Phylogeny of deduced phytochelatin synthase polypeptides.
(TIF)
Transformation of F. arundinacea with PaPCS . (A) Callus induction, (B) Agroinfection, (C) Kanamycin selection of transgenic calli, (D) Regenerated plants, (E) Selected plants maintain their greenness in the presence of kanamycin, (F) Putative transgenic plants grown in soil.
(TIF)
Transformation of F. arundinacea with PaGCS-PaPCS . (A) Callus induction, (B) Agroinfection, (C) Kanamycin selection of transgenic calli, (D) Regenerated plants, (E) Selected plants maintain their greenness in the presence of kanamycin, (F) Putative transgenic plants grown in soil.
(TIF)
PC2 and PC3 content after short term Cd exposure/After 0–120 h, the leaves were sampled for (A) PC2 and (B) PC3. TP-1, TP-2: carriers of PaPCS ; TG-1, TG-2: carriers of PaGCS ; T(GP)-1, T(GP)-2: carriers of PaGCS-PaPCS ; WT: wild type F. arundinacea . Vertical bars indicate the standard error of the mean (n = 4).
(TIF)
Acknowledgments
We thank Prof. Dietrich Nies (Martin-Luther-Universität, Halle-Wittenberg) for providing yeast strain YK44, and the Department of Plant Pathology, Kansas State University, USA for access to their DNA sequencing facility. Thanks to Dr. Robert Koebner (UK), for linguistic advice.
Funding Statement
This research was supported by Key Projects in the National Science & Technology Pillar Program in the 12th Five year Plan of China (grant no. 2011BAI06B01), the National Natural Science Foundation of China (grant no. 30970243), International technology cooperation project of Shandong Province of China (grant no. 2011176), Science & Technology Plan of Shandong Province (grant 2009GG10002001) and the Chinese Natural Education Ministry Doctor Station Foundation Fellowship (grant no. 913111006). The funders had no role in study design, data collection and analysis, decision to publish, or preparation of the manuscript.
References
- 1. Ding TD, Ni WM, Zhang JY (2012) Research advances in heavy metals pollution ecology of diatom. Ying Yong Sheng Tai Xue Bao 23: 857–866. [PubMed] [Google Scholar]
- 2. Guo XL, Gu J, Chen ZX, Gao H, Qin QJ, et al. (2012) Effects of heavy metals pollution on soil microbial communities metabolism and soil enzyme activities in coal mining area of Tongchuan, Shaanxi Province of Northwest China. Ying Yong Sheng Tai Xue Bao 23: 798–806. [PubMed] [Google Scholar]
- 3. Ellis JK, Athersuch TJ, Thomas LD, Teichert F, Perez-Trujillo M, et al. (2012) Metabolic profiling detects early effects of environmental and lifestyle exposure to cadmium in a human population. BMC Med 10: 61. [DOI] [PMC free article] [PubMed] [Google Scholar]
- 4. Salt DE, Smith RD, Raskin I (1998) PHYTOREMEDIATION. Annu Rev Plant Physiol Plant Mol Biol 49: 643–668. [DOI] [PubMed] [Google Scholar]
- 5. Suresh B, Ravishankar G (2004) Phytoremediation-A novel and promising approach for environmental clean-up. Crit Rev Biotechnol 24: 97–124. [DOI] [PubMed] [Google Scholar]
- 6. Bonanno G, Lo Giudice R (2010) Heavy metal bioaccumulation by the organs of Phragmites australis (common reed) and their potential use as contamination indicators. Ecological Indicators 10: 639–645. [Google Scholar]
- 7. Olguín EJ, Sánchez-Galván G (2012) Heavy metal removal in phytofiltration and phycoremediation: the need to differentiate between bioadsorption and bioaccumulation. New Biotechnol 30: 3–8. [DOI] [PubMed] [Google Scholar]
- 8. Bhargava A, Carmona FF, Bhargava M, Srivastava S (2012) Approaches for enhanced phytoextraction of heavy metals. J Environ Manage 105: 103–120. [DOI] [PubMed] [Google Scholar]
- 9. Huang J, Xia H, Li Za, Xiong Y, Kong G (2009) Soil aluminium uptake and accumulation by Paspalum notatum . Waste Management & Research 27: 668–675. [DOI] [PubMed] [Google Scholar]
- 10. Cassina L, Tassi E, Morelli E, Giorgetti L, Remorini D, et al. (2011) Exogenous cytokinin treatments of an Ni hyper-accumulator, Alyssum murale, grown in a serpentine soil: Implications for phytoextraction. Int J Phytoremediat 13: 90–101. [DOI] [PubMed] [Google Scholar]
- 11. Seth C, Misra V, Chauhan L (2012) Accumulation, detoxification, and genotoxicity of heavy metals in indian mustard (Brassica juncea L.). Int J Phytoremediat 14: 1–13. [DOI] [PubMed] [Google Scholar]
- 12. Bennett LE, Burkhead JL, Hale KL, Terry N, Pilon M, et al. (2003) Analysis of transgenic Indian mustard plants for phytoremediation of metal-contaminated mine tailings. J Environ Qual 32: 432–440. [DOI] [PubMed] [Google Scholar]
- 13. Gendre D, Czernic P, Conéjéro G, Pianelli K, Briat JF, et al. (2007) TcYSL3, a member of the YSL gene family from the hyper-accumulator Thlaspi caerulescens, encodes a nicotianamine-Ni/Fe transporter. Plant J 49: 1–15. [DOI] [PubMed] [Google Scholar]
- 14. Meyer C-L, Peisker D, Courbot M, Craciun AR, Cazalé A-C, et al. (2011) Isolation and characterization of Arabidopsis halleri and Thlaspi caerulescens phytochelatin synthases. Planta 234: 83–95. [DOI] [PubMed] [Google Scholar]
- 15. Dhankher OP, Li Y, Rosen BP, Shi J, Salt D, et al. (2002) Engineering tolerance and hyperaccumulation of arsenic in plants by combining arsenate reductase and γ-glutamylcysteine synthetase expression. Nat Biotechnol 20: 1140–1145. [DOI] [PubMed] [Google Scholar]
- 16. Gisbert C, Ros R, De Haro A, Walker DJ, Pilar Bernal M, et al. (2003) A plant genetically modified that accumulates Pb is especially promising for phytoremediation. Biochem Biophys Res Commun 303: 440–445. [DOI] [PubMed] [Google Scholar]
- 17. Zitka O, Krystofova O, Sobrova P, Adam V, Zehnalek J, et al. (2011) Phytochelatin synthase activity as a marker of metal pollution. J Hazard Mater 192: 794–800. [DOI] [PubMed] [Google Scholar]
- 18. Pal R, Rai J (2010) Phytochelatins: peptides involved in heavy metal detoxification. Appl Biochem Biotechnol 160: 945–963. [DOI] [PubMed] [Google Scholar]
- 19. Zhang ZC, Chen BX, Qiu BS (2010) Phytochelatin synthesis plays a similar role in shoots of the cadmium hyperaccumulator Sedum alfredii as in non-resistant plants. Plant Cell Environ 33: 1248–1255. [DOI] [PubMed] [Google Scholar]
- 20. Cobbett CS (2000) Phytochelatins and their roles in heavy metal detoxification. Plant Physiol 123: 825–832. [DOI] [PMC free article] [PubMed] [Google Scholar]
- 21. Hirata K, Tsuji N, Miyamoto K (2005) Biosynthetic regulation of phytochelatins, heavy metal-binding peptides. J Biosci Bioeng 100: 593–599. [DOI] [PubMed] [Google Scholar]
- 22. Liu Z, Gu C, Chen F, Yang D, Wu K, et al. (2012) Heterologous expression of a Nelumbo nucifera phytochelatin synthase gene enhances cadmium tolerance in Arabidopsis thaliana . Appl Biochem Biotechnol 166: 722–734. [DOI] [PubMed] [Google Scholar]
- 23. Brunetti P, Zanella L, Proia A, De Paolis A, Falasca G, et al. (2011) Cadmium tolerance and phytochelatin content of Arabidopsis seedlings over-expressing the phytochelatin synthase gene AtPCS1 . J Exp Bot 62: 5509–5519. [DOI] [PMC free article] [PubMed] [Google Scholar]
- 24. Wawrzyński A, Kopera E, Wawrzyńska A, Kamińska J, Bal W, et al. (2006) Effects of simultaneous expression of heterologous genes involved in phytochelatin biosynthesis on thiol content and cadmium accumulation in tobacco plants. J Exp Bot 57: 2173–2182. [DOI] [PubMed] [Google Scholar]
- 25. Wawrzynska A, Wawrzynski A, Gaganidze D, Kopera E, Piatek K, et al. (2005) Overexpression of genes involved in phytochelatin biosynthesis in Escherichia coli: effects on growth, cadmium accumulation and thiol level. Acta Biochim Pol 52: 109–116. [PubMed] [Google Scholar]
- 26. Zhao C, Qiao M, Yu Y, Xia G, Xiang F (2010) The effect of the heterologous expression of Phragmites australis γ-glutamylcysteine synthetase on the Cd2+ accumulation of Agrostis palustris . Plant Cell Environ 33: 877–887. [DOI] [PubMed] [Google Scholar]
- 27. Ito H, Fukuda Y, Murata K, Kimura A (1983) Transformation of intact yeast cells treated with alkali cations. J Bacteriol 153: 163–168. [DOI] [PMC free article] [PubMed] [Google Scholar]
- 28. Murashige T, Skoog F (1962) A revised medium for rapid growth and bio assays with tobacco tissue cultures. Physiol Plant 15: 473–497. [Google Scholar]
- 29. Doyle JJ (1990) Isolation of plant DNA from fresh tissue. Focus 12: 13–15. [Google Scholar]
- 30. Vitória AP, Lea PJ, Azevedo RA (2001) Antioxidant enzymes responses to cadmium in radish tissues. Phytochemistry 57: 701–710. [DOI] [PubMed] [Google Scholar]
- 31. Buege JA, Aust SD (1978) Microsomal lipid peroxidation. Method Enzymol 52: 302–310. [DOI] [PubMed] [Google Scholar]
- 32. Scebba F, Arduini I, Ercoli L, Sebastiani L (2006) Cadmium effects on growth and antioxidant enzymes activities in Miscanthus sinensis . Biol Plantarum 50: 688–692. [Google Scholar]
- 33. Bradford MM (1976) A rapid and sensitive method for the quantitation of microgram quantities protein using the principle of protein-dye binding. Biochem 72: 248–254. [DOI] [PubMed] [Google Scholar]
- 34. Gupta M, Tripathi R, Rai U, Chandra P (1998) Role of glutathione and phytochelatin in Hydrilla verticillata (I.f.) royle and Valusneria spiraus L. under mercury stress. Chemosphere 37: 785–800. [Google Scholar]
- 35. Tu S, Ma LQ, MacDonald GE, Bondada B (2004) Effects of arsenic species and phosphorus on arsenic absorption, arsenate reduction and thiol formation in excised parts of Pteris vittata L. Environ Exp Bot 51: 121–131. [Google Scholar]
- 36. Vatamaniuk OK, Mari S, Lu Y-P, Rea PA (1999) AtPCS1, a phytochelatin synthase from Arabidopsis: isolation and in vitro reconstitution. PNAS 96: 7110–7115. [DOI] [PMC free article] [PubMed] [Google Scholar]
- 37. Clemens S, Kim EJ, Neumann D, Schroeder JI (1999) Tolerance to toxic metals by a gene family of phytochelatin synthases from plants and yeast. EMBO J 18: 3325–3333. [DOI] [PMC free article] [PubMed] [Google Scholar]
- 38. Osaki Y, Shirabe T, Tamura S, Yoshimura E (2008) A functional putative phytochelatin synthase from the primitive red alga Cyanidioschyzon merolae . Biosci Biotechnol Biochem 72: 3306–3309. [DOI] [PubMed] [Google Scholar]
- 39. Singh S, Lee W, DaSilva NA, Mulchandani A, Chen W (2008) Enhanced arsenic accumulation by engineered yeast cells expressing Arabidopsis thaliana phytochelatin synthase. Biotechnol Bioeng 99: 333–340. [DOI] [PubMed] [Google Scholar]
- 40. Yong X, Chen Y, Liu W, Xu L, Zhou J, et al. (2014) Enhanced cadmium resistance and accumulation in Pseudomonas putida KT2440 expressing the phytochelatin synthase gene of Schizosaccharomyces pombe. Lett Appl Microbiol 58: 255–261. [DOI] [PubMed] [Google Scholar]
- 41. Chaurasia N, Mishra Y, Rai LC (2008) Cloning expression and analysis of phytochelatin synthase (pcs) gene from Anabaena sp. PCC 7120 offering multiple stress tolerance in Escherichia coli . Biochem Biophy Res Commun 376: 225–230. [DOI] [PubMed] [Google Scholar]
- 42. Pomponi M, Censi V, Di Girolamo V, De Paolis A, di Toppi LS, et al. (2006) Overexpression of Arabidopsis phytochelatin synthase in tobacco plants enhances Cd2+ tolerance and accumulation but not translocation to the shoot. Planta 223: 180–190. [DOI] [PubMed] [Google Scholar]
- 43. Gasic K, Korban SS (2007) Transgenic Indian mustard (Brassica juncea) plants expressing an Arabidopsis phytochelatin synthase (AtPCS1) exhibit enhanced As and Cd tolerance. Plant Mol Biol 64: 361–369. [DOI] [PubMed] [Google Scholar]
- 44. Shukla D, Kesari R, Mishra S, Dwivedi S, Tripathi RD, et al. (2012) Expression of phytochelatin synthase from aquatic macrophyte Ceratophyllum demersum L. enhances cadmium and arsenic accumulation in tobacco. Plant Cell Rep 31: 1687–1699. [DOI] [PubMed] [Google Scholar]
- 45. Liu Z, Gu C, Chen F, Yang D, Wu K, et al. (2012) Heterologous expression of a Nelumbo nucifera phytochelatin synthase gene enhances cadmium tolerance in Arabidopsis thaliana . Appl Biochem Biotechnol 166: 722–734. [DOI] [PubMed] [Google Scholar]
- 46. Shukla D, Kesari R, Tiwari M, Dwivedi S, Tripathi RD, et al. (2013) Expression of Ceratophyllum demersum phytochelatin synthase, CdPCS1, in Escherichia coli and Arabidopsis enhances heavy metal(loid)s accumulation. Protoplasma 250: 1263–1272. [DOI] [PubMed] [Google Scholar]
- 47. Peterson AG, Oliver DJ (2006) Leaf-targeted phytochelatin synthase in Arabidopsis thaliana . Plant Physiol Biochem 44: 885–892. [DOI] [PubMed] [Google Scholar]
- 48. Li Y, Dhankher OP, Carreira L, Lee D, Chen A, et al. (2004) Overexpression of phytochelatin synthase in Arabidopsis leads to enhanced arsenic tolerance and cadmium hypersensitivity. Plant Cell Physiol 45: 1787–1797. [DOI] [PubMed] [Google Scholar]
- 49. Lee S, Moon JS, Ko T-S, Petros D, Goldsbrough PB, et al. (2003) Overexpression of Arabidopsis phytochelatin synthase paradoxically leads to hypersensitivity to cadmium stress. Plant Physiol 131: 656–663. [DOI] [PMC free article] [PubMed] [Google Scholar]
- 50. Shukla D, Tiwari M, Tripathi RD, Nath P, Trivedi PK (2013) Synthetic phytochelatins complement a phytochelatin-deficient Arabidopsis mutant and enhance the accumulation of heavy metal(loid)s. Biochem Biophys Res Commun 434: 664–669. [DOI] [PubMed] [Google Scholar]
- 51. Wu G, Kang H, Zhang X, Shao H, Chu L, et al. (2010) A critical review on the bio-removal of hazardous heavy metals from contaminated soils: issues, progress, eco-environmental concerns and opportunities. J Hazard Mater 174: 1–8. [DOI] [PubMed] [Google Scholar]
- 52. Guo J, Xu W, Ma M (2012) The assembly of metals chelation by thiols and vacuolar compartmentalization conferred increased tolerance to and accumulation of cadmium and arsenic in transgenic Arabidopsis thaliana . J Hazard Mater 199–200: 309–313. [DOI] [PubMed] [Google Scholar]
- 53. Gong JM, Lee DA, Schroeder JI (2003) Long-distance root-to-shoot transport of phytochelatins and cadmium in Arabidopsis . PNAS 100: 10118–10123. [DOI] [PMC free article] [PubMed] [Google Scholar]
- 54. Li Y, Dankher O, Carreira L, Smith A, Meagher R (2006) The shoot-specific expression of γ-glutamylcysteine synthetase directs the long-distance transport of thiol-peptides to roots conferring tolerance to mercury and arsenic. Plant Physiol 141: 288–298. [DOI] [PMC free article] [PubMed] [Google Scholar]
- 55. Wang F, Wang Z, Zhu C (2012) Heteroexpression of the wheat phytochelatin synthase gene (TaPCS1) in rice enhances cadmium sensitivity. Acta Biochim Biophys Sin (Shanghai) 44: 886–893. [DOI] [PubMed] [Google Scholar]
- 56. Noctor G, Strohm M, Jouanin L, Kunert K-J, Foyer CH, et al. (1996) Synthesis of glutathione in leaves of transgenic poplar overexpressing [gamma]-glutamylcysteine synthetase. Plant Physiol 112: 1071–1078. [DOI] [PMC free article] [PubMed] [Google Scholar]
Associated Data
This section collects any data citations, data availability statements, or supplementary materials included in this article.
Supplementary Materials
The plant expression vectors (A) pROK/PaGCS, and (B) p3301/PG. RB and LB: right and left borders of the Ti plasmid; Tnos : nos terminator (260 bp).
(TIF)
Phylogeny of deduced phytochelatin synthase polypeptides.
(TIF)
Transformation of F. arundinacea with PaPCS . (A) Callus induction, (B) Agroinfection, (C) Kanamycin selection of transgenic calli, (D) Regenerated plants, (E) Selected plants maintain their greenness in the presence of kanamycin, (F) Putative transgenic plants grown in soil.
(TIF)
Transformation of F. arundinacea with PaGCS-PaPCS . (A) Callus induction, (B) Agroinfection, (C) Kanamycin selection of transgenic calli, (D) Regenerated plants, (E) Selected plants maintain their greenness in the presence of kanamycin, (F) Putative transgenic plants grown in soil.
(TIF)
PC2 and PC3 content after short term Cd exposure/After 0–120 h, the leaves were sampled for (A) PC2 and (B) PC3. TP-1, TP-2: carriers of PaPCS ; TG-1, TG-2: carriers of PaGCS ; T(GP)-1, T(GP)-2: carriers of PaGCS-PaPCS ; WT: wild type F. arundinacea . Vertical bars indicate the standard error of the mean (n = 4).
(TIF)