Abstract
Determining accurate in-vivo dosimetry in brachytherapy treatment with high dose gradients is challenging. Here we introduce, investigate, and characterize a novel in-vivo dosimeter and readout technique with the potential to address this problem. A cylindrical (4 mm x 20 mm) tissue equivalent radiochromic dosimeter PRESAGE® In-Vivo (PRESAGE®-IV) is investigated. Two readout methods of the radiation induced change in optical density (OD) were investigated: (i) volume-averaged readout by spectrophotometer, and (ii) a line profile readout by 2D projection imaging utilizing a high-resolution (50 micron) telecentric optical system. Method (i) is considered the gold standard when applied to PRESAGE® in optical cuvettes. The feasibility of both methods was evaluated by comparison to standard measurements on PRESAGE® in optical cuvettes via spectrophotometer. An end-to-end feasibility study was performed by a side-by-side comparison with TLDs in an 192Ir HDR delivery. 7 and 8 Gy was delivered to PRESAGE®-IV and TLDs attached to the surface of a vaginal cylinder. Known geometry enabled direct comparison of measured dose with commissioned treatment planning system. A high-resolution readout study under a steep dose gradient region showed 98.9% (5%/1 mm) agreement between PRESAGE®-IV and Gafchromic® EBT2 Film. Spectrometer measurements exhibited a linear dose response between 0–15 Gy with sensitivity of 0.0133 ± 0.0007 ΔOD/(Gy·cm) at the 95% confidence interval. Method (ii) yielded a linear response with sensitivity of 0.0132 ± 0.0006 (ΔOD/Gy), within 2% of method (i). Method (i) has poor spatial resolution due to volume averaging. Method (ii) has higher resolution (~1mm) without loss of sensitivity or increased noise. Both readout methods are shown to be feasible. The end-to-end comparison revealed a 2.5% agreement between PRESAGE®-IV and treatment plan in regions of uniform high dose. PRESAGE®-IV shows promise for in-vivo dose verification, although improved sensitivity would be desirable. Advantages include high-resolution, convenience and fast, low-cost readout.
1. Introduction
The purpose of dose verification in radiotherapy is to assess the dosimetric accuracy of the delivered treatment plan. In gynecological high dose rate 192Ir brachytherapy, this assessment can ideally be made in-vivo to verify and minimize clinically related uncertainties such as target volume definition and contouring, applicator positioning, organ motion, and inter- and intra-fraction applicator movement (Palmer et al 2012). Recent advances in brachytherapy planning software, MRI-compatible applicators, and image-guided brachytherapy have lead to more complex treatments (Williamson 2008) and therefore in vivo dosimetry might be useful, and in particular cases even necessary.
A number of systems for in-vivo dosimetry have been used and are being developed, such as TLDs (Brezovich et al 2000), diamond detectors (Nakano et al 2003), MOSFETs (Reniers et al 2012), and scintillation detectors (Lambert et al 2006). Although TLDs are most commonly used, they have depth dependent sensitivity (Palmer et al 2012) and measure the dose only at a single point (McJury et al 2000). Diamond detectors were found to have dose rate dependence as well as a large rigid structure that prevent them from being inserted in-vivo (Lambert et al 2007). MOSFETs contain uncertainties in angular dependence and are prone to calibration drift (Palmer et al 2012). The ideal in-vivo dose verification method would have the ability to be inserted into cavities without disruption to treatment, ability to provide high resolution dose profiles along steep dose gradients and provide fast acquisition read out time for a high patient load (Guo et al 2006a). PRESAGE® (Heuris Inc., Skillman, NJ) is a radiochromic dosimetry material that has the potential to be a useful dosimeter for in-vivo dose verification.
PRESAGE® is a polyurethane material doped with a radiochromic leuco dye that generates a color change (change in optical density (OD)) when exposed to ionizing radiation (Adamovics and Maryanski 2003). It has the benefits of stability in the clinical setting, linear radiation-induced light absorption contrast rather than scattering contrast, and can be cast into different shapes and sizes without a requirement for an external container (Guo et al 2006b) It has been used across a wide range of clinical applications (Brady et al 2010, Clift et al 2010, Thomas et al 2010, Doran et al 2010, Rankine et al 2013, Zhao et al 2012, Adamson et al 2012, Oldham et al 2012, Wai et al 2009, Palmer et al 2013), but has never been used in-vivo. These qualities, and the need for in-vivo dose verification in brachytherapy, prompted the development of PRESAGE® In-Vivo (PRESAGE®-IV). In this paper we evaluate the utility of PRESAGE®-IV dosimeters in the context of GYN intracavitary HDR 192Ir brachytherapy, and investigate the feasibility of two readout techniques.
2. Methods
PRESAGE®-IV, like prior formulations of PRESAGE®, is a solid radiochromic dosimeter consisting of a polyurethane matrix, leuco dye, and a free radical initiator. PRESAGE®-IV dosimeters are cylindrical plastic dosimeters 4 mm in diameter and 20 mm in length (figure 1). The radiochromic properties of PRESAGE® have been well characterized (Guo et al 2006b, Adamovics and Deitrich 2005, Sakhalkar et al 2009, Juang et al 2013), and the sensitivity (ΔOD/(Gy·cm)), stability, effective atomic number (Zeff), density, and hardness can be changed by varying the formulation of the mixture (Sakhalkar et al 2009, Juang et al 2013). In this study, we used a high sensitivity and low Z formulation (labeled MeO-DEA). Prior characterization studies were performed on much larger volumes of PRESAGE® material than the PRESAGE®-IV dosimeters. Therefore, we include here a basic characterization of PRESAGE®-IV in order to investigate any non-linear volume scaling effects on sensitivity and temporal stability (Juang et al 2013).
Figure 1.
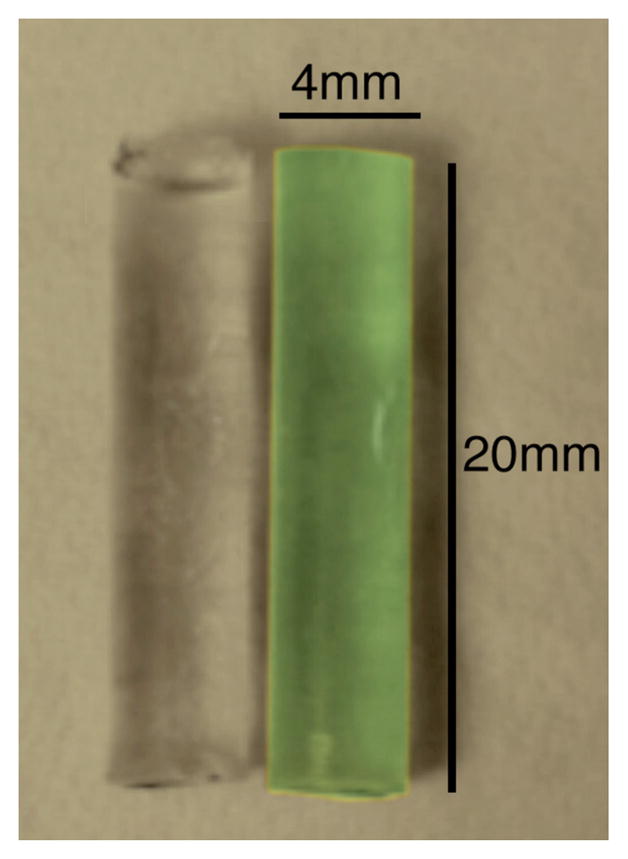
PRESAGE®-IV dosimeters pre-irradiation (left) and post-irradiation 15 Gy (right).
The following subsections describe methods that investigate several aspects of PRESAGE®-IV dosimetry: (2.1) an optimal readout technique and associated sensitivity (2.2) temporal stability and effect of temperature on sensitivity (2.3) end-to-end feasibility study and comparison of PRESAGE®-IV with TLDs and a commissioned planning system and (2.4) High resolution readout study of PRESAGE®-IV and Gafchromic® EBT2 film irradiated simultaneously in a steep dose gradient.
2.1 Optimal Read-Out Technique
Two PRESAGE®-IV readout techniques were investigated: method (i), a volume-averaged readout (~1 cm length of the dosimeter) by conventional spectrophotometer, and method (ii) a line profile readout by a 2D projection imaging method utilizing a high-resolution (up to 50 micron) telecentric optical system. Method (i) has been used extensively and is considered the historical gold standard when applied to PRESAGE® in well-defined optical cuvettes (Guo et al 2006b). To investigate which method was optimal for PRESAGE®-IV, pairs of PRESAGE®-IV 1.5% o-MeO-DEA formulation dosimeters and optical cuvettes were irradiated in a standard calibration set up designed to provide an even dose distribution along the dosimeters and optical cuvettes. The cuvettes were made of polystyrene with a density of 1.046 g/cm3, electron density of 3.387 x 10²³ e/g, wall thickness of 1 mm, and internal dimensions of 1 cm x 1 cm x 4 cm (Guo et al 2006b). Pairs of PRESAGE®-IV dosimeters and optical cuvettes were placed side-by-side and treated with a 10 x 10 cm field at 100 cm SSD and a depth of 5.5 cm between doses of 1–15 Gy. The treatment was delivered using 6 MV photons from a Varian Clinac® 600C/D (Varian Medical Systems) and a dose rate of 600 MU/min. The dosimeters and cuvettes were placed in a 1 cm thick sheet of bolus material, with two 1 cm thick sheets of bolus material below to minimize any air gaps. Solid water blocks were used to ensure full scatter conditions and a 5.5 cm depth to the center of the 4 mm diameter dosimeters and 1 cm thickness cuvettes.
To determine the change in OD in method (i), each dosimeter and optical cuvette is read before and after irradiation. The change in OD was determined using a spectrophotometer (Genesys® 20, ThermoSpectronic®) at the peak absorption wavelength of 633 nm. All readings were normalized to a blank control cuvette. PRESAGE®-IV dosimeters were positioned inside a cuvette filled with mineral oil, in order to minimize refractive effects.
To avoid any temperature dependence effects while measuring OD, cuvettes and dosimeters were taken out of the refrigerator 1–2 hours prior to being scanned each day, and the spectrophotometer was turned on 1 hour before performing the scan to let the light source warm up. A low-lint tissue wiper with ethanol, following a dry tissue wiper was used to remove any residual oil that may appear outside of the cuvette between readings. The spectrophotometer method described above has the potential disadvantage of low spatial resolution due to volume-averaged readout.
To determine the change in OD in method (ii), a 2D projection telecentric optical system was developed in house: the Duke Micro Optical Scanner (DMicrOS). The DMicrOS uses visible light and a CCD camera to take single projection images at 50-micron resolution. The DMicrOS system, a scaled down version of the Duke Large field of view Optical-CT Scanner (DLOS) (Thomas et al 2011), uses a 2W LED light source behind a narrow band filter, giving the source a uniform flood field with wavelength of 633 nm (figure 2). A 79 mm diameter telecentric lens provided a central region of parallel light where the dosimeter can be imaged free of object magnification effects. The imaging lens has a magnification of 0.25X and collimates any light with more than a 0.1-degree deviation from the optical axis, effectively minimizing scattered light contributions. A 1608 x 1208 pixel CCD based Basler camera is used for imaging.
Figure 2.
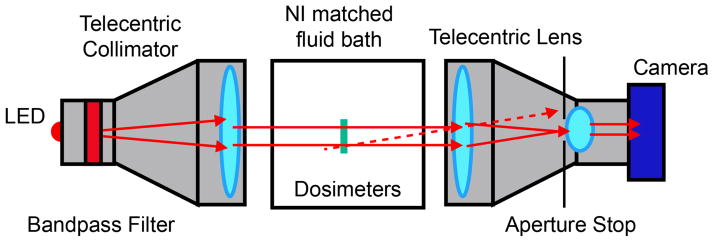
Bird’s eye view of Diagram of the DMicrOS System, which is a scaled down version of the DLOS (Thomas et al 2011). The advantage of telecentric imaging is that the image is formed only from light that travels parallel to the optic axis (tolerance ~0.1 degrees). Stray light (illustrated by the dashed line) is eliminated from the image.
In method (ii), two PRESAGE®-IV dosimeters were imaged simultaneously, positioned by means of a jig as shown in figure 2 in a fluid bath with a matched refractive index to minimize refraction of light. The jig fits onto the tank of the optical system in only one orientation to enable highly accurate repositioning for pre-irradiation and post-irradiation imaging scans.
A single projection image of the dosimeters, a flood, and dark field images were taken, and to reduce noise, each image was averaged 100 times. The OD of the scan was calculated by subtracting out the background (dark) and normalizing by the flood to remove inhomogeneity, as shown in equation 1 below.
| (1) |
A graphical user interface (GUI) was created in MATLAB to allow accurate registration between the pre and post scan images (any minor shifts can be corrected). After registration, a map of the change in OD is determined by subtracting the pre-irradiation OD map from the post-irradiation map. Then line profiles taken along the center of each dosimeter yield the change in OD over approximately the same region (10 mm) and location (3 mm from the bottom of the dosimeter) as that measured in method (i) by spectrophotometer. The mean of the line profile is calculated for each dosimeter and the average of the two dosimeters is taken to get an average OD reading.
The performance of two readout methods ((i) the gold standard spectrophotometer technique and (ii) DMicrOS) was evaluated on PRESAGE®-IV dosimeters that had been irradiated to doses between 1–12 Gy using the treatment set up described above. The dosimeters were read within minutes of each other using both the spectrophotometer and DMicrOS. The methods were evaluated by correlating the readings from both methods.
2.2 Sensitivity, and temporal and temperature stability
The sensitivity of three formulation variants of PRESAGE®-IV are presented (section 3.2) due to different formulations that were used in each investigation. The 1.5% o-MeO-DEA formulation was ultimately chosen for the investigations reported in section 2.1, 2.3, and 2.4 due to high sensitivity and tissue equivalence. The radiochromic response of the dosimeters was tracked post-irradiation to evaluate temporal stability and was also tested for temperature stability at and near body temperature at the time of irradiation. The radiochromic response of the dosimeters was read out using a spectrophotometer and the DMicrOS.
The post-irradiation temporal stability of PRESAGE®-IV 1.7% o-MeO-DEA formulation was determined spectrophotometrically using a standard calibration treatment (section 2.1) delivered to PRESAGE® prepared in 1x1x4 cm3 optical cuvettes. The temporal stability was evaluated by measuring the OD immediately after irradiation, and at regular intervals over 9 days. PRESAGE®-filled optical cuvettes were stored in a refrigerator (3 to 5°C) to improve stability by minimizing kinetic effects that could lead to OD drift.
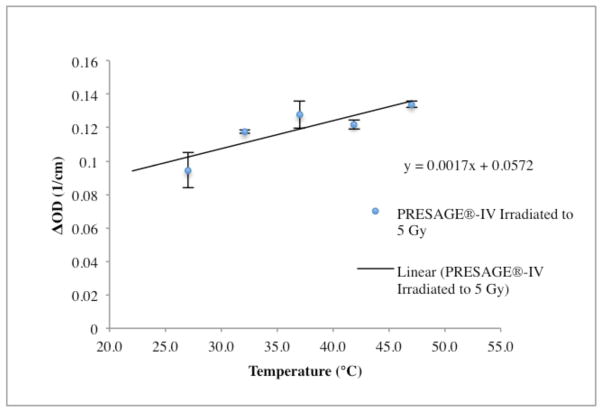
The effect of temperature on sensitivity was determined by irradiating PRESAGE®-IV D21 formulation dosimeters to the same dose of 5 Gy in water at a range of temperatures (27°C, 32°C, 42°C, 47°C). PRESAGE®-IV dosimeters take approximately 20 minutes to reach thermal equilibrium. Two dosimeters were placed side-by-side in a 1 cm thick sheet of bolus material on top of a 5 cm of solid water and treated with a 10 x 10 cm field at 100 cm SSD and a depth of 1.5 cm below the water surface. The treatment delivered 6 MV photons and a dose rate of 600 MU/min using a Varian Clinac® 600C/D (Varian Medical Systems).
2.3 PRESAGE®-IV/TLD end-to-end study
An end-to-end study was performed to directly compare PRESAGE®-IV 1.5% o-MeO-DEA formulation with TLD-100 LiF (3x3x1mm) measurements. The TLDs were calibrated at the University of Wisconsin Accredited Dosimetry Calibration Laboratory (UW-ADCL) UWRMM Service with a 3.6% uncertainty and level of confidence of approximately 95%. Both PRESAGE®-IV and TLDs were simultaneously irradiated in a water tank to doses of 7 and 8 Gy respectively, with a Varian® GammaMed™plus iX 192Ir HDR afterloader. The reference dose was calculated with Eclipse™ Treatment Planning System (Varian Medical Systems) that has been commissioned for clinical use (Rivard et al 2004, Ballester et al 2001, Ballester et al 2004). A prior study has shown that PRESAGE® has no energy dependence and negligible dose-rate dependence with 192Ir (Pierquet M et al 2010).
PRESAGE®-IV dosimeters were wrapped in two layers of Tegaderm™ film dressings, and two Beekley CT-Spots® skin markers 2.3mm and 4mm in diameter were placed on either end of the dosimeter to replicate CT localization in a patient. Three PRESAGE®-IV dosimeters and four TLDs were taped onto a 3.5 cm diameter stump cylinder applicator (figure 3A and B). A CT scan of the applicator was imported into Eclipse for treatment planning.
Figure 3.
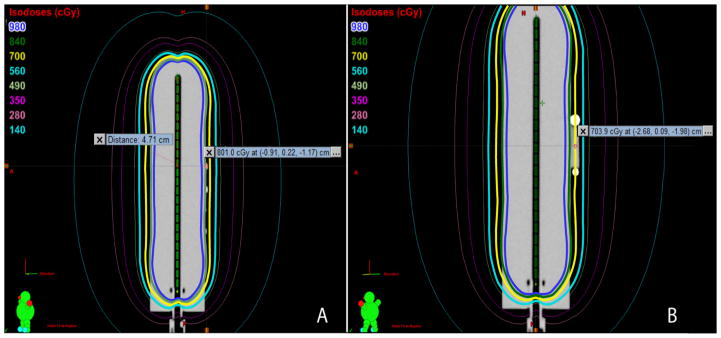
A) Sagittal Cross Section of Applicator and Four TLDs. B) Sagittal Cross Section of Applicator and PRESAGE®-IV dosimeter with Beekley CT- Spots® Localizers.
The applicator was placed in a water bath at room temperature 23°C and a source guide tube was attached to the applicator through the lid of the water bath, securing the applicator position. PRESAGE®-IV dosimeters were irradiated to 7 Gy at the center, and 8 Gy to the center of the TLDs by a 2.607 x 10¹¹ Bq 192Ir source. The PRESAGE®-IV dosimeters were read using both the spectrophotometer and the DMicrOS readout techniques. Conversion to dose was achieved using the calibration curve obtained from cuvettes.
2.4 PRESAGE®-IV/Gafchromic® EBT2 Film High Resolution Readout Study
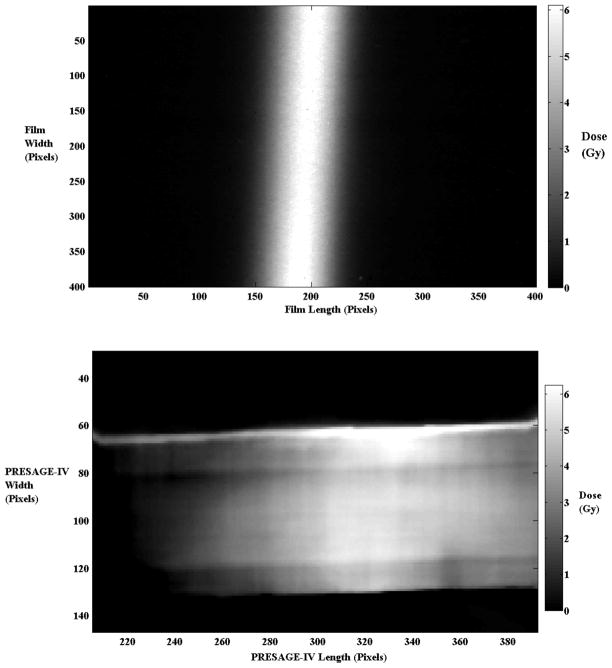
A high-resolution readout study was performed to directly compare the PRESAGE®-IV 1.5% o-MeO-DEA formulation with Gafchromic® EBT2 Film under a steep dose gradient region. A Varian Clinac® 600C/D (Varian Medical Systems) delivered 6 MV photons at a dose rate of 600 MU/min. The film was placed at a 5 cm depth with the PRESAGE®-IV dosimeter placed under the film at a 5.5 cm depth. Both PRESAGE®-IV and film were simultaneously irradiated with a narrow stripe (10 cm x 0.4 cm field size) 2025 MU to approximately 6 Gy across the centers of the dosimeter to generate steep dose gradients.
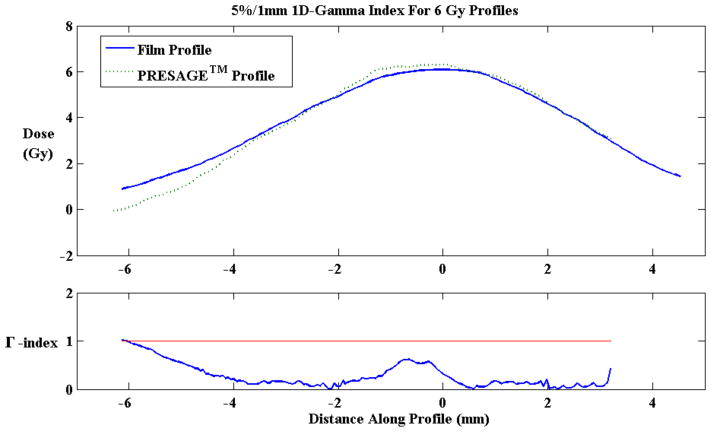
PRESAGE®-IV dosimeters were calibrated between the doses of 0–12 Gy using the method described in section 2.1 and conversion to dose was achieved using the calibration curve obtained from PRESAGE®-IV dosimeters. PRESAGE®-IV dosimeters were read using DMicrOS readout techniques described in section 2.1. Gafchromic® EBT2 Film was calibrated and read using the Gafchromic® User Protocol Guide for IMRT QA (ISP 2009) and conversion to dose was achieved using the calibration curve. A MATLAB program was used to scale the film dimensions from 200 pixels/inch to 18.75 pixels/mm to match the image projections from the DmicrOS reader and to read dose profiles across the film. In addition, MATLAB was also used to perform a 1D Gamma Analysis (5%/1 mm) on the dose profiles in order to find the agreement between PRESAGE®-IV dosimeter and film.
3. Results and Discussion
3.1 Optimal Readout Technique
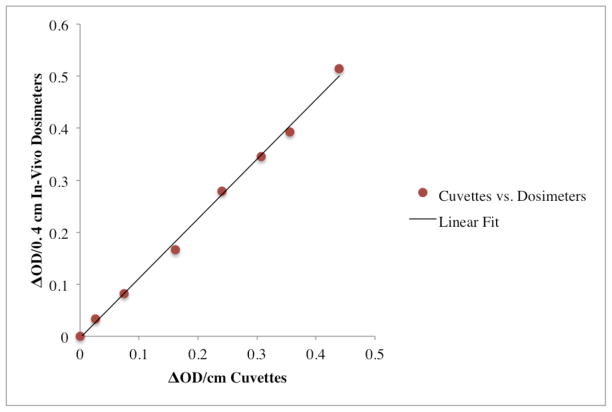
Figure 4 plots the change in OD observed in PRESAGE®-IV 1.5% o-MeO-DEA formulation dosimeters measured in the spectrophotometer against corresponding values from the gold standard method (PRESAGE® in optical cuvettes) irradiated to various doses. Each point on the plot corresponds to PRESAGE® material in two forms (optical cuvettes, or PRESAGE®-IV dosimeters) irradiated to the same dose, and the OD change measured by spectrophotometry. Irradiations at dose levels from 0–12 Gy were used. The linear relationship (slope 1.146 (± 0.047) (ΔOD/(Gy·cm)) indicates a strong feasibility for PRESAGE®-IV dosimetry.
Figure 4.
Feasibility of PRESAGE®-IV dosimetry: Each point on the plot corresponds to PRESAGE® 1.5% o-MeO-DEA formulation material in two forms (in optical cuvettes (ΔOD/cm) and PRESAGE®-IV dosimeters (ΔOD/0.4 cm)) irradiated to the same dose and the change in OD measured by spectrophotometry. The change in optical density of the dosimeters was multiplied by a factor of 1/0.4 cm to account for the difference in path length between the dosimeters and cuvettes.
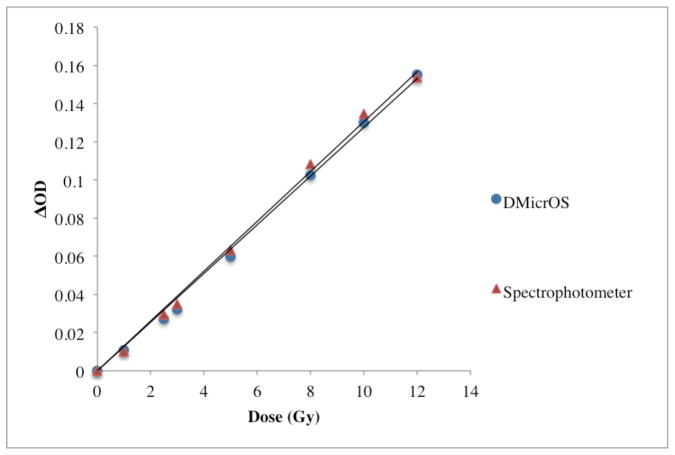
The difference in sensitivity between the DMicrOS and the spectrophotometer readings (the gold standard) for PRESAGE®-IV 1.5% o-MeO-DEA formulation dosimeters irradiated between the doses of 1–12 Gy are reported in figure 5. The sensitivity of the DMicrOS technique was found to be 0.0132 ± 0.0006 (ΔOD/(Gy·cm)) and for the spectrophotometer 0.0133 ± 0.0007 (ΔOD/(Gy·cm)), which is a 0.88% difference in sensitivity in the 95% confidence interval.
Figure 5.
Investigation of PRESAGE®-IV 1.5% o-MeO-DEA formulation read-out sensitivity for DMicrOS and spectrophotometer (the gold standard).
An example of the DMicrOS 2D projection imaging method is shown in figure 6 where after the images are registered, the pre-irradiation image is subtracted from the post-irradiation image to yield a map of the change in OD. Two dosimeters are imaged simultaneously, held in an imaging jig. The positions of the line profiles taken along each dosimeter correspond to the same region measured in the spectrophotometer method.
Figure 6.
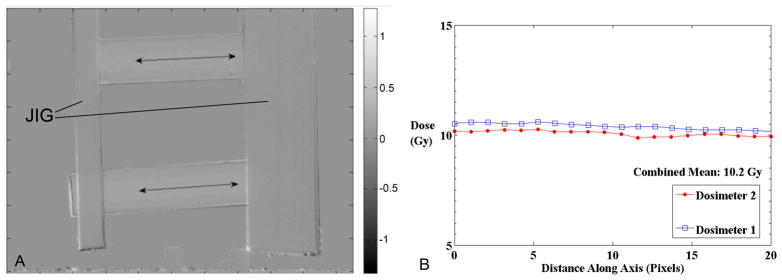
Illustrative Line Profiles through ΔOD maps taken along the center of two Dosimeters irradiated to a uniform dose of 10Gy. (a) ΔOD image acquired from the DMicrOS system of two dosimeters held in the imaging jig. (b) profiles through the upper (dosimeter 1) and lower dosimeter (dosimeter 2), where 1 mm = 18.75 pixels.
3.2 PRESAGE®-IV Sensitivities and Stabilities
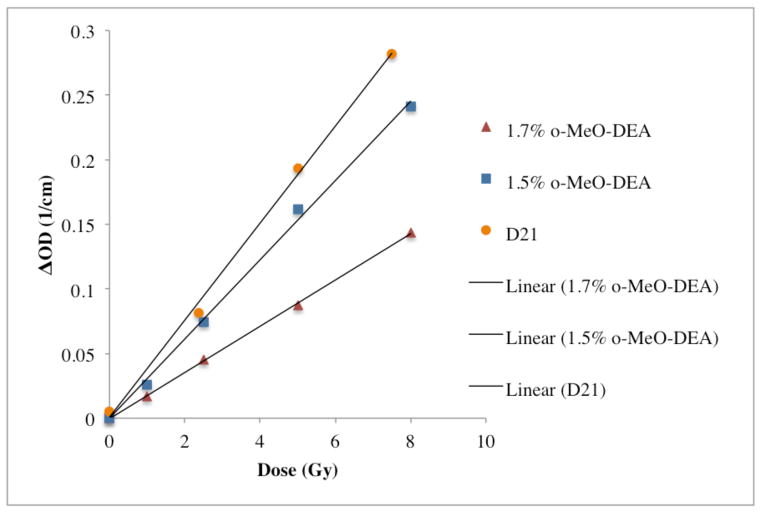
The sensitivity of three formulation variants for PRESAGE®-IV are presented in figure 7. The 1.5% o-MeO-DEA formulation had a sensitivity of 0.0299 ± 0.0005 (ΔOD/(Gy·cm)). When the percentage of leuco dye was increased to 1.7%, the sensitivity decreased to 0.0179 ± 0.0006 (ΔOD/(Gy·cm)). The D21 formulation is a well-studied original formulation developed for high energy (Thomas et al 2011). It had the highest sensitivity of 0.0375 ± 0.001 (ΔOD/(Gy·cm)), although it is less tissue equivalent than the o-MeO-DEA PRESAGE®-IV formulations. All were within the 95% confidence level.
Figure 7.
Sensitivities of three formulations evaluated in this work.
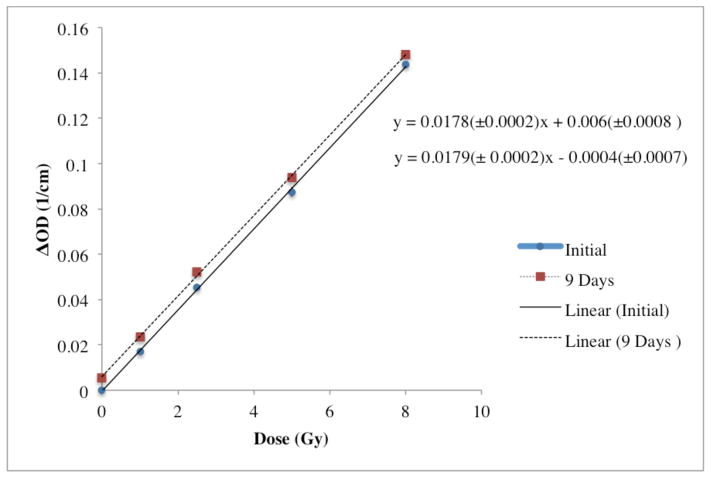
Figure 8 displays the post-irradiation temporal stability of the 1.7% o-MeO-DEA formulation. The post irradiation stability was found to be highly stable over a time period of nine days with a 0.77% change in the slope where the sensitivity had changed from 0.0179 ±0.0002 to 0.0178 ± 0.0002 (ΔOD/(Gy·cm)). The baseline shift has a negligible affect on the dosimetry of this study as measurements were taken immediately after treatment and linearity has been preserved.
Figure 8.
Post-irradiation temporal stability over 9 days of 1.7% o-MeO-DEA formulation.
The change in OD with temperature for the same dose at the time of irradiation for the PRESAGE®-IV D21 formulation is illustrated in figure 9. The temperature at the time of irradiation was found to significantly affect sensitivity. A 30% increase in sensitivity was observed at body temperature 37°C compared to room temperature indicating a temperature dependence that makes the dosimeters more sensitive at higher temperatures.
Figure 9.
PRESAGE®-IV D21 formulation irradiated to 5 Gy shows a temperature dependence between room temperature and body temperature with an increase in change in OD of 30%.
3.3 End-to-end PRESAGE®-IV/TLD study
The results of the direct comparison of PRESAGE®-IV 1.5% o-MeO-DEA formulation and TLD measurements in the same irradiation are shown in table 1. The percent difference between the Eclipse™ dose prediction for PRESAGE®-IV (7 Gy) and PRESAGE®-IV measurement was 0.7% for spectrophotometer readout (method (i)), and 2.5% for the DMicrOS system (method (ii)). The average reading of the four TLDs reported from the calibration laboratory was 7.98 ± 0.036 Gy. The percent difference between the Eclipse™ dose prediction (8 Gy) and the mean TLD measurement was 0.3%. The Eclipse™ dose prediction TLD dose reading at its outer surface was 7.5 Gy, confirming the dose at 1 mm into the PRESAGE®-IV dosimeter within 4.5%.
Table 1.
End-to-end study PRESAGE®-IV methods (i) and (ii) and TLD doses compared to Eclipse™
| Dose (Gy) | Percent Difference | |
|---|---|---|
| Eclipse | 7 | |
| PRESAGE®-IV Method (i) | 7.05 ± 0.11 | 0.7 |
| PRESAGE®-IV Method (ii) | 7.18 ± 0.32 | 2.5 |
| TLD | 7.98 ± 0.04 | 0.3 |
3.4 PRESAGE®-IV/Gafchromic® EBT2 Film High Resolution Readout Study
The high-resolution readout study performed to directly compare the PRESAGE®-IV 1.5% o-MeO-DEA formulation with Gafchromic® EBT2 Film under a steep dose gradient region showed good results. Approximately 6 Gy was delivered in a narrow 4 mm stripe across the centers of PRESAGE®-IV and film. A 1D gamma analysis (5%/1 mm) was performed on the profiles using MATLAB. PRESAGE®-IV had a 98.9% agreement with Gafchromic® EBT2 Film. PRESAGE®-IV reported a maximum dose of 6.23 ± 2.08, which is a difference of less than 4%. Gafchromic® EBT2 Film reported a maximum dose of 6.10 ± 1.68, which is a difference of less than 2%. Figure 10 displays the steep dose gradient delivered onto film and PRESAGE®-IV, and figure 11 displays the profiles along the gradient region of PRESAGE®-IV and film and the 5%/1 mm 1D-gamma index results.
Figure 10.
Gafchromic® EBT2 Film (top) and PRESAGE®-IV (bottom) irradiated to 6 Gy with a 4 mm wide strip beam (18.75 pixels = 1 mm).
Figure 11.
10 mm Line profile along the gradient region of PRESAGE®-IV and Gafchromic®EBT2 Film (top). 1D-Gamma Index showed 98.9% agreement between PRESAGE®-IV and EBT2 Film.
Due to limitations of the scanning set up (section 2.1), the penumbra of the steep dose gradient delivered to PRESAGE®-IV is cut off due to 3 mm of the dosimeter placed into the jig. The larger penumbra of the film is due to the characteristics over-response in the penumbra regions due to increased scatter-to-primary ratio of the lower energy beam.
V. Conclusions
Our investigation demonstrates the feasibility of PRESAGE®-IV dosimeters for in-vivo dosimetry verification using either spectrophotometer or high-resolution DMicrOS readout. The advantages of the approach lie in a cost-effective solution with fast, convenient and high-resolution readout. Good temporal stability of PRESAGE®-IV was observed, with less than 0.8% change in sensitivity over nine days, enabling flexibility in read-out time. However, the temperature at the time of irradiation was found to significantly affect sensitivity (30% increase at body temperature compared to room temperature). This effect can be accounted for in clinical application through careful temperature monitoring and calibration. The PRESAGE®-IV o-MeO-DEA formulations were found to be more stable than those reported in earlier works, and to have lower sensitivity. Further work is needed to characterize the inter-batch repeatability. The conventional spectrophotometer readout method (i) had the limitation of poor spatial resolution due to volume averaging over a 10 mm length of the dosimeter. The DMicrOS (ii) was found to be feasible, and to have the advantage of high resolution (~1 mm), however the sensitivity of the technique is lower than that of either method (i) or EBT film. Clinical feasibility and utility would be enhanced by a more sensitive formulation, which is the subject of ongoing work. The end-to-end comparison in the simple application studied here, showed excellent agreement with TLDs (within 4.5%) and both PRESAGE®-IV and TLDs agreed with the planning system to within 2.5%. The high-resolution readout study performed to directly compare the PRESAGE®-IV 1.5% o-MeO-DEA formulation with Gafchromic® EBT2 Film under a steep dose gradient region showed promising results reporting PRESAGE®-IV within 4% of the actual delivered dose of 6 Gy. 1D-gamma index showed 98.9% agreement between PRESAGE®-IV and Gafchromic® EBT2 Film. Future work will investigate boosting sensitivity and creating smaller dosimeters that can be used in catheters or patient cavities.
Acknowledgments
This work was supported by NIH R01CA100835. We would like to give a special thanks to Leith Rankine for his contribution of the MATLAB 1D gamma analysis program.
References
- Palmer A, Bradley D, Nisbet A. Physics-aspects of dose accuracy in high dose rate (HDR) brachytherapy: source dosimetry, treatment planning, equipment performance and in vivo verification techniques. Journal of Contemporary Brachytherapy. 2012;4:81–91. doi: 10.5114/jcb.2012.29364. [DOI] [PMC free article] [PubMed] [Google Scholar]
- Williamson JF. Current brachytherapy quality assurance guidance: does it meet the challenges of emerging image-guided technologies? International Journal of Radiation Oncology, Biology, Physics. 2008;71:S18–22. doi: 10.1016/j.ijrobp.2007.07.2388. [DOI] [PubMed] [Google Scholar]
- Brezovich I, Duan J, Pareek PN, Fiveash J, Ezekiel M. In vivo urethral dose measurements: a method to verify high dose rate prostate treatments. Medical Physics. 2000;27:2297–301. doi: 10.1118/1.1312811. [DOI] [PubMed] [Google Scholar]
- Nakano T, Suchowerska N, Bilek MM, McKenzie DR, Ng N, Kron T. High dose-rate brachytherapy source localization: positional resolution using a diamond detector. Physics in Medicine and Biology. 2003;48:2133–46. doi: 10.1088/0031-9155/48/14/307. [DOI] [PubMed] [Google Scholar]
- Reniers B, Landry G, Eichner R, Hallil A, Verhaegen F. In vivo dosimetry for gynaecological brachytherapy using a novel position sensitive radiation detector: feasibility study. Medical Physics. 2012;39:1925–35. doi: 10.1118/1.3693049. [DOI] [PubMed] [Google Scholar]
- Lambert J, McKenzie DR, Law S, Elsey J, Suchowerska N. A plastic scintillation dosimeter for high dose rate brachytherapy. Physics in Medicine and Biology. 2006;51:5505–16. doi: 10.1088/0031-9155/51/21/008. [DOI] [PubMed] [Google Scholar]
- Mcjury M, Oldham M, Cosgrove VP, Murphy PS, Doran S, Leach MO, Webb S. Review article Radiation dosimetry using polymer gels3: methods and applications. British Journal of Radiology. 2000;73:919–929. doi: 10.1259/bjr.73.873.11064643. [DOI] [PubMed] [Google Scholar]
- Lambert J, Nakano T, Law S, Elsey J, McKenzie DR, Suchowerska N. In vivo dosimeters for HDR brachytherapy: A comparison of a diamond detector, MOSFET, TLD, and scintillation detector. Medical Physics. 2007;34:1759. doi: 10.1118/1.2727248. [DOI] [PubMed] [Google Scholar]
- Guo P, Adamovics J, Oldham M. A practical three-dimensional dosimetry system for radiation therapy. Medical Physics. 2006a;33:3962–3972. doi: 10.1118/1.2349686. [DOI] [PMC free article] [PubMed] [Google Scholar]
- Adamovics J, Maryanski MJ. New 3D Radiochromic Solid Polymer Dosimeter from Leuco Dyes and a Transparent Polymeric Matrix. Medical Physics. 2003;30:1349–1349. [Google Scholar]
- Guo PY, Adamovics J, Oldham M. Characterization of a new radiochromic three-dimensional dosimeter. Medical Physics. 2006b;33:1338–1345. doi: 10.1118/1.2192888. [DOI] [PMC free article] [PubMed] [Google Scholar]
- Brady SL, Brown WE, Clift CG, Yoo S, Oldham M. Investigation into the feasibility of using PRESAGE/optical-CT dosimetry for the verification of gating treatments. Physics in Medicine and Biology. 2010;55:2187–2201. doi: 10.1088/0031-9155/55/8/005. [DOI] [PMC free article] [PubMed] [Google Scholar]
- Clift C, Thomas A, Adamovics J, Chang Z, Das I, Oldham M. Toward acquiring comprehensive radiosurgery field commissioning data using the PRESAGE® dosimetry system/optical-CT 3D. Physics in Medicine and Biology. 2010;55:1279–1293. doi: 10.1088/0031-9155/55/5/002. [DOI] [PMC free article] [PubMed] [Google Scholar]
- Thomas A, Newton J, Adamovics J, Oldham M. Commissioning and benchmarking a 3D dosimetry system for clinical use. Medical Physics. 2011;38:4846. doi: 10.1118/1.3611042. [DOI] [PMC free article] [PubMed] [Google Scholar]
- Doran SJ, Brochard T, Adamovics J, Krstajic N, Bräuer-Krisch E. An investigation of the potential of optical computed tomography for imaging of synchrotron-generated x-rays at high spatial resolution. Phys Med Biol. 2010 Mar;55:1531–47. doi: 10.1088/0031-9155/55/5/018. [DOI] [PubMed] [Google Scholar]
- Rankine LJ, Newton J, Bache ST, Das SK, Adamovics J, Kirsch DG, Oldham M. Investigating end-to-end accuracy of image guided radiation treatment delivery using a micro-irradiator. Phys Med Biol. 2013;58:7791–801. doi: 10.1088/0031-9155/58/21/7791. [DOI] [PMC free article] [PubMed] [Google Scholar]
- Zhao L, Newton J, Oldham M, Das IJ, Cheng CW, Adamovics J. Feasibility of using PRESAGE® for relative 3D dosimetry of small proton fields. Phys Med Biol. 2012;57:N431–43. doi: 10.1088/0031-9155/57/22/N431. [DOI] [PMC free article] [PubMed] [Google Scholar]
- Adamson J, Newton J, Yang Y, Steffey B, Cai J, Adamovics J, Oldham M, Chino J, Craciunescu O. Commissioning a CT-compatible LDR tandem and ovoid applicator using Monte Carlo calculation and 3D dosimetry. Med Phys. 2012;39:4515–23. doi: 10.1118/1.4730501. [DOI] [PMC free article] [PubMed] [Google Scholar]
- Oldham M, et al. A quality assurance method that utilizes 3D dosimetry and facilitates clinical interpretation. Int J Rad Onc, Bio, Phys. 2012;84:540–546. doi: 10.1016/j.ijrobp.2011.12.015. [DOI] [PMC free article] [PubMed] [Google Scholar]
- Wai P, et al. Dosimetry of the microSelectron-HDR Ir-192 source using PRESAGE and optical CT. Appl Radiat Isot. 2009;67:419–22. doi: 10.1016/j.apradiso.2008.06.038. [DOI] [PubMed] [Google Scholar]
- Adamovics J, Dietrich J. Enhanced Performance of PRESAGE - Sensitivity, and Post- Irradiation Stability. Medical Physics. 2005;32:1. [Google Scholar]
- Sakhalkar HS, Adamovics J, Ibbott G, Oldham M. A comprehensive evaluation of the PRESAGE/optical-CT 3D dosimetry system. Medical Physics. 2009;36:71–82. doi: 10.1118/1.3005609. [DOI] [PMC free article] [PubMed] [Google Scholar]
- Juang T, Newton J, Niebanck M, Benning R, Adamovics J, Oldham M. Customising PRESAGE for diverse applications. Journal of Physics: Conference Series. 2013:444. doi: 10.1088/1742-6596/444/1/012029. [DOI] [PMC free article] [PubMed] [Google Scholar]
- Palmer AL, Di Pietro P, Alobaidli S, Issa F, Doran S, Bradley D, Nisbet A. Comparison of methods for the measurement of radiation dose distributions in high dose rate (HDR) brachytherapy: Ge-doped optical fiber, EBT3 Gafchromic film, and PRESAGE® radiochromic plastic. Medical Physics. 2013;40:061707. doi: 10.1118/1.4805100. [DOI] [PubMed] [Google Scholar]
- Rivard MJ, et al. Update of AAPM Task Group No. 43 Report: A revised AAPM protocol for brachytherapy dose calculations. Medical Physics. 2004;31:633–674. doi: 10.1118/1.1646040. [DOI] [PubMed] [Google Scholar]
- Ballester F, et al. Technical note: Monte-Carlo dosimetry of the HDR 12i and Plus 192Ir sources. Medical Physics. 2001;28:2586–2591. doi: 10.1118/1.1420398. [DOI] [PubMed] [Google Scholar]
- Ballester F, et al. Erratum: “Technical note: Monte-Carlo dosimetry of the HDR 12i and Plus 192Ir sources” [Med. Phys. 28, 2586–2591 (2001)] Medical Physics. 2004;31:2372. doi: 10.1118/1.1420398. [DOI] [PubMed] [Google Scholar]
- ISP International Specialty Products. Gafchromic User Protocol Guide for IMRT QA. 2009 Available from: < http://www.ashland.com/Ashland/Static/Documents/ASI/Advanced%20Materials/ebt2-user-protocol.pdf>.
- Pierquet M, et al. On the Feasibility of Verification of 3D Dosimetry Near Brachytherapy Sources Using PRESAGE/Optical-CT. Journal of Physics: Conference Series. 2010:250. doi: 10.1088/1742-6596/250/1/012091. [DOI] [PMC free article] [PubMed] [Google Scholar]


