

Abstract
Autism spectrum disorder (ASD) is a heterogeneous disease where efforts to define subtypes behaviorally have met with limited success. Hypothesizing that genetically based subtype identification may prove more productive, we resequenced the ASD-associated gene CHD8 in 3,730 children with developmental delay or ASD. We identified a total of 15 independent mutations; no truncating events were identified in 8,792 controls, including 2,289 unaffected siblings. In addition to a high likelihood of an ASD diagnosis among patients bearing CHD8 mutations, characteristics enriched in this group included macrocephaly, distinct faces, and gastrointestinal complaints. chd8 disruption in zebrafish recapitulates features of the human phenotype, including increased head size as a result of expansion of the forebrain/midbrain and impairment of gastrointestinal motility due to a reduction in post-mitotic enteric neurons. Our findings indicate that CHD8 disruptions define a distinct ASD subtype and reveal unexpected comorbidities between brain development and enteric innervation.
Keywords: Autism spectrum disorder, autism subtypes, dysmorphology, macrocephaly, gastrointestinal defect, zebrafish modeling, enteric neurons, forebrain/midbrain expansion
INTRODUCTION
Autism spectrum disorder (ASD) is a heterogeneous disorder with significant genotypic and phenotypic complexity (Geschwind, 2009). While various behaviorally defined subtypes have been proposed (American Psychiatric Association, 2000; Wing and Gould, 1979), these have not been tied to genetic etiology, linked to treatment indicators, nor been diagnosed consistently by expert clinicians (Lord et al., 2012). Indeed, with the transition to the DSM-5, all behaviorally defined subtypes have been subsumed by the umbrella term Autism Spectrum Disorder, allowing for identification of subtypes more closely aligned to biological mechanisms (American Psychiatric Association, 2013). The genetic etiology of ASD is no less varied. Over 100 genes and genomic regions have been associated with ASD (Betancur, 2011), and over 800 genes have been suggested to play a role in ASD (Iossifov et al., 2012; Neale et al., 2012; O’Roak et al., 2012b; Sanders et al., 2012). Given that parsing the behavioral heterogeneity has yielded limited utility, genetically defined subtypes may prove more beneficial in illuminating molecular mechanisms underlying ASD, the course and prognosis of a subgroup of individuals with ASD, and individualized treatment targets.
Severe disruptive mutations in chromodomain helicase DNA binding protein 8 (CHD8) have been associated with ASD and provide a likely candidate for a specific subtype of ASD (O’Roak et al., 2012b; Talkowski et al., 2012; Neale et al., 2012). CHD8, located on 14q11.2, binds to beta-catenin in its function in chromatin remodeling (Thompson et al., 2008) and as a potential regulator of Wnt signaling (Nishiyama et al., 2012). CHD8 has been associated with rare cases in childhood disorders; two sporadic truncating mutations in autism patients were identified by (O’Roak et al., 2012b) from exome sequencing of 209 proband-parent trios from the Simons Simplex Collection (SSC; Fischbach and Lord, 2010). Concurrently, examination of balanced chromosomal abnormalities in individuals with neurodevelopmental disorders reported a novel disruption to CHD8 in an individual with ASD (Talkowski et al., 2012). Based on these findings, Neale and colleagues performed a case-control analysis and found an excess of disruptive mutations in ASD exomes (three cases) (Neale et al., 2012). Subsequent targeted sequencing using molecular inversion probes (MIPs) in 2,446 individuals from the SSC identified eight individuals with recurrent truncating mutations within CHD8, with six of the eight individuals showing evidence of macrocephaly (O’Roak et al., 2012b). Multiple converging reports, thus, suggest that mutation of CHD8 is an important risk factor of ASD. The goal of this study was to determine if CHD8 mutations define a specific subtype of ASD through the discovery of additional patients, extensive phenotype-genotype correlations, and modeling truncating mutations during zebrafish development.
RESULTS
Patient and Mutation Discovery
Previously, we identified nine de novo mutations in 2,446 probands from the SSC; this included eight putative loss-of-function mutations and one in-frame amino-acid deletion (Table 1). To expand the patient collection and determine the specificity of the phenotype for autism, we targeted a cohort of patients with more broadly defined developmental delay phenotypes. Using MIPs, we resequenced CHD8 in 3,730 additional children with ASD or developmental delay and validated eight additional potentially disruptive mutations (Table 1, Figure 1); including three frameshift, one stop-gain, one amino acid deletion, and three missense-near splice sites. We first compared our findings of 13 truncating mutations in 6,176 cases to a well-characterized control cohort of 2,289 unaffected siblings from the SSC; we sequenced CHD8 among the unaffected siblings and found no putative disruptive mutations. This confers a nominally significant case-control p-value of p = 0.0167 (Fisher’s exact test). To expand our analysis, we incorporated an additional 6,503 general population controls from the Exome Sequencing Project (http://evs.gs.washington.edu/EVS/). Although not screened specifically for neuropsychiatric conditions, we again observed no additional truncating events in CHD8. Taking these two control populations together, we refined our estimate of significance for CHD8 truncation to p = 1.01 × 10⁻⁵ (Fisher’s exact test, odds ratio is infinite, with a 95% C.I. from 4.34 to infinity) (Table S1).
Table 1.
Summary of CHD8 mutations (from 5′ to 3′).
| Proband | Sex | Mutationb | HGVSc | Diagnosisd | Inheritance |
|---|---|---|---|---|---|
| 12714.p1a | M | Ns | p.Ser62X | ASD | de novo |
| 13986.p1a | M | Fs | p.Tyr747X | ASD | de novo |
| Nij023486 | F | Fs | p.Val984X | ID/ASD | inherited - maternal |
| APP_109580-100 | M | Ns | p.Glu1114X | ASD | de novo |
| 11654.p1a | F | Sp | c.3519-2A>G | ASD | de novo |
| 13844.p1a | M | Ns | p.Gln1238X | ASD | de novo |
| 14016.p1a | M | Ns | p.Arg1337X | ASD | de novo |
| Troina2659 | M | Fs | p.Glu1932SerfsX3 | DD/ID/ASD | de novo |
| 12991.p1a | M | Fs | p.Glu2103ArgfsX3 | ASD | de novo |
| 12752.p1a | F | Fs | p.Leu2120ProfsX13 | ASD | de novo |
| Troina2037 | F | Fs | p.Glu2136ArgfsX6 | ID | de novo |
| Nij010878 | M | Aa | p.Lys2287del | ID/ADHD | unknown |
| 14233.p1a | M | Fs | p.Asn2371LysfsX2 | ASD | de novo |
| 14406.p1a | M | Aa | p.His2498del | ASD | de novo |
| Gecz4801 | M | Mns | p.Arg910Gln | ID? | unknown |
| Leuven_445853 | M | Mns | p.Gly1710Val | ASD | inherited - maternal |
| Nij07-06646 | M | Mns | p.Arg1797Gln | ASD | inherited - paternal |
| T102.03 | F | CNV-dup | ASD | inherited - paternal | |
| 9883540 | CNV-dup | DD, Dysmorphic Features | unknown | ||
| 9873678 | CNV-dup | Mild ID | unknown |
Patient mutation was previously reported (O’Roak et al., 2012b).
Ns = nonsense; Fs = frameshift; Sp = splice; Aa = single amino acid deletion; Mns = missense-near-splice; CNV = copy number variant; dup = duplication.
HGVS = Human Genome Variant Sequence.
ASD = autism spectrum disorder; DD = developmental delay; ID = intellectual disability; ADHD = attention deficit hyperactivity disorder.
Figure 1. Spectrum of CHD8 mutations in autism spectrum disorder.
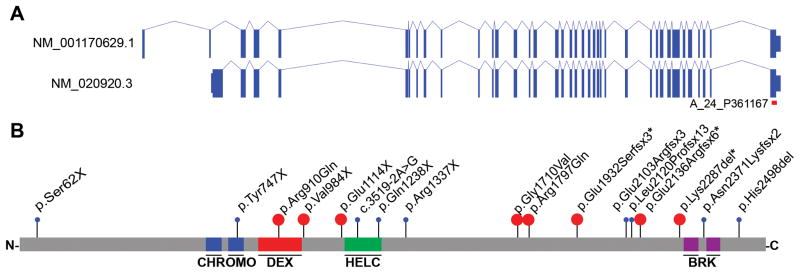
A) Gene isoforms 1 & 2 and B) protein models of CHD8 with proband putative disruptive mutations indicated. The location of the gene expression array probe used for Figure 3 (A_24_P361167) is shown in Figure 1A in red. Events in blue were reported previously (Neale et al., 2012; O’Roak et al., 2012a). Events in red are novel. *=diagnosis of intellectual disability (Table 1). See also Table S1 & S2; Figure S1.
The majority of truncating mutations (nonsense, frameshift, and canonical splice site) for which inheritance could be determined were de novo (11 of 12 (92%) with cascade screening; Figure 1, Table 1). Complementary to our case-control analysis, we applied a probabilistic model derived from human-chimpanzee fixed difference and sequence context, as described in (O’Roak et al., 2012a) , to calculate the null probability of the CHD8 truncating variation. Under a de novo rate of 1.2 nonsynonymous coding variants per individual, we estimate the probability of detecting 11 or more CHD8 de novo truncating events in 6,176 cases as p = 9.4 ×10⁻²³ (binomial test). This is significant in that this probability exceeds even a strict exome-wide significance cutoff of 2.5 ×10⁻⁶ assuming we had screened all 20,000 genes. Two missense-near splice sites and a 5 kbp copy number duplication in the carboxy terminus of the gene were found to be inherited (Figure S1, Table 1).
No copy number variants (CNVs) were observed across this locus in 19,584 population controls. Four variants were detected near canonical splice sites of CHD8 (three missense: Nij07-06646, Leuven445853, and Gecz4801 and one intronic: 11654.p1). Using Alamut 2.3 (Interactive Biosoftware), we assessed the likely impact of each mutation on splicing (Houdayer, 2011). One variant (11654.p1) disrupts the intronic canonical splice acceptor signal and likely disrupts splicing (Figure S2, Table S2). Three additional variants were located in the exonic sequence and represent missense-near splice variation. One of these (Nij07-06646) affects the last base of the exon and is predicted to abrogate significantly the local splice site (Figure S2, Table S2), while the other two (Leuven445853 and Gecz4801) are located two bases in from the splice junction and are not predicted to be disruptive (Figure S2, Table S2). In this regard, the two cases predicted to have the most severe canonical splice site disruptions exhibit the characteristic features associated with CHD8 putative disruptive mutations, while the two variants that do not likely disrupt splicing were inherited (Table 2, Table S5). The less severe event from Leuven445853 is milder in its presentation. We also found that milder mutations were more likely to be inherited from unaffected parents. Cascade testing showed that the only inherited severe mutation (Nij07-06646) was transmitted from a father who demonstrated similar behavioral challenges related to autism, had a large head circumference, and experienced recurrent sleeping and gastrointestinal (GI) difficulties.
Table 2.
Brief description of phenotypic presentation of 15 patients with CHD8 truncating SNVs.
| Patient | 12714.p1 | 13986.p1 | Nij023486 | APP_109580-100 | 11654.p1 | 13844.p1 | 14016.p1 | Troina2659 | 12991.p1 | 12752.p1 | Troina2037 | Nij-010878 | 14233.p1 | 14406.p1 | Nij07-06646 | Observed N (% of Sample) |
| Sex | M | M | F | M | F | M | M | M | M | F | F | M | M | M | M | |
| Age at Testing (years) | 4 | 5 | 15 | 6 | 12 | 8 | 8 | 13 | 16 | 4 | 41 | 11 | 16 | 13 | 17 | |
| Macrocephaly | − | + | + | + | + | + | + | + | + | + | + | − | + | − | + | 12 (80%) |
| Prominent Supraorbital Ridge | u | u | + | − | + | u | + | + | + | u | + | − | u | u | + | 7 (47%) |
| Hypertelorism | u | u | + | + | + | u | + | − | + | u | + | − | u | u | − | 6 (40%) |
| Down Slanted Palpebral Fissures | u | u | + | − | + | u | + | + | − | u | + | − | u | u | + | 6 (40%) |
| Flat Feet | u | u | − | − | − | u | − | − | + | u | − | − | u | u | + | 2 (13%) |
| Tall | + | + | + | + | + | + | + | + | − | u | − | + | + | + | + | 12 (80%) |
| Overweight | − | − | − | − | − | − | − | − | u | + | + | − | + | − | 3 (20%) | |
| ASD | + | + | + | + | + | + | + | + | + | + | − | − | + | + | + | 13 (87%) |
| Intellectual Disability | − | + | + | + | + | + | − | + | + | − | + | − | + | − | − | 9 (60%) |
| Attentional Problems | − | − | + | + | + | − | − | − | + | + | + | + | + | + | − | 9 (60%) |
| Anxiety Problems | + | − | − | − | − | − | + | − | + | + | − | − | − | − | − | 4 (27%) |
| Seizures | − | − | − | − | + | − | + | − | + | − | − | − | − | − | − | 3 (20%) |
| Regression | + | − | + | + | + | + | − | + | − | − | − | − | + | − | − | 7 (47%) |
| GI Problems | + | − | + | + | + | + | + | + | + | + | + | − | + | − | + | 12 (80%) |
| Sleep Problems | − | + | + | + | + | − | + | − | + | + | − | − | + | + | + | 10 (67%) |
| C-Section | − | − | − | − | + | − | − | + | + | + | − | − | − | − | + | 5 (33%) |
| Birth Induction/Augmentation | + | + | − | − | + | − | + | − | + | − | − | − | − | + | − | 6 (40%) |
KEY: + = present; − = absent; u = unknown. NOTE: Detailed phenotypic data is outlined for each patient in the above domains in Table S5.
Clinical Phenotype
We recontacted eight CHD8 patients and their families for structured clinical assessment, review of medical records, and dysmorphological evaluation (Figure 2). This included three families from the SSC (O’Roak et al., 2012b) as well as five newly discovered patients identified by MIP screening of patients with ASD and developmental delay. We integrated these findings and generated clinical reports for all available families, yielding a phenotypic description of 15 patients from individuals with potentially disruptive mutations (Table 2, Table S5).
Figure 2. Physical characteristics of the CHD8 phenotype.

A) Facial phenotype associated with CHD8. Patients 11654.p1 (top left), 14016.p1 (top middle), and Nij023486 (top right) present with macrocephaly, hypertelorism, down slanted palpebral fissures, broad nose, pointed chin, and broad forehead with prominent supraorbital ridge. Patient 12991.p1 (bottom left) has a high forehead, hypertelorism, large ears, fleshy earlobes, and a history of macrocephaly (at 12 years of age). Patient Troina2659 (bottom middle) did not have hypertelorism but did present with macrocephaly, down slanted palpebral fissures, prominent supraorbital ridge, and pointed chin. Additional physical features included posterior plagiocephaly. Patient Troina2037 (bottom right) presented with macrocephaly, hypertelorism, down slanted palpebral fissures, prominent supraorbital ridges, large ears with fleshy upturned lobes, and full fleshy lips. Additional physical features included widened cranial vault observed via CT scan.
B) Longitudinal head circumference in CHD8 patients. Analysis of standardized head circumference values for patients 14016.p1 (in red) and APP_109580-100 (in blue) reveal marked early orbital frontal head growth in the first two months post birth followed by consistent large head growth remaining at or above 97th percentile throughout early childhood.
ASD was the most common diagnosis observed in our cohort. Of the 15 identified individuals evaluated, 13 meet strict diagnostic criteria for ASD; one is an adult suspected of having a psychotic disorder; and one is diagnosed with ADHD and borderline intellectual functioning. Of the nine children who underwent a formal, standardized ASD evaluation using gold standard diagnostic instruments, all met criteria for autistic disorder on both the ADOS and ADI. ASD severity, as measured with the Calibrated Severity Scale (Gotham et al., 2009), fell within the diagnostic realm (mean CSS = 6.8, SD = 1.3), underscoring the confidence of the diagnosis. Even among patients referred only for developmental delay, follow-up showed that most had ASD or ASD symptoms (Table 1). Altogether, at least 87% and possibly 93% have a diagnosis of ASD, providing evidence that disruptive mutations to CHD8 are heavily enriched and possibly specific to ASD.
Although patients varied in age from 4–41 years of age, we observed striking similarities in their facial characteristics (Figure 2A). Predominant features included increased occipitofrontal circumference (OFC), pronounced supraorbital brow ridges, wide-set eyes with down slanted palpebral fissures, broad nose with full nasal tip, and pointed chin. Other recurrent physical features included slender, tall build and large, flat feet, which have been reported in several individuals (Table S5). 80% of the cases have macrocephaly (OFC z > 2.0) either at the time of testing or earlier in development. The observed rate of macrocephaly in this case series cohort is significantly greater (Fisher’s exact test, p = 2.1 × 10⁻⁸) than that observed in children with ASD from the SSC without CHD8 mutations (360/2,564 or 14%). The use of reference samples has generated discussions regarding the utility of these data for establishing individual OFC standard scores (Chaste et al., 2013). Certain factors are important to consider when determining the relative head size of individuals. In this case series, larger head size in comparison to individuals with ASD in the SSC without CHD8 mutations appears independent of height, age, and mean parental head circumference, F(1, 2639) = 4.79, p = 0.029, Cohen’s d = 3.10 (large effect size based on estimated marginal means).
We obtained head circumference velocity data for two patients (Figure 2B). The trajectories are characterized by marked early orbital frontal head growth in the first two months post birth, followed by consistent large head growth remaining at or above the 97th percentile throughout early childhood, thereby underscoring the penetrance of this aspect of the CHD8 phenotype. Potentially related, certain patterns emerged in this case series regarding the birth and delivery process. Induction and augmentation of labor is noted in six patients (40%) and C-sections were common, with five (33%) reported C-section births.
12 patients (80%) reported significant GI problems, with 60% reporting specific difficulties characterized as recurrent and consistent problems with constipation. Caregivers often reported long periods of GI disturbance characterized by periods of considerable constipation followed by loose stool or diarrhea. The rate of parent-reported constipation in this case series is significantly greater (Fisher’s exact test, p = 0.006) relative to parent reports of constipation in children with ASD without CHD8 mutations from the SSC. Parents of 693 of 2,630 children without CHD8 mutations in the SSC reported problems with constipation (26%) as compared to the 60% rate observed in this cohort.
Sleep problems were reported frequently. Ten patients (67%) reported some type of sleep problem, with seven (44%) presenting specifically with difficulties in falling asleep. Two patients reported sleep challenges so profound that the children would remain awake for days without sleeping. However, this rate is not yet greater than ASD children without CHD8 mutations (60%; Fisher’s exact test, p = 0.75) and there is some evidence that this aspect ameliorates with age. Another recurrent finding is cognitive impairment. Cognitive ability of the cohort ranges from profoundly disabled to age appropriate; however, none of the patients demonstrate an above-average IQ. Nine patients have a comorbid diagnosis of intellectual disability with each of those children showing impairment in both cognitive and adaptive abilities. Additionally, two of the children manifest cognitive performance in the borderline intellectual functioning range.
CHD8 Expression during Development
Due to its potentially important role during brain development, we determined the spatiotemporal expression profile of CHD8 based on available microarray and RNAseq data (Shen et al., 2012). The gene is expressed widely in the adult and developing human and macaque brains (as well as mouse) throughout both cortical and subcortical structures, including the neocortex, hippocampus, amygdala, and striatum (Figure S3A, Figure S4A–B). Expression is highest in the early prenatal period (9–16 post-conception weeks (pcw)) and decreases during human (Figure 3A) and macaque (Figure S4A) fetal and postnatal development. CHD8 is also expressed widely across progenitor and post-mitotic layers in mid-fetal human (15–21 pcw) neocortex, with possible enrichment in the intermediate zone at 15 and 16 pcw (Figure 3B), but not at 21 pcw (not shown). This pattern is in contrast to the known CHD8 binding partner CHD7 (Figure 3A), which is expressed primarily in neural progenitor cell layers (ventricular and subventricular zones; Figure 3C). There is no clear laminar enrichment of CHD8 in developing macaque cortex (Figure S4B).
Figure 3. Normal expression of CHD8.

A) Reads per kilobase per million normalized expression values of CHD8 (red) and CHD7 (black) in dorsolateral prefrontal cortex (DFC, left) and posteroventral (inferior) parietal cortex (IPC, right) over a range from 8 post-conception weeks (pcw) to 104 weeks (2 years) of age taken from normal post-autopsy individuals. Highlighted in gray is expression in the fetal brain prior to birth.
B–C) Heatmap showing localized expression of CHD8 (B) or CHD7 (C) at 15 pcw (left) and 16 pcw (right) in the intermediate zone (IZ). Red indicates increased expression and white indicates no expression. Cortical samples are organized in columns by lobe (f=frontal; p=parietal; t=temporal; o=occipital) and in rows by layer from basal to apical surfaces of the developing neocortex (SG=suprageniculate nucleus of the thalamus; MZ=marginal zone; CPo=outer cortical plate; CPi=inner cortical plate; SP=subplate zone; SZo=outer subventricular zone; SZi=inner subventricular zone; VZ=ventricular zone). Within lobes, samples are approximately ordered from rostral to caudal. a1=primary auditory cortex; dl=dorsolateral prefrontal cortex; dm-f=dorsomedial frontal cortex; dm-o=dorsomedial extrastriate cortex; dm-p=dorsomedial parietal cortex (area 7m); fp=frontal polar cortex; il=inferolateral temporal cortex; lt=lateral temporal-occipital cortex; m1=posterior frontal cortex (motor cortex); mi-t=midinferior temporal cortex; ml=midlateral extrastriate cortex; mt=medial temporal-occipital cortex; or=orbital frontal cortex; pd=posterosuperior (dorsal) parietal cortex; ph=posterior parahippocampal cortex; pv=posteroinferior (ventral) parietal cortex; s1=primary somatosensory cortex; sl=superolateral temporal cortex; t36=(rostral) midinferior temporal cortex (area 36); tf=caudal midinferior temporal cortex (area TF); tp=temporal polar cortex; v1=primary visual cortex; vl=ventrolateral prefrontal cortex; vm=ventromedial extrastriate cortex.
D) CHD8 is co-expressed with nine genes carrying truncated mutations in ASD probands (n=133, red, left panel) and one gene carrying disruptive mutations in unaffected siblings and controls (n=58, blue, right panel) (Gulsuner et al., 2013; Rauch et al., 2012) with Pearson correlation r>0.9 (black dashed lines). For comparison, 100,000 random sets of genes of the same size (n=133, left; n=58, right) were sampled. The histogram shows the number of genes from each such random set that are co-expressed with CHD8. CHD8 is found to co-express with a significantly higher number of genes reported as sites for de novo truncated mutations in ASD probands (p<1×10⁻⁵) in contrast to unaffected siblings and controls, which was not significant (p=0.37). See also Figures S2 & S3, Tables S3 & S4.
We searched for genes with similar temporal patterns of co-expression during human brain development using RNAseq data obtained from the BrainSpan Atlas (http://www.brainspan.org/). We identified 172 genes with significant co-expression (r > 0.9; Figure S3B), of which nine (SETD2, MLL5, ADNP, POGZ, ARID1B, PHF2, DYRK1A, SUV420H1, MBD5) have been reported previously as sites of de novo truncating mutations among ASD probands (Iossifov et al., 2012; Neale et al., 2012; O’Roak et al., 2012a; O’Roak et al., 2012b; Sanders et al., 2012) (Table S3). The strongest correlation (r = 0.96) for CHD8 was in fact a histone methyl transferase, SETD2, implicated in epigenetic transcriptional activation and chromatin modulation (Simon et al., 2014). Overall, we find a significant enrichment of autism candidate genes among the CHD8 co-expressed set (p = 1.02 × 10⁻⁶, OR = 9.7, 95% C.I. = 4.3–19.5 for genes r > 0.9). This enrichment becomes more pronounced as the correlation threshold is increased (p = 1.78 × 10⁻⁵, OR = 83.6, 95% C.I. = 13.4–394.9 at r > 0.95; Figure S3C, Figure 3D).
To identify genes co-expressed with CHD8 specifically in the tissues that appear to be enriched for spatiotemporal expression of CHD8 (Figure 3B), we performed a tissue-specific co-expression analysis. First, CHD8 expression was assessed by microarray (Affymetrix probe A_24_P361167; Figure 1A) in each layer of mid-fetal human (15–21 pcw) neocortex. A total of 282 genes were at least moderately correlated (r > 0.5) with CHD8 expression across all cortical layers. Amongst them, a total of 144 of 282 genes were also highly correlated (r > 0.85) with CHD8 neocortical expression over time, from the early prenatal period through adulthood. These 144 genes showing elevated prenatal and widespread mid-fetal laminar expression were associated significantly with chromatin modification and transcription regulation as assessed by gene ontology enrichment (not shown). Some of the most significantly correlated temporal genes (r > 0.9; p < 1 × 10⁻¹⁶; Table S4) include NAV1, MLL, ARID1A, RPRD2, and ZNF462 (Figure S3D). Of these genes, both NAV1 and MLL have been identified as sites of mutation in ASD probands (Jiang et al., 2013; O’Roak et al., 2012b) (Figure S3B, Table S3).
Zebrafish Modeling
We similarly assessed the pattern of expression of chd8 during zebrafish development. We designed four antisense probes of ~1.5 kbp each along the length of the gene and assessed expression by in situ hybridization. We found that chd8 mRNA is maternally deposited into the zygote and expressed ubiquitously until early somitogenesis (Figure 4A). chd8 mRNA began to show enrichment in the brain and spinal cord at one day post-fertilization (dpf) and then became progressively restricted to the head and gut regions later during embryonic development at 3–4 dpf. Since the CHD8 protein is highly conserved between zebrafish and human (Figure S4A), we utilized zebrafish as a model system to suppress endogenous chd8 and asked whether this alters the development of the brain and recapitulates some aspects of the human phenotype.
Figure 4. chd8 disruption results in ectopic expression of forebrain/midbrain markers during zebrafish development.

In situ hybridization is shown for multiple markers before and after injection of chd8-MO1-4.
A) In situ hybridization of 2-cell, 5-somite, 1-, 3- and 4-day stage zebrafish embryos using a 1.5 kbp chd8 antisense probe. chd8 is ubiquitously expressed in early stages; however, after day 1, its expression is enriched in the head region and the GI duct.
B) Two sets of morpholinos are independently designed to target two exon/intron junctions of chd8. To validate the morpholino effects, total mRNA was extracted at 24 hours post-fertilization (hpf) followed by reverse transcription and PCR using primers flanking the targeted junctions. MO1 or MO2 injection leads to inclusion of the adjacent intron to mature mRNA. Red arrows indicate the PCR products of morpholino-modified chd8 transcripts. Uninjected AB strain embryos were used as control for all experiments in Figure 4. Data are represented as mean +/− SEM.
C) The distance between the convex tips of the eyes were measured. MO1, MO2, MO3, and MO4 injection caused enlargement of this distance and the results were quantified in the right panel.
D) Embryos were immunostained to highlight the neuronal axon tract in the developing brains. Embryos are imaged in dorsal view and the optic tecta structure is indicated (red oval). The average distance between the optic tecta is measured and quantified (n=50). Injection of chd8-MO1, MO2, MO3, and MO4 showed an enlargement of the distance consistent with interorbital distance measurements. Data are represented as mean +/− SEM.
E) Expression of chordin (marker of the dorsal organizing region) at shield stage, animal pole view and dorsal oriented towards right. Chordin expression is expanded upon injection of chd8 morpholinos and the overall staining intensity is quantified in panel E.
F) Orthodenticle homeobox 2 (otx2), an early marker of midbrain and forebrain neuronal progenitors. Expression of otx2 at tail bud stage, lateral view and dorsal oriented towards the right. Otx2 expression is enhanced upon injection of chd8 morpholinos and the overall staining intensity is quantified in panel F.
G) Distal-less homeobox 2 (dlx2), a marker of neural stem cells. Expression of dlx2 at 24-hour stage, lateral view. Arrows point at the telencephalon (tel) region and arrowhead points at the prethalamus (pt) region. dlx2 expression in the prethalamus but not telencephalon region is enhanced upon injection of chd8 morpholinos as shown in panel H (pt) and G (tel), respectively.
H) Paired-box 2.1 (pax2.1), a marker of the midbrain/hindbrain boundary (MHB). Expression of pax2.1 at 24-hour stage, lateral view. Arrow points at MHB. The area of the head that contains the forebrain and midbrain is outlined by dashed red lines. The forebrain/midbrain region is enlarged upon injection of chd8 morpholinos, which is quantified in panel I.
I–M) Quantification of significant in situ hybridization results. n.s.=not significant; **p<0.001; ***p<0.0001. Data are represented as mean +/− SEM. See also Figures S4, S5 & S6.
First, we generated two splice-blocking morpholinos (MO1 and MO2) targeting two exon-intron junctions of the zebrafish ortholog of chd8 (Figure 4B). RT-PCR and Sanger sequencing confirmed that the morpholino design reduces normal splicing by more than 80%, leading to the inclusion of an intron adjacent to two different exons and a concomitant disruption of the Chd8 protein at aa604 and aa643 (Figure 4B). To examine the consequence of chd8 disruption in head development, we first measured the distance between the convex tips of the eyes (interorbital distance) at ~4.3 dpf as a surrogate measurement for head size (Golzio et al., 2012). Injection of 4 ng of MO1 or MO2 leads to a significant increase in the mean value of the eye distances of 50 morphants (p < 0.0001), suggesting an overgrowth of the head (Figure 4C). Importantly, this phenotype was not accompanied by gross developmental abnormalities; MO-injected embryos developed their swim bladder appropriately (data not shown); and we did not identify significant changes in body length (Figure S4B) or length between somites (Figure S4C) compared to controls.
To determine whether larger head size was accompanied by increased brain volume in chd8 morphants, we performed immunostaining with anti-acetylated tubulin (used to label axonal tracts) on MO1- and MO2-injected embryos, which showed a significant increase in the mean distance between optic tecta compared to controls (p < 0.0001; Figure 4D). These observations were further supported by marker analysis using in situ hybridization of wild-type, MO1- or MO2-injected embryos. At the shield stage, chd8 morphants exhibited expansion of the dorsal organizer marked by chordin, suggesting that disruption of chd8 promotes dorsal (neuronal) development (Figure 4E&I). At the tail bud stage, expression of otx2, an early marker of midbrain/forebrain neuronal progenitors, was upregulated in chd8 morphants, consistent with its role in neuronal development (Figure 4F&J). At 24 hours post-fertilization (hpf), we observed a significant increase of dlx2 staining in the prethalamus but not the telencephalon (Figure 4G, K&L). In addition, we measured the size of the head region that contains the forebrain and midbrain marked by pax2.1 staining and observed an enlargement of the forebrain/midbrain region (Figure 4H&M). In contrast, we did not observe significant changes to the markers of the telencephalon/eye (pax6) and hindbrain (krox20) (Figure S6).
Although macrocephaly is not a typical side effect of MO toxicity, we wanted to probe further the specificity of our results. The large size of the full-length CHD8 mRNA rendered it intractable to adequate in vitro transcription to perform rescue experiments, and we therefore carried out a series of additional experiments. First, we determined that the head size defect was dose dependent (Figure S4D). We designed two additional non-overlapping splice-blocking MOs (MO3, MO4) that disrupted the splice donor site of exons 7 and 8, respectively, as determined by RT-PCR (Figure 4B, Figure S4E). Injection with either MO reproduced the macrocephalic phenotype (Figure 4C&D). As a final test of specificity of the phenotype, we induced microdeletions in exon 2 of chd8 by the clustered regularly interspaced short palindromic repeats (CRISPR)/Cas9 system (Hwang et al., 2013; Jao et al., 2013) (Figure S5A) and validated the presence of genetic editing in 50% of the injected embryos (founders, F0) by T7 endonuclease I assay (Figure S5B) and by single molecule, real-time (SMRT) DNA sequencing (Figure S5C). We designed guide mRNAs against both chd8 and the gene tyr (encoding tyrosinase), mutations which induce loss of pigmentation (Jao et al., 2013). Injections of guide RNAs and in vitro transcribed, capped, polyadenylated nls-zCas9-nls RNA into one-cell stage embryos, performed in duplicate by two investigators, followed by phenotyping at 5 dpf blind to injection cocktail not only produced mosaic hypopigmentation phenotypes in 70% and 80% of the embryos in the two clutches respectively, but also reproduced the head size defect seen with all four chd8 MOs (p < 0.0001); objective measurement of interorbital distance in 70 CRISPR/Cas9-injected embryos and 32 sham-injected controls showed a mean increase of 17% in each clutch (Figure S5D&E). We note that we cannot determine how many cells carried Cas-9 induced chd8 small insertions-deletions (indels) in each embryo nor whether the mutated cells were homozygous or heterozygous. However, we have not observed any homozygous CHD8 mutations in human patients, which is consistent with the embryonic lethality observed in mouse knockout models of Chd8 (Nishiyama et al., 2012). More importantly, the consistency of the phenotype of the injected animals with the humans carrying CHD8 mutations and with the morpholino knockdowns, and the lack of such phenotypes in our controls (the guide RNA that did not yield chd8 mutations and the tyr mutants) supports the interpretation that loss of function of CHD8 causes macrocephaly. These data are consistent with the macrocephaly and hypertelorism symptoms observed in patients, providing further evidence that CHD8 plays a conserved role in regulating brain growth during development in both humans and zebrafish.
Because of the frequent GI complaints reported in patients with disruptive CHD8 mutations, we also examined possible effects of chd8 disruption during hindgut development. To test whether suppression of chd8 affects GI motility, we performed an established microgavage assay (Cocchiaro and Rawls, 2013). We gavaged sham-, chd8 MO3-, and MO4-injected larvae (n = 25) by injecting fluorescent microspheres into the intestinal anterior bulb and tracking the movement of the microspheres at different time points post-gavage. We evaluated GI motility by defining four transit zones along the GI tract (Field et al., 2009) and scoring the more rostral location of the microspheres in live larvae at three and six hours post-gavage (Figure 5A). Scoring blind to injection cocktail, we observed a significant delay of progression of the microspheres along the GI tract in both chd8 morphants (MO3 and MO4) compared to sham-injected embryos at three hours post-gavage (Figure 5B). Strikingly, whereas sham-injected embryos had no appreciable beads in zone 2 three hours post-gavage, 5/19 and 9/21 embryos injected with MO3 and MO4, respectively, had microspheres in zone 2 (p = 6.3 × 10⁻⁴ and p = 1.1 × 10⁻⁵ for chd8-MO3 and chd8-MO4, respectively; Figure 5B). The decrease of motility was still prominent after six hours; while 26/27 sham-injected embryos had no microsphere in zones 2–4, 9/19 and 13/21 MO-injected embryos had microspheres in zones 2–4 (p = 0.00854 and p = 2.4×10⁻⁶ for chd8-MO3 and chd8-MO4, respectively; Figure 5B).
Figure 5. Analysis of GI motility by microgavage assay.

A) Example of intestinal transit within one larva over time. Intestinal zones are indicated in the top image (zones 1–4). Images below show fluorescent signal in the different intestinal zones outlined by white solid lines.
B) The most rostral location of microspheres was used to determine the transit zone scores. Bars represent the total number of larvae containing microspheres in each zone, and numbers at the top of each graph indicate the time elapsed after gavage (hours post-injection, hpi). Numbers of larvae injected and scored are as follow: 27 sham-injected, 19 chd8-MO3-injected, and 22 chd8-MO4-injected. The microgavage experiment was repeated three times. Fisher’s exact test was performed; associated p-values are shown in the corresponding tables.
C) Injection of chd8-MO leads to a reduced number of enteric neurons in the GI tract at 6 days post-fertilization (dpf). Representative photographs (with HuC/D-antibody staining) show the lateral views of a sham-injected zebrafish larva (control) and a zebrafish larva injected with chd8 MO. Higher magnification of the GI tract, displayed in the insets, shows a reduced number of enteric neurons (labeled by anti-HuC/D antibody) in larvae injected with chd8 MOs compared to controls.
D) Bar graph represents the percentage of larvae (controls and injected with chd8-MO3 and -MO4) with reduced number of enteric neurons at 6 dpf. Corresponding p-values are denoted on the bar graph (Pearson’s chi-squared test).
E) Increasing the dosage of MO1-2 injection from 8 to12 ng and MO3-4 from 8 to10 ng resulted in a significant decrease in enteric neurons in the gut at 6 dpf measured by HuC/D positive cells. n.s.=not significant; *p<0.05; **p<0.001; ***p<0.0001 (Student’s t-test). Data are represented as mean +/− SEM. See also Figure S4 & S5.
GI motility is controlled by enteric neurons—neural crest-derived cells that form the enteric nervous system and undergo extensive migration from the caudal hindbrain to colonize the entire GI tract (Ciment and Weston, 1983). To investigate the cause of motility defects observed in the chd8 morphants, we tested whether the disruption of chd8 might affect the neuronal colonization of the GI tract. We stained embryos injected with MO3 or MO4 with an anti-HuC/D monoclonal antibody, a marker for post-mitotic neurons; previous studies showed that enteric neurons are positive for both HuC and HuD (also known as ELAVL3 and ELAVL4; D’Autreaux et al., 2007). Masked qualitative scoring of MO-injected embryos at 6 dpf (60 larvae per condition, repeated three times and scored blind by two investigators) showed that 40% to 60% of embryos had a reduced number of HuC/D+ cells compared to controls (p < 0.0001; Figure 5C&D). Further, we performed a quantitative scoring by counting the number of enteric neurons that colonized the hindgut in a subset of morphants and controls (20 larvae per condition); we observed a mean of 144 HuC/D+ cells in the morphants compared to a mean of 278 in controls (p = 0.0026), indicating an average of 50% reduction of the number of enteric neurons present in the hindgut in chd8 morphants compared to controls. Similar to our observations for head size, this phenotype could be both exacerbated in an MO dose-dependent manner and reproduced by MO1 and MO2 (Figure 5E), providing evidence of specificity. Finally, staining of our CRISPR-chd8 embryos (scored live for head size and pigmentation defects), showed a significant reduction of enteric neurons (p < 0.0002; Figure S5F&G). Taken together, our data suggest that GI problems (constipation episodes followed by loose stool) in our patients with CHD8 truncating mutations are likely due, at least in part, to a reduced colonization of the GI tract by enteric neurons, which is expected to result in compromised motility.
DISCUSSION
Our findings suggest that CHD8 disruptions represent a specific pathway in the development of ASD and define a distinct ASD subtype. Common phenotypic features included increased head size accompanied by rapid, early postnatal growth; a facial phenotype marked by prominent forehead, wide-set eyes, and pointed chin; as well as increased rates of GI complaints and marked sleep dysfunction. Of these, the facial features, macrocephaly, and GI complaints (constipation) appear most significant when compared to other ASD patients without CHD8 mutations. This association between macrocephaly and ASD is not the first to be reported in genetically defined subgroups. Mutations in PTEN are associated with severe macrocephaly and ASD (Butler et al., 2005), as is the 16p11.2 deletion CNV, modeled subsequently in zebrafish embryos with dosage changes in KCTD13 (Golzio et al., 2012). We propose that this constellation of symptoms is particular to this genetically defined subtype of ASD irrespective of differences in the genetic background. The specificity of the ASD diagnosis is also noteworthy in light of the fact that our screen of more broadly defined developmental delay patients recovered four patients of which three could be subsequently clinically classified with ASD. Most truncating mutations are de novo and associated with ASD with no truncating mutations observed in 8,792 controls. These findings are consistent with CHD8 mutations associating strongly with autism (OR = Inf, 95% C.I. = 4.35-Inf). Other events strongly associated with ASD, such as CNVs at 16p11.2 (Weiss et al., 2008), when ascertained more broadly (e.g., Simons VIP Consortium, 2012), reveal significant variability in clinical phenotype.
This study represents a realization of the genotype-first approach applied to ASD (Hennekam and Biesecker, 2012; Schulze and McMahon, 2004; Stessman et al., 2014). Although it required targeted resequencing of 6,176 patients with autism and developmental delay to recover 15 patients with severe truncating mutations, the clinical re-contact and detailed characterization of this small subset was critical. Recognition of these specific, but otherwise subtle, phenotypes would have been obscured in an ASD clinic, where patients with diverse genetic and non-genetic etiologies present. Patients linked by a common genetic etiology may provide a superior classifier in distinguishing subtypes of the disease. It is also possible that a larger cohort of CHD8 patients studied longitudinally will reveal additional features. We note, for example, that one of the female patients presented with precocious puberty, macrocephaly, and intellectual disability mirroring the phenotype of a translocation patient described earlier (Talkowski et al., 2012). Similarly, we note that both of our patients over the age of 40 developed tumors. In particular, the father of patient Nij07-06646 died from complications of metastases of a rectum carcinoma diagnosed at age 42. CHD8 has been shown to play a role in the cell cycle of gastric cancer and has been associated with 10 different gastric/colorectal cancers (Kim et al., 2011). Reduced CHD8 expression observed in cancer tissues relative to healthy tissues from samples of 101 patients with gastric cancer and additional disruption of CHD8 expression resulted in increased proliferation of cancer cell lines suggesting the loss of CHD8 expression may be a novel indicator for gastric cancer (Sawada et al., 2013). This suggests that it may be important to study the CHD8 ASD cohort longitudinally for early signs of colorectal cancer.
Several lines of evidence indicate that disruption of CHD8 leads to defects in normal neuronal development. In multiple species, the developing brain shows the highest level of expression before birth. In humans, post-mitotic layers of the neocortex show peak expression during mid-fetal development (15–16 pcw). At 21 pcw, a more significant increase in expression is observed for the ventricular and subventricular zone layers, which include a large proportion of neuronal precursors. Morphant chd8 zebrafish recapitulate the macrocephaly phenotype (10–15% enlargement) and a GI motility defect reminiscent of the gut motility defects found in patients. Importantly, these phenotypes were not accompanied by an overall advance or delay in chd8 morphant embryonic development suggesting specificity. Marker analyses of early embryonic neuronal development indicated the head overgrowth is mostly driven by forebrain/midbrain expansion, which is likely due to over-proliferation of neuronal progenitors of these regions. It is noteworthy that in the forebrain region dlx2 expression is enhanced in the prethalamus but not in the telencephalon in chd8 morphants, suggesting the overgrowth phenotype is highly tissue specific. Antibody staining indicates a reduction of enteric neurons in these morphants, suggesting a defect in either proliferation or colonization of the neural plexus during development. These findings are consistent with CHD8’s role as a master transcriptional regulator associated with cell proliferation and its relationship to other neurodevelopmental disorders, such as CHARGE syndrome (Vissers et al., 2004). CHARGE is an autosomal dominant syndrome marked by coloboma, heart defects, atresia of the choanae, retarded growth and development, genital hypoplasia, ear anomalies, and deafness (Hittner et al., 1979; Pagon et al., 1981). CHD8 has been implicated previously in CHARGE syndrome, through binding with CHD7, mutations to which are the major cause of CHARGE (Batsukh et al., 2010).
Finally, reproduction of the present paradigm for other genes associated with ASD, with particular emphasis on comorbidities, might represent not only an opportunity to stratify ASD into discrete clinical entities that can guide both diagnosis and management but can also inform the genotypic stratification of future clinical trials and provide non-behavioral endpoints to test therapeutic efficacy.
METHODS
Cohorts
DNA samples for cases with a diagnosis of ASD/developmental delay were obtained from six centers (Table S1). Post-MIP processing of 3,730 cases passed sequencing QC and were included in the analysis these—include 876 cases (2 cohorts) with a diagnosis of ASD and 2,854 cases (4 cohorts) with a general diagnosis of developmental delay/intellectual disability. In addition, we sequenced 2,289 siblings from the SSC as a control population.
MIPs and Sequence Analysis
Blood samples were collected and genomic DNA was isolated as part of participation in previous genetic studies of ASD (SSC (Fischbach and Lord, 2010)) or developmental delay/intellectual disability. MIPs were designed as described in (O’Roak et al., 2012a). In total, 105 overlapping probes covering the coding sequence and splice junctions were included in the assay as part of a larger set of probes (O’Roak et al., 2012a). MIP Illumina HiSeq-based sequencing and analysis were performed as previously described (O’Roak et al., 2012a). Samples were included in analysis if ≥90 of 105 CHD8 probes demonstrated read depth over 20. All MIP screening was performed on probands and putative disruptive variants in CHD8 were validated by Sanger sequencing. Post validation, parental DNA were acquired and screened by Sanger sequencing for inheritance. Inspection of splice site variants was performed using Alamut (Interactive Biosoftware), which incorporates five common splice prediction algorithms (SpliceSiteFinder-like, MaxEntScan, GeneSplicer, NNSPLICE, and Human Splicing Finder). For each splice site we calculated the percent difference between the wild-type and variant sequence scores and averaged the results across the five algorithms.
Patient Assessment
Patients were initially identified through exome and targeted sequencing in anonymized ASD or developmental delay cohorts. Approval to initiate re-contact of these identified patients for comprehensive phenotypic workup was obtained through the institutional review boards (IRBs) for each of the patient cohorts. The study team contacted the patient coordinators involved in the original studies to indicate which patients should be re-contacted. The patient coordinators then decoded the sample IDs and re-contacted families for comprehensive phenotypic workup. This included obtaining informed consent, coordinating travel to the clinical site, standardized examination of the neurocognitive and physical phenotype, and comprehensive medical records review (IRB protocol HSD#42744).
Array Comparative Genomic Hybridization (CGH)
To confirm rare CNVs in CHD8, we utilized a custom Agilent 8 × 60K CGH array with 150 bp probe spacing across the gene body of CHD8 and predicted neighboring regulatory elements. In addition, large genomic CNVs were identified using a previously described Agilent 2 × 400K array (Girirajan et al., 2013).
Expression Analyses
The spatiotemporal pattern of expression of CHD8 for human, macaque and mouse was assessed using RNAseq and microarray data available from the Allen Institute for Brain Science (http://www.brainmap.org/). Genes were assessed for correlated expression using RNAseq data for all brain tissues available from the BrainSpan Atlas (http://www.brainspan.org/). These data provide high spatial and temporal resolution of genome-wide transcriptional changes in the human brain from 8 pcw through adulthood. Positive correlations in gene expression were assessed at various thresholds (Pearson correlation) and significance with respect to autism was established using a two-tailed Fisher’s exact test.
Zebrafish Morpholino, in situ Hybridization, Immunostaining, and Embryo Manipulations
Zebrafish (Danio rerio) embryos were raised and maintained as previously described (Westerfield, 1995) and the AB strain was used as wild-type for this study. Whole-mount in situ hybridization was performed as previously described (Thisse et al., 1993) and NBT/BCIP (Roche) was used as the chromogenic substrate. For chd8 expression, digoxigenin-labeled RNA antisense probes were generated from ~1.5 kbp segments of chd8 cloned into PCR4-TOPO vector (Invitrogen). To quantify staining, we used ImageJ. We first cycled the stained area with the “freehand selection” tool and measured the overall intensity using the “Measure” function. We then moved the shape to an unstained area to measure the background intensity. Finally, we subtracted the background intensity to get the actual staining intensity. We measured 25 stained embryos for each marker to obtain the average value.
Anti-sense morpholino oligonucleotides (GeneTools) were injected into 1–2 cell stage embryos. Two sets of morpholinos against chd8 were designed separately. MO1/MO3 target the splice donor site of exon 7 and MO2/MO4 target the splice donor site of exon 8. Morpholino sequence: chd8-MO1, 5′-AATGGAATCATAACTTACTTGAGCT-3′; chd8-MO2, 5′-ATGTGCAAGCAAGTAACACCTGTGA-3′; splice-blocking MOs against chd8: (chd8-MO3, 5′-GAGAATGGAATCATAACTTA CTTGA-3′ and chd8-MO4, 5′-GCAAATGTGCAAGCAAGTAACACCT-3′. The two sets of overlapping morpholinos were designed independently by two different groups. Suppression of endogenous message was shown by PCR amplification of cDNA reverse transcribed from extracted total mRNA. To measure the interorbital distance, images of the embryo heads were taken around 4.3 dpf and then analyzed using ImageJ; 50 embryos were measured for each genotype. Measurements of distance between five consecutive chevrons as a read-out for body length was performed at 5 dpf as described (Golzio et al, 2012).
Whole-mount immunostaining with the anti-acetylated tubulin (T7451, Sigma) or anti-HuC/D (A-21271, Life Technologies) was performed to examine the axon tract in the brain or enteric neurons along the GI tracts, respectively. Embryos were fixed in Dent’s fixative (80% methanol, 20% dimethylsulphoxide (DMSO)) overnight. After rehydration with decreasing series of methanol in PBS, the embryos were washed with PBS, permeabilized with 10 μg/ml proteinase K, and post-fixed with 4% PFA. Embryos were then washed twice with IF buffer (0.1% Tween-20, 1% BSA in 1x PBS) for 10 min at room temperature. After incubation in blocking solution (10% FBS, 1% BSA in 1x PBS) for 1 hr at room temperature, embryos were incubated with the anti-acetylated tubulin (1:500) or anti-HuC/D antibody (1:500) in blocking solution overnight at 4°C. After two washes in IF buffer for 10 min each, embryos were incubated in the secondary antibody solution, 1:1,000 Alexa Fluor rabbit anti-mouse IgG (A11001, Life Technologies), in blocking solution for 1 hr at room temperature. For acetylated tubulin staining, embryos were stained 4.3 dpf. The distance between the optic tecta was quantified using ImageJ. For HuC/D staining, injected embryos were stained at 6 dpf and classified into two groups, normal and affected, based on the absence or presence of enteric neurons compared with an age-matched control group from the same clutch. Number of HuC/D positive cells in the gut at 6dpf was then quantified using ITCN (Image-based Tool for Counting Nuclei) plugin in ImageJ. All the experiments were repeated three times.
Microgavage of Zebrafish Larvae
Sham-injected and chd8 MO-injected zebrafish larvae were gavaged at 6 dpf with a suspension of 0.25% fluorescent microspheres/1x PBS/0.05% phenol red as described previously (Field et al., 2009). Microsphere transit through the intestine was followed by live stereomicroscopy at 3 and 6 hours post-gavage. Larvae were scored based on the location of the microspheres in intestinal zones (1–4) at the time points post-gavage. The gavage experiment was repeated three times.
Supplementary Material
Acknowledgments
This work was supported by the Simons Foundation Autism Research Initiative (SFARI 303241) and NIH/NIMH R01MH101221 to E.E.E.; by SFARI 239983 and NIH P50MH094268 to N.K.; by a NARSAD Young Investigator Grant from BBRF to C.G.; and by the European Commission: GENCODYS grant 241995 under FP7 and the Dutch Organisation for Health Research and Development (ZON-MW grants 917-86-319 and 912-12-109) to B.d.V. E.E.E. is an Investigator of the Howard Hughes Medical Institute and is on the scientific advisory board for DNAnexus, Inc. N.K. is a Distinguished Brumley Professor. We thank all the families at the participating Simons Simplex Collection (SSC) sites, as well as the principal investigators (A Beaudet, R Bernier, J Constantino, E Cook, E Fombonne, D Geschwind, E Hanson, D Grice, A Klin, R Kochel, D Ledbetter, C Lord, C Martin, D Martin, R Maxim, J Miles, O Ousley, K Pelphrey, B Peterson, J Piggot, C Saulnier, M State, W Stone, J Sutcliffe, C Walsh, Z Warren, and E Wijsman). We are grateful to D. Raible and H. S. Zimmermann for providing zebrafish resources and helpful discussions, to T. Brown for help with manuscript preparation, and to J. Huddleston and M. Malig for sequencing support.
Footnotes
Author contributions
R.B. conducted initial clinical recontact. C.G. and B.X. performed zebrafish experiments. H.S. performed gene expression analysis. B.C. performed genotyping experiments. These authors contributed equally to the manuscript. N.K. and E.E.E. supervised all genotyping and zebrafish experiments. All authors discussed the results and commented on the manuscript at all stages.
References
- American Psychiatric Association. Diagnostic and Statistical Manual of Mental Disorders. 4. Washington, DC: American Psychiatric Association; 2000. Text Revision (DSM-IV-TR) [Google Scholar]
- American Psychiatric Association. Diagnostic and Statistical Manual of Mental Disorders. 5. Washington, DC: American Psychiatric Association; 2013. (DSM-5) [Google Scholar]
- Batsukh T, Pieper L, Koszucka AM, von Velsen N, Hoyer-Fender S, Elbracht M, Bergman JE, Hoefsloot LH, Pauli S. CHD8 interacts with CHD7, a protein which is mutated in CHARGE syndrome. Hum Mol Genet. 2010;19:2858–2866. doi: 10.1093/hmg/ddq189. [DOI] [PubMed] [Google Scholar]
- Betancur C. Etiological heterogeneity in autism spectrum disorders: more than 100 genetic and genomic disorders and still counting. Brain research. 2011;1380:42–77. doi: 10.1016/j.brainres.2010.11.078. [DOI] [PubMed] [Google Scholar]
- Butler MG, Dasouki MJ, Zhou XP, Talebizadeh Z, Brown M, Takahashi TN, Miles JH, Wang CH, Stratton R, Pilarski R, et al. Subset of individuals with autism spectrum disorders and extreme macrocephaly associated with germline PTEN tumour suppressor gene mutations. J Med Genet. 2005;42:318–321. doi: 10.1136/jmg.2004.024646. [DOI] [PMC free article] [PubMed] [Google Scholar]
- Chaste P, Klei L, Sanders SJ, Murtha MT, Hus V, Lowe JK, Willsey AJ, Moreno-De-Luca D, Yu TW, Fombonne E, et al. Adjusting head circumference for covariates in autism: clinical correlates of a highly heritable continuous trait. Biol Psychiatry. 2013;74:576–584. doi: 10.1016/j.biopsych.2013.04.018. [DOI] [PMC free article] [PubMed] [Google Scholar]
- Ciment G, Weston JA. Enteric neurogenesis by neural crest-derived branchial arch mesenchymal cells. Nature. 1983;305:424–427. doi: 10.1038/305424a0. [DOI] [PubMed] [Google Scholar]
- Cocchiaro JL, Rawls JF. Microgavage of zebrafish larvae. J Vis Exp. 2013:e4434. doi: 10.3791/4434. [DOI] [PMC free article] [PubMed] [Google Scholar]
- D’Autréaux F, Morikawa Y, Cserjesi P, Gershon MD. Hand2 is necessary for terminal differentiation of enteric neurons from crest-derived precursors but not for their migration into the gut or for formation of glia. Development. 2007;134:2237–2249. doi: 10.1242/dev.003814. [DOI] [PubMed] [Google Scholar]
- Field HA, Kelley KA, Martell L, Goldstein AM, Serluca FC. Analysis of gastrointestinal physiology using a novel intestinal transit assay in zebrafish. Neurogastroenterology and motility: the official journal of the European Gastrointestinal Motility Society. 2009;21:304–312. doi: 10.1111/j.1365-2982.2008.01234.x. [DOI] [PubMed] [Google Scholar]
- Fischbach GD, Lord C. The Simons Simplex Collection: a resource for identification of autism genetic risk factors. Neuron. 2010;68:192–195. doi: 10.1016/j.neuron.2010.10.006. [DOI] [PubMed] [Google Scholar]
- Geschwind DH. Advances in autism. Annu Rev Med. 2009;60:367–380. doi: 10.1146/annurev.med.60.053107.121225. [DOI] [PMC free article] [PubMed] [Google Scholar]
- Girirajan S, Dennis MY, Baker C, Malig M, Coe BP, Campbell CD, Mark K, Vu TH, Alkan C, Cheng Z, et al. Refinement and discovery of new hotspots of copy-number variation associated with autism spectrum disorder. Am J Hum Genet. 2013;92:221–237. doi: 10.1016/j.ajhg.2012.12.016. [DOI] [PMC free article] [PubMed] [Google Scholar]
- Golzio C, Willer J, Talkowski ME, Oh EC, Taniguchi Y, Jacquemont S, Reymond A, Sun M, Sawa A, Gusella JF, et al. KCTD13 is a major driver of mirrored neuroanatomical phenotypes of the 16p11.2 copy number variant. Nature. 2012;485:363–367. doi: 10.1038/nature11091. [DOI] [PMC free article] [PubMed] [Google Scholar]
- Gotham K, Pickles A, Lord C. Standardizing ADOS scores for a measure of severity in autism spectrum disorders. J Autism Dev Disord. 2009;39:693–705. doi: 10.1007/s10803-008-0674-3. [DOI] [PMC free article] [PubMed] [Google Scholar]
- Gulsuner S, Walsh T, Watts AC, Lee MK, Thornton AM, Casadei S, Rippey C, Shahin H, et al. Consortium on the Genetics of S Group PS. Spatial and temporal mapping of de novo mutations in schizophrenia to a fetal prefrontal cortical network. Cell. 2013;154:518–529. doi: 10.1016/j.cell.2013.06.049. [DOI] [PMC free article] [PubMed] [Google Scholar]
- Hennekam RC, Biesecker LG. Next-generation sequencing demands next-generation phenotyping. Hum Mutat. 2012;33:884–886. doi: 10.1002/humu.22048. [DOI] [PMC free article] [PubMed] [Google Scholar]
- Hittner HM, Hirsch NJ, Kreh GM, Rudolph AJ. Colobomatous microphthalmia, heart disease, hearing loss, and mental retardation--a syndrome. J Pediatr Ophthalmol Strabismus. 1979;16:122–128. doi: 10.3928/0191-3913-19790301-10. [DOI] [PubMed] [Google Scholar]
- Houdayer C. In silico prediction of splice-affecting nucleotide variants. Methods in molecular biology. 2011;760:269–281. doi: 10.1007/978-1-61779-176-5_17. [DOI] [PubMed] [Google Scholar]
- Hwang WY, Fu Y, Reyon D, Maeder ML, Tsai SQ, Sander JD, Peterson RT, Yeh JR, Joung JK. Efficient genome editing in zebrafish using a CRISPR-Cas system. Nat Biotechnol. 2013;31:227–229. doi: 10.1038/nbt.2501. [DOI] [PMC free article] [PubMed] [Google Scholar]
- Iossifov I, Ronemus M, Levy D, Wang Z, Hakker I, Rosenbaum J, Yamrom B, Lee YH, Narzisi G, Leotta A, et al. De novo gene disruptions in children on the autistic spectrum. Neuron. 2012;74:285–299. doi: 10.1016/j.neuron.2012.04.009. [DOI] [PMC free article] [PubMed] [Google Scholar]
- Jao LE, Wente SR, Chen W. Efficient multiplex biallelic zebrafish genome editing using a CRISPR nuclease system. Proceedings of the National Academy of Sciences of the United States of America. 2013;110:13904–13909. doi: 10.1073/pnas.1308335110. [DOI] [PMC free article] [PubMed] [Google Scholar]
- Jiang YH, Yuen RK, Jin X, Wang M, Chen N, Wu X, Ju J, Mei J, Shi Y, He M, et al. Detection of clinically relevant genetic variants in autism spectrum disorder by whole-genome sequencing. Am J Hum Genet. 2013;93:249–263. doi: 10.1016/j.ajhg.2013.06.012. [DOI] [PMC free article] [PubMed] [Google Scholar]
- Kim MS, Chung NG, Kang MR, Yoo NJ, Lee SH. Genetic and expressional alterations of CHD genes in gastric and colorectal cancers. Histopathology. 2011;58:660–668. doi: 10.1111/j.1365-2559.2011.03819.x. [DOI] [PubMed] [Google Scholar]
- Lord C, Petkova E, Hus V, Gan W, Lu F, Martin DM, Ousley O, Guy L, Bernier R, Gerdts J, et al. A multisite study of the clinical diagnosis of different autism spectrum disorders. Arch Gen Psychiatry. 2012;69:306–313. doi: 10.1001/archgenpsychiatry.2011.148. [DOI] [PMC free article] [PubMed] [Google Scholar]
- Neale BM, Kou Y, Liu L, Ma’ayan A, Samocha KE, Sabo A, Lin CF, Stevens C, Wang LS, Makarov V, et al. Patterns and rates of exonic de novo mutations in autism spectrum disorders. Nature. 2012;485:242–245. doi: 10.1038/nature11011. [DOI] [PMC free article] [PubMed] [Google Scholar]
- Nishiyama M, Skoultchi AI, Nakayama KI. Histone H1 recruitment by CHD8 is essential for suppression of the Wnt-beta-catenin signaling pathway. Molecular and cellular biology. 2012;32:501–512. doi: 10.1128/MCB.06409-11. [DOI] [PMC free article] [PubMed] [Google Scholar]
- O’Roak BJ, Vives L, Fu W, Egertson JD, Stanaway IB, Phelps IG, Carvill G, Kumar A, Lee C, Ankenman K, et al. Multiplex targeted sequencing identifies recurrently mutated genes in autism spectrum disorders. Science. 2012a;338:1619–1622. doi: 10.1126/science.1227764. [DOI] [PMC free article] [PubMed] [Google Scholar]
- O’Roak BJ, Vives L, Girirajan S, Karakoc E, Krumm N, Coe BP, Levy R, Ko A, Lee C, Smith JD, et al. Sporadic autism exomes reveal a highly interconnected protein network of de novo mutations. Nature. 2012b;485:246–250. doi: 10.1038/nature10989. [DOI] [PMC free article] [PubMed] [Google Scholar]
- Pagon RA, Graham JM, Jr, Zonana J, Yong SL. Coloboma, congenital heart disease, and choanal atresia with multiple anomalies: CHARGE association. J Pediatr. 1981;99:223–227. doi: 10.1016/s0022-3476(81)80454-4. [DOI] [PubMed] [Google Scholar]
- Rauch A, Wieczorek D, Graf E, Wieland T, Endele S, Schwarzmayr T, Albrecht B, Bartholdi D, Beygo J, Di Donato N, et al. Range of genetic mutations associated with severe non-syndromic sporadic intellectual disability: an exome sequencing study. Lancet. 2012;380:1674–1682. doi: 10.1016/S0140-6736(12)61480-9. [DOI] [PubMed] [Google Scholar]
- Sanders SJ, Murtha MT, Gupta AR, Murdoch JD, Raubeson MJ, Willsey AJ, Ercan-Sencicek AG, DiLullo NM, Parikshak NN, Stein JL, et al. De novo mutations revealed by whole-exome sequencing are strongly associated with autism. Nature. 2012;485:237–241. doi: 10.1038/nature10945. [DOI] [PMC free article] [PubMed] [Google Scholar]
- Sawada G, Ueo H, Matsumura T, Uchi R, Ishibashi M, Mima K, Kurashige J, Takahashi Y, Akiyoshi S, Sudo T, et al. CHD8 is an independent prognostic indicator that regulates Wnt/beta-catenin signaling and the cell cycle in gastric cancer. Oncol Rep. 2013;30:1137–1142. doi: 10.3892/or.2013.2597. [DOI] [PubMed] [Google Scholar]
- Schulze TG, McMahon FJ. Defining the phenotype in human genetic studies: forward genetics and reverse phenotyping. Hum Hered. 2004;58:131–138. doi: 10.1159/000083539. [DOI] [PubMed] [Google Scholar]
- Shen EH, Overly CC, Jones AR. The Allen Human Brain Atlas: comprehensive gene expression mapping of the human brain. Trends Neurosci. 2012;35:711–714. doi: 10.1016/j.tins.2012.09.005. [DOI] [PubMed] [Google Scholar]
- Simon JM, Hacker KE, Singh D, Brannon AR, Parker JS, Weiser M, Ho TH, Kuan PF, Jonasch E, Furey TS, et al. Variation in chromatin accessibility in human kidney cancer links H3K36 methyltransferase loss with widespread RNA processing defects. Genome Res. 2014;24:241–250. doi: 10.1101/gr.158253.113. [DOI] [PMC free article] [PubMed] [Google Scholar]
- Simons VIP Consortium. Simons Variation in Individuals Project (Simons VIP): a genetics-first approach to studying autism spectrum and related neurodevelopmental disorders. Neuron. 2012;73:1063–1067. doi: 10.1016/j.neuron.2012.02.014. [DOI] [PubMed] [Google Scholar]
- Stessman HA, Bernier R, Eichler EE. A genotype-first approach to defining the subtypes of a complex disease. Cell. 2014;156:872–877. doi: 10.1016/j.cell.2014.02.002. [DOI] [PMC free article] [PubMed] [Google Scholar]
- Talkowski ME, Rosenfeld JA, Blumenthal I, Pillalamarri V, Chiang C, Heilbut A, Ernst C, Hanscom C, Rossin E, Lindgren AM, et al. Sequencing chromosomal abnormalities reveals neurodevelopmental loci that confer risk across diagnostic boundaries. Cell. 2012;149:525–537. doi: 10.1016/j.cell.2012.03.028. [DOI] [PMC free article] [PubMed] [Google Scholar]
- Thisse C, Thisse B, Schilling TF, Postlethwait JH. Structure of the zebrafish snail1 gene and its expression in wild-type, spadetail and no tail mutant embryos. Development. 1993;119:1203–1215. doi: 10.1242/dev.119.4.1203. [DOI] [PubMed] [Google Scholar]
- Thompson BA, Tremblay V, Lin G, Bochar DA. CHD8 is an ATP-dependent chromatin remodeling factor that regulates beta-catenin target genes. Molecular and cellular biology. 2008;28:3894–3904. doi: 10.1128/MCB.00322-08. [DOI] [PMC free article] [PubMed] [Google Scholar]
- Vissers LE, van Ravenswaaij CM, Admiraal R, Hurst JA, de Vries BB, Janssen IM, van der Vliet WA, Huys EH, de Jong PJ, Hamel BC, et al. Mutations in a new member of the chromodomain gene family cause CHARGE syndrome. Nat Genet. 2004;36:955–957. doi: 10.1038/ng1407. [DOI] [PubMed] [Google Scholar]
- Weiss LA, Shen Y, Korn JM, Arking DE, Miller DT, Fossdal R, Saemundsen E, Stefansson H, Ferreira MA, Green T, et al. Association between microdeletion and microduplication at 16p11.2 and autism. N Engl J Med. 2008;358:667–675. doi: 10.1056/NEJMoa075974. [DOI] [PubMed] [Google Scholar]
- Westerfield M. A Guide for the Laboratory Use of Zebrafish (Danio rerio) 3. Eugene, OR: University of Oregon Press; 1995. The Zebrafish Book. [Google Scholar]
- Wing L, Gould J. Severe impairments of social interaction and associated abnormalities in children: epidemiology and classification. J Autism Dev Disord. 1979;9:11–29. doi: 10.1007/BF01531288. [DOI] [PubMed] [Google Scholar]
Associated Data
This section collects any data citations, data availability statements, or supplementary materials included in this article.