

Abstract
Proinflammatory pathways in adipose tissue macrophages (ATMs) can impair glucose tolerance in obesity, but ATMs may also be beneficial as repositories for excess lipid that adipocytes are unable to store. To test this hypothesis, we selectively targeted visceral ATMs in obese mice with siRNA against lipoprotein lipase (LPL), leaving macrophages within other organs unaffected. Selective silencing of ATM LPL decreased foam cell formation in visceral adipose tissue of obese mice, consistent with a reduced supply of fatty acids from VLDL hydrolysis. Unexpectedly, silencing LPL also decreased the expression of genes involved in fatty acid uptake (CD36) and esterification in ATMs. This deficit in fatty acid uptake capacity was associated with increased circulating serum free fatty acids. Importantly, ATM LPL silencing also caused a marked increase in circulating fatty acid-binding protein-4, an adipocyte-derived lipid chaperone previously reported to induce liver insulin resistance and glucose intolerance. Consistent with this concept, obese mice with LPL-depleted ATMs exhibited higher hepatic glucose production from pyruvate and glucose intolerance. Silencing CD36 in ATMs also promoted glucose intolerance. Taken together, the data indicate that LPL secreted by ATMs enhances their ability to sequester excess lipid in obese mice, promoting systemic glucose tolerance.
Keywords: siRNA, adipose tissue macrophages, obesity, insulin resistance, foam cells
the inability to appropriately expand adipose tissue (AT) in human obesity may lead to ectopic lipid deposition in liver and skeletal muscle and may be an underlying cause of insulin resistance (14, 17, 26). Accumulation of immune cells including macrophages in the visceral AT of obese mice and humans creates a chronic inflammatory state that correlates with insulin resistance (18, 23, 30). These AT macrophages (ATMs) secrete cytokines and other factors that may impair adipocyte capacity to store lipids (18, 23, 30), promoting the ectopic deposition of lipid in nonadipose tissues. However, some data indicate a beneficial role of ATMs, for example, in increasing adipose lipid storage (16). ATMs are also required for maintenance of AT homeostasis by regulating angiogenesis, extracellular matrix remodeling, and clearance of dead cells in AT (7, 11, 15, 24, 27). It is therefore likely that macrophages exert multiple, even opposing effects on adipocytes, depending upon physiological conditions.
To determine whether ATMs contribute to lipid storage and glucose tolerance, we silenced the expression of lipoprotein lipase (LPL) by ATMs. LPL is released by cells within AT and is translocated to the lumen of adipose capillaries, where it binds the glycosylphosphatidylinositol-anchored high-density lipoprotein-binding protein-1 (GPIHBP1) (1, 21). LPL is known to control localized VLDL triglyceride (TG) hydrolysis and uptake of fatty acids into the tissue (1, 21). The contribution of macrophage-LPL in this function is suggested by experiments showing that depletion of macrophage LPL is effective in reducing lipid-laden foam cell formation in arteries of LDL receptor-null mice (5). Here, we employed glucan-encapsulated siRNA particles (GeRPs) to silence gene expression of LPL specifically in ATMs in obese mice without perturbing macrophages in other tissues, including liver (2, 3, 29). Such selective silencing of LPL in ATMs of obese mice decreased foam cell formation in AT and caused a marked impairment in glucose tolerance, indicating that ATMs contribute to beneficial lipid storage within AT.
METHODS
All procedures involving animals were approved by the Institutional Animal Care and Use Committee at the University of Massachusetts Medical School.
Preparation of GeRPs.
To load siRNA in glucan shells, 3 nmol siRNA (Dharmacon) was incubated with 50 nmol Endo-Porter (Gene Tools) in 30 mM sodium acetate, pH 4.8, for 15 min at room temperature in a final volume of 20 μl. The siRNA/Endo-Porter solution was added to 1 mg (≈109) of glucan shells and then vortexed and incubated for 1 h. The siRNA-loaded GeRPs were then resuspended in PBS and sonicated to ensure homogeneity of the GeRP preparation. GeRPs were kept at 4°C.
Peritoneal macrophage preparation.
Eight-week-old C57BL6/J male mice were intraperitoneally injected with 4% thioglycollate broth (Sigma-Aldrich). Five days following injection, the peritoneal cavity was washed with PBS, and peritoneal fluid was filtered through a 70-μm diameter pore nylon mesh and centrifuged. The pellet was first treated with red blood cell lysis buffer and plated in DMEM supplemented with 10% fetal bovine serum (FBS), 50 μg/ml streptomycin, and 50 U/ml penicillin. Twenty-four hours after isolation, the PECs (peritoneal exudate cells) were treated with siRNA.
Gene silencing by siRNA/EP particles in vitro in cell culture.
siRNA (160 pmol; Dharmacon) was incubated with 3 nmol EP in PBS for 15 min and added to 1 × 10⁶ cells. Forty-eight hours after treatment, mRNA, media, and protein were harvested.
GeRP administration and tissue isolation.
Eight-week-old C57BL6/J or 5-wk-old ob/ob male mice were injected once a day for five days with 5.6 mg/kg GeRPs ip loaded with 2.1 mg/kg EP and 0.262 mg/kg siRNA. Further analyses were performed 24 h after the last injection. siRNA containing GeRPs are taken up by phagocytic cells such as dendritic cells, macrophages and neutrophils.
Isolation of adipocytes, stromal vascular fraction (SVF) cells, and ATMs.
Epididymal fat pads were mechanically dissociated using the gentleMACS Dissociator (Miltenyi Biotec) and collagenase was digested at 37°C for 45 min in Hank's buffered saline solution (HBSS; GIBCO, Life technologies), containing 2% bovine serum albumin (American Bioanalytical) and 2 mg/ml collagenase (Sigma-Aldrich). Samples were then filtered through 100-μm diameter pore nylon mesh and centrifuged. The adipocyte layer was collected and washed for further analysis. The pelleted cells were collected as the SVF. The SVF cells were then treated with red blood cell lysis buffer and washed in PBS and plated or directly harvested for further analysis. For ATM isolation, the SVF pellet was resuspended in 1 ml of selection buffer (PBS, 2 mmol/l EDTA, and 0.5% BSA), and the CD11b-positive cells were selected using CD11b microbeads (Miltenyi Biotec), according to the manufacturer's instructions.
Isolation of RNA and real-time PCR.
RNA isolation was performed according to the TRIzol Reagent protocol (Invitrogen). cDNA was synthesized from 0.5–1 μg of total RNA using an iScript cDNA Synthesis Kit (Bio-Rad) according to the manufacturer's instructions. For real-time PCR, synthesized cDNA, forward and reverse primers along with the iQ SYBR Green Supermix were run on the CFX96 Realtime PCR System (Bio-Rad). The ribosomal mRNA 36B4 was used as an internal loading control, as its expression did not change over a 24-h period with the addition of LPS or siRNA against the genes used in this study.
Western blot.
Protein samples were separated on a 12% SDS-polyacrylamide gel and transferred to a nitrocellulose membrane. Membranes were then analyzed by Western blot analysis using anti-LPL (Abcam) and anti-actin (Sigma-Aldrich) antibodies.
Flow cytometry.
SVF cells from mice treated with FITC-GeRPs were incubated for 20 min in blocking buffer containing 1% BSA and Fc block (eBioscience) for 15 min at 4°C to block nonspecific binding. Cells were then counted and incubated for an additional 20 min in the dark at 4°C with fluorophore-conjugated primary antibodies or isotype control antibodies (AbD Serotec). Antibodies used in these studies included F4/80-APC (AbD Serotec), CD11b-PerCP-Cy5.5 (BD bioscience), and Bodipy-FITC (Invitrogen).
Subsequently, cells were analyzed by flow cytometry in an LSRII cytometer (BD Bioscience). FlowJo software (Treestar) was used to identify the different cell populations; 100,000 events were recorded.
For sorting experiments, SVF cells were run through a FACS Vantage (BD Bioscience). Both FITC+ and FITC− populations were collected, and RNA was harvested for RT-PCR.
Microscopy.
For SVF, fixed cells were incubated with rat anti-mouse F4/80 primary antibody (AbD-Serotec) followed by goat anti-rat Alexa fluor 594 secondary antibody (Invitrogen). Cells were mounted in Prolong Gold anti-fade with DAPI (Invitrogen).
Cell images were obtained with a Solamere CSU10 Spinning Disk confocal system mounted on a Nikon TE2000-E2 inverted microscope.
For tissues, fixed sections were stained with hematoxylin and eosin (H&E). Images were obtained using a Zeiss Axiovert 200 inverted microscope equipped with a Zeiss AxioCam HR CCD camera with 1,300 × 1,030 pixels basic resolution and a Zeiss Plan NeoFluar ×20/0.50 Ph2 (DIC II) objective.
Transmission electron microscopy.
Samples were processed and analyzed at the University of Massachusetts Medical School Electron Microscopy Core Facility according to standard procedures. Briefly, pieces of whole adipose tissue were fixed in 2.5% gluteraldehyde in 0.1 M sodium cacodylate buffer and left overnight at 4°C. The samples were then rinsed twice in the same fixation buffer and postfixed with 1% osmium tetroxide for 1 h at room temperature. Samples were then washed twice with DH2O for 5 min and then dehydrated through a graded ethanol series of 20% increments, before two changes in 100% ethanol. Samples were then infiltrated first with two changes of 100% propylene oxide and then with a 50%/50% propylene oxide-SPI-Pon 812 resin mixture. The following day, three changes of fresh 100% SPI-Pon 812 resin were done before the samples were polymerized at 68°C in plastic capsules. The samples were then thin-sectioned, and the sections were placed on copper support grids and contrasted with lead citrate and uranyl acetate. Sections were examined using the FEI Tecani 12 BT with 80 Kv accelerating voltage, and images were captured using a Gatan TEM CCD camera.
TG, LDL/VLDL, HDL-cholesterol, and FFA measurements.
TG, LDL/VLDL, HDL-cholesterol, and FFA concentrations in serum and liver homogenate were measured using commercial kits according to manufacturer's protocol (Cayman Chemical).
Glucose and pyruvate tolerance tests.
Pyruvate and glucose tolerance tests were performed on ob/ob animals 5 days after GeRP treatment. Pyruvate (1 g/kg) and glucose (1 g/kg) were administered by intraperitoneal injection. Blood samples were withdrawn from the tail vein at the indicated time, and glycemia was determined using glucometers (Bayer-Breeze 2 and Abbott Alphatrak).
Lipolysis assay.
Epididymal fat pads were manually cut into small pieces and collagenase digested at 37°C for 20 min in HBSS containing 2% bovine serum albumin (American Bioanalytical) and 2 mg/ml collagenase (Sigma-Aldrich). Samples were then filtered through 100-μm diameter pore nylon mesh and centrifuged. The adipocyte layer and the supernatant were collected and washed twice with PBS. Adipocytes were then incubated at 37°C in KRH buffer (12.6 mM NaCl, 0.14 M KCl, 1 M CaCl2, 1.2 M MgSO4, 1.2 M KHPO4, 1 M HEPES, pH 7.2) in the absence or presence of 10 μM isoproterenol (Sigma) for 2 h. The medium was collected and assayed for glycerol content using a commercial colorimetric assay kit from Sigma according to the manufacturer's protocol.
aP2 secretion analysis.
Adipocytes were isolated from untreated ob/ob mice and incubated for 1 h in DMEM containing 10% fetal bovine serum and 1% penicillin-streptomycin. Adipocytes were then washed in PBS and incubated for 1 h in the different conditioned media. Next, fresh medium was added to adipocytes, and aP2 was measured after 1 h. aP2 levels in media and serum were measured by ELISA (Biovendor) according to the manufacturer's protocol.
Statistics.
The statistical significance of the differences in the means of experimental groups was determined by Student's t-test or one-way or two-way ANOVA and Bonferroni or Tukey's posttests using GraphPad Prism 5.0a software. The data are presented as means ± SE.
RESULTS AND DISCUSSION
Lipid uptake by ATMs increases with obesity.
Most relevant literature describes ATMs as detrimental to whole body metabolism through secretion of inflammatory cytokines and other factors that may impair adipocyte function (18, 23, 30). However, recent work has indicated a beneficial role of ATMs, for example in increasing adipose lipid storage (16). To determine the role of ATM lipid handling in systemic metabolism, we first measured the effect of obesity on formation of lipid-laden macrophages in the AT. Flow cytometry was performed on the SVF of 6-wk-old obese ob/ob mice and wild-type (WT) lean controls, using antibodies against the macrophage markers F4/80 and CD11b and the lipid stain bodipy (Fig. 1). We first confirmed that macrophage content was increased in epididymal AT (visceral AT; VAT) of ob/ob compared with WT mice (data not shown). Consistent with previous studies (25), the percentage of lipid-laden macrophages (defined as bodipy+/F4/80+/CD11b+) was significantly increased in the VAT of ob/ob compared with WT mice (Fig. 1, A and B). To confirm the presence of foam cells in AT, fluorescence and transmission electron microscopy (TEM) were performed on epididymal SVF of ob/ob mice (Fig. 1, C and D). Figure 1C shows a representative macrophage (F4/80, red) containing lipid droplets (bodipy, green). Interestingly, lipid-laden ATMs were multinucleated, as previously described (31). The TEM image presented shows a macrophage with characteristics described in previous studies (19, 30), with lipid droplets (arrows) confirming the presence of lipid-laden macrophages in the VAT of ob/ob mice (Fig. 1D). Together, these data indicate that lipid uptake by macrophages in the VAT is increased with obesity.
Fig. 1.

Formation of lipid-laden macrophages in epididymal adipose tissue (AT) of obese mice. Stromal vascular fraction (SVF) from epididymal AT (visceral AT; VAT) of WT and ob/ob mice was isolated and analyzed by flow cytometry. A: representative flow cytometry dot plots and mean fluorescence intensity (MFI) of AT macrophages (ATMs) stained with bodipy. B: percentage of macrophages stained with bodipy; n = 10. C: microscopy of SVF isolated from ob/ob VAT stained with antibodies against F4/80 (red) and bodipy (green); ×20 (scale bar, 50 μm). D: TEM of whole VAT of ob/ob mice; A, adipocyte; M, macrophage; arrows, lipid droplet; scale bar, 2 μm. E: gene expression measured by RT-PCR in SVF isolated from VAT of WT and ob/ob mice; n = 5. Results are mean fold change (FC) ± SE. F: gene expression measured by RT-PCR in macrophages isolated using CD11b antibody bound to magnetic beads; n = 5. All graphs are expressed as means ± SE. Statistical significance was determined by Student's t-test. ***P < 0.001, **P < 0.01, *P < 0.05.
Consistent with an increased inflammatory state in the AT of obese mice, the expression of the inflammatory cytokines tumor necrosis factor-α (TNF-α) and interleukin-1β (IL-1β) was significantly increased in ob/ob compared with WT AT (Fig. 1E). Surprisingly, whereas the expression of multiple genes involved in lipid uptake, synthesis, and storage was decreased in the SVF of obese compared with WT animals, the expression of LPL was significantly higher in the SVF of obese compared with lean mice (Fig. 1E). Because the SVF contains multiple cell types, which could contribute to the variation in gene expression, we isolated ATMs by using CD11b magnetic bead pull-down from WT and ob/ob AT. We then measured the expression of LPL as well as other genes involved in lipid metabolism, including fatty acid synthase (FASN), CD36, VLDL receptor (VLDLr), peroxisome proliferator-activated receptor-γ (PPARγ), stearoyl-CoA desaturase-1 (SCD1), and fatty acid-binding protein-4 (fabp4/aP2) (Fig. 1F). Similarly to the SVF, only the expression of LPL was significantly increased in epididymal ATMs of ob/ob mice compared with their lean WT littermates (Fig. 1F). This finding is consistent with data showing that ATMs mostly accumulate lipids via activation of lipid uptake rather than de novo lipogenesis (25).
GeRP-mediated LPL silencing decreases lipid uptake by ATMs.
Primary peritoneal macrophages were used to screen for potent siRNAs against LPL, and two sequences were chosen (Fig. 2, A and B). Both siRNA sequences against the target gene significantly silenced the expression of LPL (Fig. 2A). Furthermore, LPL protein levels were significantly silenced by the targeting siRNAs compared with scrambled (SCR) siRNA or no treatment (Fig. 2B). These data reveal that LPL can be depleted by LPL siRNA in primary macrophages in vitro, as detected either at either the mRNA or the protein level.
Fig. 2.

Glucan-encapsulated siRNA particle (GeRP)-mediated ATM LPL silencing decreases formation of lipid-laden macrophages in VAT of obese mice. Peritoneal macrophages (1 × 10⁶) were treated with particles made with a mixture of 160 pmol siRNA and 3 nmol EP. Forty-eight hours after treatment, mRNA levels were measured by RT-PCR (A) and protein by Western blot (B). C: outline of GeRP treatment given to mice. Briefly, mice were injected for 5 consecutive days with 5.6 mg GeRPs/kg body wt loaded with 262 μg siRNA/kg body wt and 2.1 mg EP/kg body wt. On day 6, tissues were isolated. D: mRNA expression of LPL in VAT and liver from mice treated with SCR- or LPL-GeRPs; n = 14–15. E: representative LPL Western blot and densitometry using epididymal SVF lysates from mice treated with SCR- or LPL -GeRPs. Actin was used as a loading control. Statistical significance was determined by Student's t-test. **P < 0.01, *P < 0.05. F: representative flow cytometry dot plots and MFI of ATMs stained with bodipy. G: Percentage of macrophages expressing bodipy; n = 10. All graphs are expressed as means ± SE. Statistical significance was determined by Student's t-test. ***P < 0.001, **P < 0.01, *P < 0.05. H: TEM of whole VAT from ob/ob mice treated with SCR- or LPL-GeRPs; A, adipocyte; arrows, GeRPs. Scale bar, 5 μm.
To test the hypothesis that LPL is required for lipid uptake by macrophages in AT, LPL was selectively depleted in ATMs of obese mice by intraperitoneal injections with GeRPs loaded with SCR or LPL siRNA (see protocol outline in Fig. 2C). As previously described (2), silencing was specific to visceral phagocytes, as no depletion of the target gene products was observed in livers of GeRP-treated mice (Fig. 2D). Other studies we have performed showed no gene silencing with this technique in macrophages present in other tissues of the obese mice, including lung, pancreas, spleen, and muscle (2). LPL protein levels in SVF isolated from epididymal AT of mice treated with LPL-GeRPs were also significantly reduced compared with mice treated with SCR-GeRPs (Fig. 2E). Importantly, flow cytometry showed that silencing LPL in ATMs significantly decreased lipid accumulation in VAT macrophage (Fig. 2, F and G), whereas it had no effect on total macrophage content in VAT (data not shown). Careful analysis of epididymal AT sections by TEM showed lipid droplets in macrophages containing GeRPs within AT. Treatment with LPL-GeRPs reduced the presence of these lipid droplets in ATM (Fig. 2H). These results suggested that ATM LPL contributes to obesity-induced lipid uptake by macrophages in VAT.
LPL silencing in ATMs increases serum FFA levels.
Although lipid uptake by ATMs has been suggested to contribute to lipid storage in AT (4, 16), LPL deficiency in macrophages throughout the body did not regulate adiposity in mice fed a HFD (28). Similarly, we found that body weight gain, epididymal fad pad weight, and adipocyte number and size were unchanged following LPL silencing specific to epididymal ATMs over this relatively short period (data not shown). Treatment of ob/ob mice with LPL-GeRPs also had no impact on serum TG levels, LDL/VLDL-cholesterol, and HDL-cholesterol (Fig. 3, A and B), consistent with a recent study showing that LPL depletion in the myeloid lineage has no effect on circulating TG and cholesterol levels (28). Therefore, steady-state circulating TG levels could be maintained in mice treated with LPL-GeRPs compared with SCR-GeRPs by the normal expression of LPL in other tissues.
Fig. 3.

LPL silencing in ATMs increases plasma FFA. Serum triglyceride (TG; A) and LDL/VLDL and HDL cholesterol (B) in mice treated with scrambled (SCR)- or LPL-GeRPs; n = 10. C: serum FFA levels; n = 14–15. D: adipose triglyceride lipase (ATGL) and HSL expression in adipocytes isolated from ob/ob mice treated with SCR- or LPL-GeRPs; n = 14–15. E: glycerol levels in media of isolated adipocytes in untreated (UNT) or treated with 10 μM isoproterenol (ISO) for 2 h; n = 5. Gene expression measured by RT-PCR in SVF (n = 14–15; F) and ATMs containing GeRPs sorted by FACS (n = 5; G). H: representative dot-plot and percentage of ATMs expressing bodipy in fed and fasted states in VAT; n = 10. All graphs are expressed as means ± SE. Statistical significance was determined by Student's t-test. ***P < 0.001, *P < 0.05; n/s, not significant.
Although LPL silencing had no impact on serum TG and cholesterol levels, serum FFA levels were significantly increased following ATM LPL silencing (Fig. 3C). One study suggested that ATMs can buffer local increases in lipid and suppress local adipocyte lipolysis, decreasing lipid levels in the circulation (16). In an effort to test whether LPL silencing in ATMs increased serum FFA levels through regulation of lipid release by adipocytes, we found that LPL depletion in ATMs had no effect on the expression of hormone-sensitive lipase (HSL) and adipose triglyceride lipase (ATGL), involved in lipolysis (Fig. 3D). In addition, lipolysis under basal conditions or following β-adrenergic stimulation by isoproterenol remained unchanged in isolated adipocytes derived from mice treated with LPL-GeRPs or SCR-GeRPs (Fig. 3E). Consistently, LPL-GeRP treatment had no effect on serum glycerol levels in mice fasted overnight (data not shown). These results suggested that the increased circulating FFA levels observed in mice treated with LPL-GeRPs could be due to a decreased ability of ATMs to store excess lipids released by adipocytes in the obese state rather than a direct regulation of lipolysis by macrophages.
In testing this idea, we found that LPL silencing in ATMs not only decreased LPL mRNA but also caused an overall trend toward decreasing the expression of genes involved in lipid metabolism in SVF (Fig. 3F). LPL silencing in ATMs also resulted in a significant decrease of CD36 and diglyceride acyltransferase-2 (DGAT2) expression when measured in SVF cells isolated by fluorescence-activated cell sorting (FACS) on the basis of their FITC-GeRP signal. This was consistent with a decreased FFA uptake and esterification by ATMs following LPL silencing (Fig. 3G). To confirm this hypothesis, we measured the percentage of foam cells in AT following fasting-induced lipolysis (Fig. 3H). Consistent with the idea that ATMs take up FFA released by adipocytes in fasting condition (16), in obese mice treated with PBS, fasting increased the percentage of bodipy+ ATMs (Fig. 3H). Furthermore, flow cytometry analysis showed that the increase in bodipy+ ATMs under fasting condition was blocked following LPL silencing in ATMs (Fig. 3H). Taken together, these results suggest that silencing LPL unexpectedly decreases the capacity of ATMs to take up the excess FFA released by adipocytes. A potential mechanism for this surprising effect may relate to studies suggesting that hydrolysis of TG by LPL releases ligands for PPARα/δ transcription factors known to drive the expression of lipogenic genes including DGAT2 and CD36 that are decreased by ATM LPL silencing (9, 32). However, LPL silencing decreased the expression of CD36 and DGAT2, while the expression of other PPAR target genes remained unchanged. Although additional work would be needed to unravel the mechanism whereby LPL silencing secondarily decreases CD36 and DGAT2 gene expression, previous studies (8, 22) as well as our work suggest that different transcription factors, coactivators, or repressors may be involved in the transcriptional regulation of lipogenic genes in macrophages deficient in LPL.
Silencing LPL in visceral ATMs exacerbates glucose intolerance in ob/ob mice.
Increased serum FFA levels have been shown to positively regulate glucose production by liver (6, 10, 12). Although hepatic steatosis, as observed in H&E-stained liver sections and liver TG content, was unchanged following LPL silencing (Fig. 4, A and B), the expression of two gluconeogenic enzymes, phosphoenolpyruvate carboxykinase (PEPCK) and glucose-6-phosphatase (G6Pase), was significantly increased in livers from ob/ob mice treated with LPL-GeRPs compared with SCR-GeRPs (Fig. 4C). To further assess hepatic glucose production, mice were challenged with the gluconeogenic precursor pyruvate (Fig. 4D). Silencing LPL in visceral ATMs exacerbated pyruvate intolerance in mice treated with LPL- compared with SCR-GeRPs (Fig. 4D). Given that increased hepatic glucose output often results in exacerbated systemic glucose tolerance, we performed glucose tolerance tests (GTT) in ob/ob mice treated with LPL-GeRPs or SCR-GeRPs (Fig. 4E). Mice treated with LPL-GeRPs were significantly less glucose tolerant than mice treated with SCR-GeRPs (Fig. 4E). This effect on glucose tolerance occurred independently of an effect on insulin tolerance, fasting glucose, or insulin levels, or islet morphology (data not shown).
Fig. 4.

LPL silencing in ATMs exacerbates glucose intolerance in ob/ob mice. A: H&E liver sections of mice treated with SCR- or LPL GeRPs; ×20 magnification images; scale bar, 5 μm. B: liver TG content; n = 10. C: PEPCK and G6Pase expression in liver of ob/ob mice treated with SCR- or LPL-GeRPs; n = 10. D: pyruvate tolerance test and area under the curve (AUC); n = 10. E: glucose tolerance tests (GTT) and AUC, n = 14–15, performed on mice fasted for 18 h. F: GTT performed on ob/ob mice treated with SCR- or CD36-GeRPs; n = 5. G: GTT performed on 8-wk-old C57BL6 lean mice treated with SCR- or LPL-GeRPs; n = 5. H: serum FFA levels in lean mice treated with SCR- or LPL-GeRPs; n = 5. Results are means ± SE. Statistical significance was determined by t-test or ANOVA and Tukey's posttest. ***P < 0.001, *P < 0.05.
Since LPL silencing resulted in a significant decrease in CD36 expression in ATMs, we also performed GTT in mice treated with SCR- or CD36-GeRPs. Similar to LPL silencing, CD36 knockdown in ATMs led to a further impairment of glucose tolerance in ob/ob mice (Fig. 4F). However, CD36 deficiency in hematopoietic cells obtained with bone marrow transplantation was shown to decrease the accumulation of immune cells within AT in obesity, with a concomitant improvement in insulin action (20). This discrepancy could be explained by the use of bone marrow transplantation in this previous study, which affects all immune cells rather than phagocytes specifically. Indeed, CD36 has been shown to play opposite roles in the regulation of insulin sensitivity depending on the tissue in which it functions (13). Interestingly, treatment of lean healthy mice with LPL-GeRPs had no significant effect on glucose tolerance or circulating FFA (Fig. 4, G and H). This confirmed the ability of AT in lean healthy mice to appropriately store lipids and the minimal role that ATMs play in this process in lean mice. However, ATMs may contribute to lipid storage in the AT of obese mice, thus preventing glucose intolerance induced by increased circulating FFA.
Silencing LPL in visceral ATMs increases fatty aP2 production by adipocytes in ob/ob mice.
To further investigate the mechanism whereby LPL silencing in ATMs exacerbates glucose intolerance in obese mice, we measured the expression of lipogenic and inflammatory genes in the AT of mice treated with LPL-GeRPs compared with SCR-GeRPs (Fig. 5A). Interestingly, whereas the expression of several lipogenic and inflammation-related genes remained unchanged, the expression of aP2 was significantly increased in the AT of mice treated with LPL-GeRPs (Fig. 5A). Moreover, RT-PCR analysis revealed that aP2 expression was significantly increased in isolated adipocytes recovered from VAT of mice treated with LPL-GeRPs compared with SCR-GeRPs (Fig. 5B). Importantly, aP2 levels in the serum were also significantly increased in mice treated with LPL-GeRPs compared with SCR-GeRPs (Fig. 5C). Interestingly, a recent study showed that aP2 could be secreted by adipocytes (6). To test this hypothesis, primary adipocytes were treated with medium containing 10% serum or conditioned medium of SVF isolated from ob/ob mice treated with SCR- or LPL-GeRPs (Fig. 5D). After 1-h incubation medium was removed and fresh medium added to avoid measurement of aP2 present in conditioned medium. Although media of SVF had no effect on aP2 protein levels, we found that treatment of adipocytes with serum from mice treated with LPL-GeRPs increased aP2 levels compared with serum of mice treated with SCR-GeRPs (Fig. 5D). These results confirmed that silencing LPL in ATMs induces aP2 secretion from adipocytes and showed that this regulation occurs through an endocrine rather than a paracrine mechanism. Interestingly, although secretion of aP2 from adipocytes has been shown to be regulated by lipolysis-related signals (6), in our model aP2 production by adipocytes occurred independently of an effect on lipolysis (Fig. 3E).
Fig. 5.

LPL silencing in ATMs increases aP2 production by adipocytes. A: gene expression measured by RT-PCR in VAT (A) and adipocytes (B) isolated from of ob/ob mice treated with SCR- or LPL-GeRPs; n = 14–15. C: serum aP2 levels; n = 14–15. D: aP2 protein levels in media of intact adipocytes measured by ELISA. Adipocytes were treated with media containing serum or conditioned media from SVF; n = 4. Results are means ± SE. Statistical significance was determined by t-test or ANOVA and Tukey's posttest. *P < 0.05.
Because treatment of mice with recombinant aP2 has been shown to increase hepatic glucose production, whereas aP2 neutralization reduced it (6), silencing LPL in ATMs may exacerbate glucose intolerance and hepatic glucose production not only by increasing circulating FFA but also by inducing aP2 secretion. Taken together, these results show that silencing LPL in ATMs exacerbates glucose intolerance and hepatic glucose production (See model in Fig. 6). This impairment in glucose homeostasis is accompanied by an increase in serum FFA and aP2 levels in obese mice. Additional work will be needed to test whether there is a causal relationship between the increases in serum FFA and aP2 and glucose intolerance in obese mice following LPL silencing in ATMs.
Fig. 6.
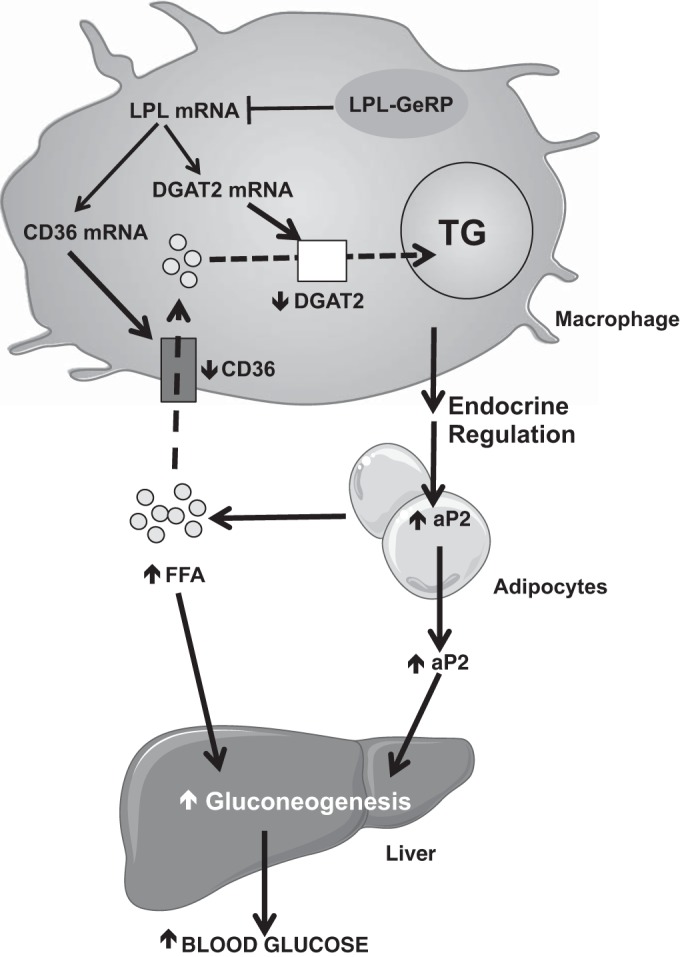
Hypothetical model for how LPL produced by ATMs can regulate whole body glucose metabolism. LPL silencing in ATMs secondarily decreases the expression of CD36 and DGAT2 by mechanisms not understood. This results in reduced lipid uptake (via CD36) and esterification (via DGAT2) by ATMs and a concomitant increase in circulating FFA. In parallel, silencing LPL in ATMs is accompanied by an increase in aP2 expression and secretion by adipocytes. The increases in circulating aP2 and FFA may enhance hepatic gluconeogenesis, thus contributing to the impairment of glucose tolerance observed in ob/ob mice following LPL silencing in ATMs. Short vertical arrows indicate effects (arrow up, increase; arrow down, decrease) on specific components or pathways in response to silencing LPL in ATMs.
GRANTS
These studies were supported by grants to M. P. Czech from the National Institutes of Health (NIH) (DK-085753, AI-046629, DK-030898) and the International Research Alliance of the Novo Nordisk Foundation Center for Metabolic Research. We also acknowledge the invaluable help of the morphology Core Facility at the University of Massachusetts Diabetes and Endocrinology Research Center, also funded by the National Institutes of Health (DK-325220). J. L. C is supported by the National Institute of Diabetes and Digestive and Kidney Diseases of the National Institutes of Health under NRSA postdoctoral fellowship F32 DK-098879. J. C. Yawe is supported by a predoctoral Ruth L. Kirschstein National Research Service Award from the NIH (DK-096948-02).
DISCLOSURES
No conflicts of interest, financial or otherwise, are declared by the author(s).
AUTHOR CONTRIBUTIONS
Author contributions: M.A., P.V., and M.P.C. conception and design of research; M.A., P.V., J.C.Y., M.T., J.L.C., S.M.N., and Y.S. performed experiments; M.A., P.V., J.C.Y., M.T., and S.M.N. analyzed data; M.A., P.V., J.C.Y., M.T., and S.M.N. interpreted results of experiments; M.A. prepared figures; M.A. drafted manuscript; M.A. and M.P.C. edited and revised manuscript; M.A., P.V., J.C.Y., M.T., J.L.C., S.M.N., Y.S., and M.P.C. approved final version of manuscript.
ACKNOWLEDGMENTS
We thank members of our laboratory group for excellent discussion of the data in this paper. We also appreciate the help of the Flow Cytometry and the Confocal Microscopy Core Facilities, and we thank Gregory Hendricks and Lara Strittmatter at the University of Massachusetts Medical School for the electron micrographs, supported by a grant from the National Center For Research Resources (S10 RR-027897).
REFERENCES
- 1.Adeyo O, Goulbourne CN, Bensadoun A, Beigneux AP, Fong LG, Young SG. Glycosylphosphatidylinositol-anchored high-density lipoprotein-binding protein 1 and the intravascular processing of triglyceride-rich lipoproteins. J Intern Med 272: 528–540, 2012 [DOI] [PMC free article] [PubMed] [Google Scholar]
- 2.Aouadi M, Tencerova M, Vangala P, Yawe JC, Nicoloro SM, Amano SU, Cohen JL, Czech MP. Gene silencing in adipose tissue macrophages regulates whole body metabolism in obese mice. Proc Natl Acad Sci USA 110: 8278–8283, 2013 [DOI] [PMC free article] [PubMed] [Google Scholar]
- 3.Aouadi M, Tesz GJ, Nicoloro SM, Wang M, Chouinard M, Soto E, Ostroff GR, Czech MP. Orally delivered siRNA targeting macrophage Map4k4 suppresses systemic inflammation. Nature 458: 1180–1184, 2009 [DOI] [PMC free article] [PubMed] [Google Scholar]
- 4.Asterholm IW, McDonald J, Blanchard PG, Sinha M, Xiao Q, Mistry J, Rutkowski JM, Deshaies Y, Brekken RA, Scherer PE. Lack of “immunological fitness” during fasting in metabolically challenged animals. J Lipid Res 53: 1254–1267, 2012 [DOI] [PMC free article] [PubMed] [Google Scholar]
- 5.Babaev VR, Patel MB, Semenkovich CF, Fazio S, Linton MF. Macrophage lipoprotein lipase promotes foam cell formation and atherosclerosis in low density lipoprotein receptor-deficient mice. J Biol Chem 275: 26293–26299, 2000 [DOI] [PubMed] [Google Scholar]
- 6.Cao H, Sekiya M, Ertunc ME, Burak MF, Mayers JR, White A, Inouye K, Rickey LM, Ercal BC, Furuhashi M, Tuncman G, Hotamisligil GS. Adipocyte lipid chaperone AP2 is a secreted adipokine regulating hepatic glucose production. Cell Metab 17: 768–778, 2013 [DOI] [PMC free article] [PubMed] [Google Scholar]
- 7.Cao Y. Angiogenesis modulates adipogenesis and obesity. J Clin Invest 117: 2362–2368, 2007 [DOI] [PMC free article] [PubMed] [Google Scholar]
- 8.Chawla A, Barak Y, Nagy L, Liao D, Tontonoz P, Evans RM. PPAR-gamma dependent and independent effects on macrophage-gene expression in lipid metabolism and inflammation. Nat Med 7: 48–52, 2001 [DOI] [PubMed] [Google Scholar]
- 9.Chawla A, Lee CH, Barak Y, He W, Rosenfeld J, Liao D, Han J, Kang H, Evans RM. PPARdelta is a very low-density lipoprotein sensor in macrophages. Proc Natl Acad Sci USA 100: 1268–1273, 2003 [DOI] [PMC free article] [PubMed] [Google Scholar]
- 10.Chen X, Iqbal N, Boden G. The effects of free fatty acids on gluconeogenesis and glycogenolysis in normal subjects. J Clin Invest 103: 365–372, 1999 [DOI] [PMC free article] [PubMed] [Google Scholar]
- 11.Christiaens V, Lijnen HR. Angiogenesis and development of adipose tissue. Mol Cell Endocrinol 318: 2–9, 2010 [DOI] [PubMed] [Google Scholar]
- 12.Donnelly KL, Smith CI, Schwarzenberg SJ, Jessurun J, Boldt MD, Parks EJ. Sources of fatty acids stored in liver and secreted via lipoproteins in patients with nonalcoholic fatty liver disease. J Clin Invest 115: 1343–1351, 2005 [DOI] [PMC free article] [PubMed] [Google Scholar]
- 13.Goudriaan JR, Dahlmans VE, Teusink B, Ouwens DM, Febbraio M, Maassen JA, Romijn JA, Havekes LM, Voshol PJ. CD36 deficiency increases insulin sensitivity in muscle, but induces insulin resistance in the liver in mice. J Lipid Res 44: 2270–2277, 2003 [DOI] [PubMed] [Google Scholar]
- 14.Guilherme A, Virbasius JV, Puri V, Czech MP. Adipocyte dysfunctions linking obesity to insulin resistance and type 2 diabetes. Nat Rev Mol Cell Biol 9: 367–377, 2008 [DOI] [PMC free article] [PubMed] [Google Scholar]
- 15.Halberg N, Khan T, Trujillo ME, Wernstedt-Asterholm I, Attie AD, Sherwani S, Wang ZV, Landskroner-Eiger S, Dineen S, Magalang UJ, Brekken RA, Scherer PE. Hypoxia-inducible factor 1alpha induces fibrosis and insulin resistance in white adipose tissue. Mol Cell Biol 29: 4467–4483, 2009 [DOI] [PMC free article] [PubMed] [Google Scholar]
- 16.Kosteli A, Sugaru E, Haemmerle G, Martin JF, Lei J, Zechner R, Ferrante AW., Jr Weight loss and lipolysis promote a dynamic immune response in murine adipose tissue. J Clin Invest 120: 3466–3479, 2010 [DOI] [PMC free article] [PubMed] [Google Scholar]
- 17.Kusminski CM, Shetty S, Orci L, Unger RH, Scherer PE. Diabetes and apoptosis: lipotoxicity. Apoptosis 14: 1484–1495, 2009 [DOI] [PubMed] [Google Scholar]
- 18.Lumeng CN, Saltiel AR. Inflammatory links between obesity and metabolic disease. J Clin Invest 121: 2111–2117, 2011 [DOI] [PMC free article] [PubMed] [Google Scholar]
- 19.Murano I, Barbatelli G, Parisani V, Latini C, Muzzonigro G, Castellucci M, Cinti S. Dead adipocytes, detected as crown-like structures, are prevalent in visceral fat depots of genetically obese mice. J Lipid Res 49: 1562–1568, 2008 [DOI] [PubMed] [Google Scholar]
- 20.Nicholls HT, Kowalski G, Kennedy DJ, Risis S, Zaffino LA, Watson N, Kanellakis P, Watt MJ, Bobik A, Bonen A, Febbraio M, Lancaster GI, Febbraio MA. Hematopoietic cell-restricted deletion of CD36 reduces high-fat diet-induced macrophage infiltration and improves insulin signaling in adipose tissue. Diabetes 60: 1100–1110, 2011 [DOI] [PMC free article] [PubMed] [Google Scholar]
- 21.Obunike JC, Lutz EP, Li Z, Paka L, Katopodis T, Strickland DK, Kozarsky KF, Pillarisetti S, Goldberg IJ. Transcytosis of lipoprotein lipase across cultured endothelial cells requires both heparan sulfate proteoglycans and the very low density lipoprotein receptor. J Biol Chem 276: 8934–8941, 2001 [DOI] [PubMed] [Google Scholar]
- 22.Olagnier D, Lavergne RA, Meunier E, Lefevre L, Dardenne C, Aubouy A, Benoit-Vical F, Ryffel B, Coste A, Berry A, Pipy B. Nrf2, a PPARgamma alternative pathway to promote CD36 expression on inflammatory macrophages: implication for malaria. PLoS Pathog 7: e1002254, 2011 [DOI] [PMC free article] [PubMed] [Google Scholar]
- 23.Olefsky JM, Glass CK. Macrophages, inflammation, and insulin resistance. Annu Rev Physiol 72: 219–246, 2010 [DOI] [PubMed] [Google Scholar]
- 24.Pang C, Gao Z, Yin J, Zhang J, Jia W, Ye J. Macrophage infiltration into adipose tissue may promote angiogenesis for adipose tissue remodeling in obesity. Am J Physiol Endocrinol Metab 295: E313–E322, 2008 [DOI] [PMC free article] [PubMed] [Google Scholar]
- 25.Prieur X, Mok CY, Velagapudi VR, Nunez V, Fuentes L, Montaner D, Ishikawa K, Camacho A, Barbarroja N, O'Rahilly S, Sethi JK, Dopazo J, Oresic M, Ricote M, Vidal-Puig A. Differential lipid partitioning between adipocytes and tissue macrophages modulates macrophage lipotoxicity and M2/M1 polarization in obese mice. Diabetes 60: 797–809, 2011 [DOI] [PMC free article] [PubMed] [Google Scholar]
- 26.Samuel VT, Petersen KF, Shulman GI. Lipid-induced insulin resistance: unravelling the mechanism. Lancet 375: 2267–2277, 2010 [DOI] [PMC free article] [PubMed] [Google Scholar]
- 27.Sun K, Kusminski CM, Scherer PE. Adipose tissue remodeling and obesity. J Clin Invest 121: 2094–2101, 2011 [DOI] [PMC free article] [PubMed] [Google Scholar]
- 28.Takahashi M, Yagyu H, Tazoe F, Nagashima S, Ohshiro T, Okada K, Osuga J, Goldberg IJ, Ishibashi S. Macrophage lipoprotein lipase modulates the development of atherosclerosis but not adiposity. J Lipid Res 54: 1124–1134, 2013 [DOI] [PMC free article] [PubMed] [Google Scholar]
- 29.Tesz GJ, Aouadi M, Prot M, Nicoloro SM, Boutet E, Amano SU, Goller A, Wang M, Guo CA, Salomon WE, Virbasius JV, Baum RA, O'Connor MJ, Jr, Soto E, Ostroff GR, Czech MP. Glucan particles for selective delivery of siRNA to phagocytic cells in mice. Biochem J 436: 351–362, 2011 [DOI] [PubMed] [Google Scholar]
- 30.Weisberg SP, McCann D, Desai M, Rosenbaum M, Leibel RL, Ferrante AW., Jr Obesity is associated with macrophage accumulation in adipose tissue. J Clin Invest 112: 1796–1808, 2003 [DOI] [PMC free article] [PubMed] [Google Scholar]
- 31.Xu X, Grijalva A, Skowronski A, van Eijk M, Serlie MJ, Ferrante AW., Jr Obesity activates a program of lysosomal-dependent lipid metabolism in adipose tissue macrophages independently of classic activation. Cell Metab 18: 816–830, 2013 [DOI] [PMC free article] [PubMed] [Google Scholar]
- 32.Ziouzenkova O, Perrey S, Asatryan L, Hwang J, MacNaul KL, Moller DE, Rader DJ, Sevanian A, Zechner R, Hoefler G, Plutzky J. Lipolysis of triglyceride-rich lipoproteins generates PPAR ligands: evidence for an antiinflammatory role for lipoprotein lipase. Proc Natl Acad Sci USA 100: 2730–2735, 2003 [DOI] [PMC free article] [PubMed] [Google Scholar]